In partial fulfillment of the requirement for the degree of Master of Science in Mechanical Engineering. Sultan Salauddin, student no in partial fulfillment of the requirements for the degree of Master of Science in Mechanical Engineering.

ABSTRACT
NOMENCLATURE
INTRODUCTION
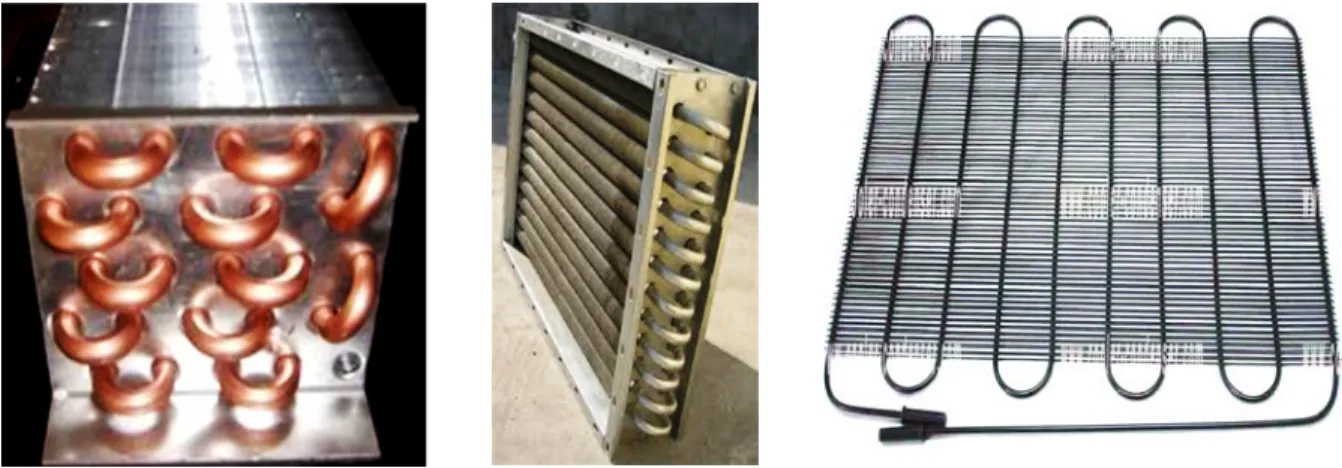
- Application of U-type wavy tubes
- Flow though U-type wavy tubes
- Background and Literature Survey
- Flow through bent pipes and curved tubes
- Flow through return bends or U-bends
- Flow through wavy and corrugated tubes
- Flow through U-type wavy tubes
- Objective of the present thesis
- Introduction
- Experimental Setup
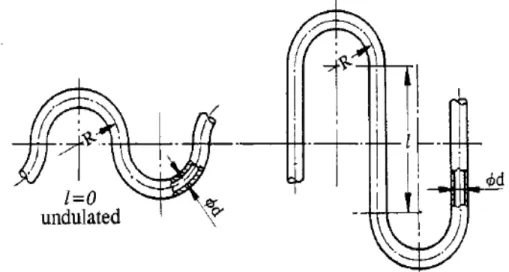
The secondary flow is superimposed on the primary flow so that the resultant flow is spiral in the upper and lower half of the tube. Among others, the work of Ito [1960] on pressure loss in smooth pipe bends is one of the older works in this area. The effect of dimensionless wavelength and amplitude on the Darcy friction factor was investigated in the Reynolds number range from about 100 to 10,000 for different values of wavelength and amplitude.
Later, the influence of the presence of oil on R-410a two-phase frictional pressure drop in a small U-type corrugated pipe was investigated by Chen et al. After a certain spacer length, bending friction factor change becomes independent of the number of bends and spacer length, which defines the critical spacer length. To study the effect of spacer length and number of bends on bending friction factor and experimentally determine the critical value of the dimensionless spacer length.
As mentioned in the previous chapter, the main objective of this work is to conduct an experimental study on the effect of spacer length and the number of turns on the bending friction factor and to determine the critical value of dimensionless spacer length. When testing the effect of spacer length and spacer length to diameter ratio, the spacer length (L) was varied, but the diameter (d) and radius of curvature (R) of the set of test sections were fixed.
Mercury manometer Working Table
Wooden Frame
Centrifugal Pump
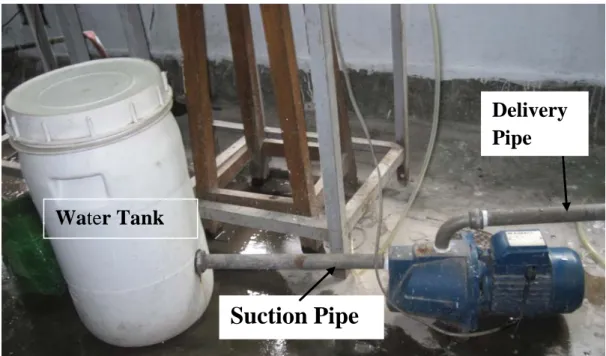
Water Tank
Test Section
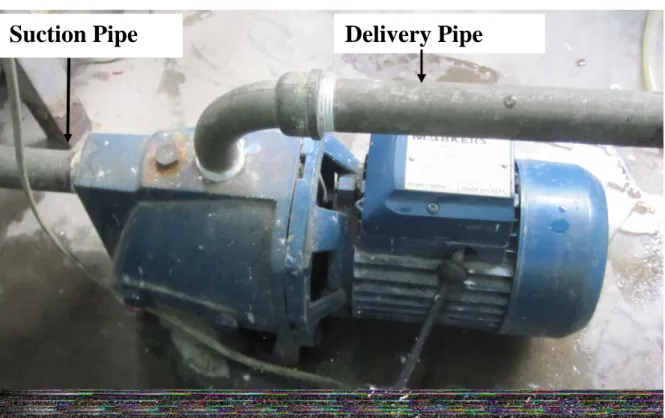
Centrifugal pump
Suction Pipe Delivery Pipe
Gate Valves
The water flow rate is controlled by the shut-off valve V-1, which is located immediately after the delivery of the pump.
Gate valve
Suction Pipe
Water Tank
Measuring Flask
Wooden Frame
Variable Spacer Wooden frame
- U-tube mercury manometer
- Socket Reducer
- T-joint
- Flow control valve
- Experimental Procedure
- Uncertainty analysis
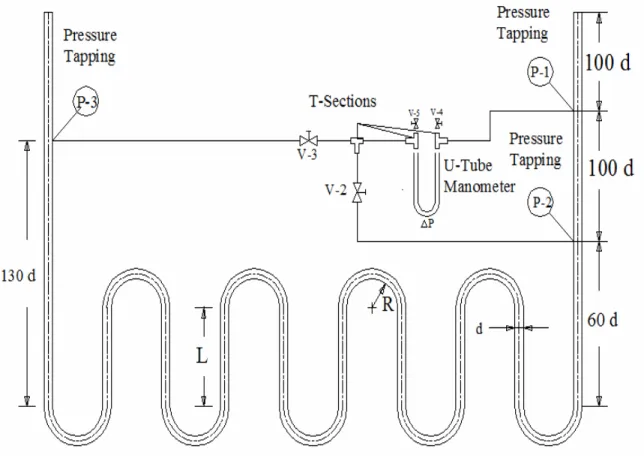
A water tank connected to the suction line of the centrifugal pump is used as a water reservoir. The pressure drop of the straight section is measured across the pressure branches P-1 and P-2 and serves as a reference for the comparison of the pressure gradient between the bend and the straight pipe. The total pressure drop of the straight and wavy section is measured across the pressure taps P-1 and P-3.
Flow control valves as shown in Figure 2.11 were used to control the flow through the pipes while measuring the pressure drop in the test section. The butterfly valves connected to the two sides of the mercury manometer for exhausting air must be closed before starting the pump, otherwise there will be a chance of losing mercury through the slide valve. The water flow rate was controlled by a gate valve V-1 located upstream of the inlet section.
The gate valve was opened slowly and the deflection of mercury in the U-tube manometer was noted. Gate valve V-4 at the top of the U-tube manometer was opened slowly to allow the air trapped inside the manometer and the test section to escape. Gate valve V-4 was closed and similarly the other slide valve V-5 was slowly opened and air was expelled from that side of the mercury manometer.
Then gate valve V-3 was opened and V-2 was closed so that the manometer shows the reading of total pressure drop in the system. The manometer reading was then recorded which showed the total pressure drop of the system. Then valve V-3 was closed and valve V-2 was opened and the manometer reading was recorded which showed the value of the pressure drop in the straight section.
Flow was then reduced using feed valve V-1 and corresponding pressure drops and flow rates were measured. In most cases, the error cannot be completely eliminated, even if the cause of the error is known. One can only talk about what the error can be and the limits of the possible error.
RESULTS & DISCUSSION
Introduction
Parameters considered
Data collection and calculation procedure
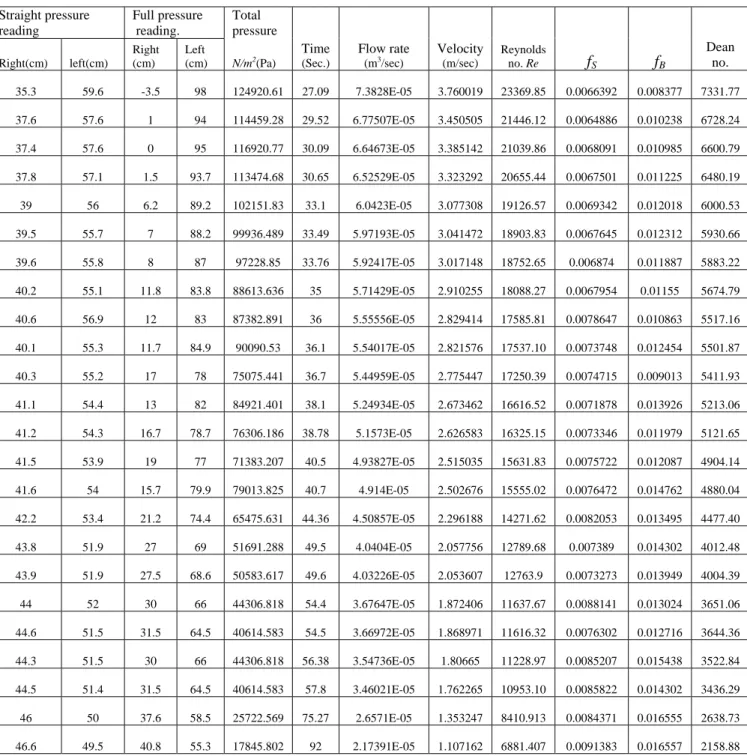
The pressure loss, h12 between tapings P-1 and P-2, is calculated from the manometric deflection, H12, using the following equation. The Fanning friction factor is one-fourth of the Darcy friction factor and is most commonly used by practicing engineers and those who follow the British convention. Where h12 = pressure loss, L12 = length of the straight section between P-1 and P-2, d = pipe diameter and v = average speed, which is calculated from the flow rate as follows.
The pressure head loss between bars P-1 and P-3 is calculated from the manometric deviation, H13 using the following equation. The pressure drop in the bends can be calculated by subtracting the pressure drop in the straight section from the pressure drop in the total test section as given by equation 3.4. Here, ∆PS = Pressure drop across the straight section and dividers between bends, which can be calculated as,.
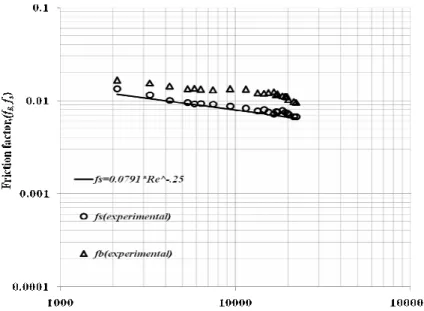
Data of straight friction factor and bend friction factor are presented as a function of Reynolds number and Dean number.
Verification of Experimental Data
- Effects of Spacer Length
- Effects of number of bends
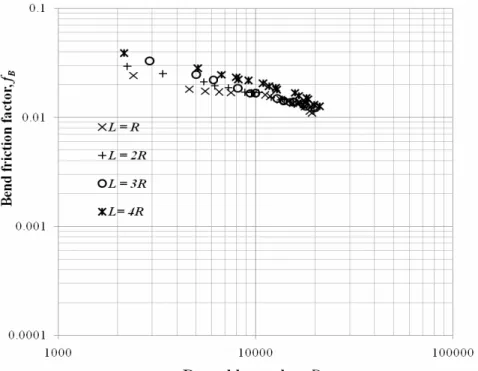
The four plots in figures 3.3 to 3.6 are combined in figure-3.7 to visualize the effect of spacer length. But the effect of spacer length appears to decrease with the increase of Reynolds number, specifically in turbulent regime. The effect of spacer length in the turbulent regime can be visualized in another way by plotting the bending friction factor, fB against Dean number, Dn as shown in figure 3.8.
It is evident that the influence of spacer length exists, albeit to a lesser extent, even in the turbulent regime. However, at higher Reynolds number, in other words at higher Dean number, the increase in the bending friction factor with increasing spacer length decreases. The Reynolds number, Re curves for different spacer lengths overlap each other, indicating the possibility of the existence of a dimensionless critical spacer length ratio, Lcr.
The dimensionless spacer length ratio where the bending friction factor becomes independent of the number of bends is defined as critical spacer length ratio Lcr. In this section the value of critical spacer length is derived by graphical technique as shown in figure-3.9. These figures show that for all Reynolds numbers and spacer lengths, the value of the bending friction factor stops increasing after a certain dimensionless spacer length ratio, L/d, is reached.
To find the value of the dimensionless distance length ratio after which the bending friction factor does not increase with the increase in the distance length, the curves in figures are combined in Figure 3.14. Thus, according to the definition, the critical distance length ratio, Lcr, can be said to be 15.2 in the above cases. Following the technique of Figure 3.9, the bending friction factor is determined from Figure 3.20 for different spacing length ratios and Reynolds numbers, and the values are shown in Table 3.3.
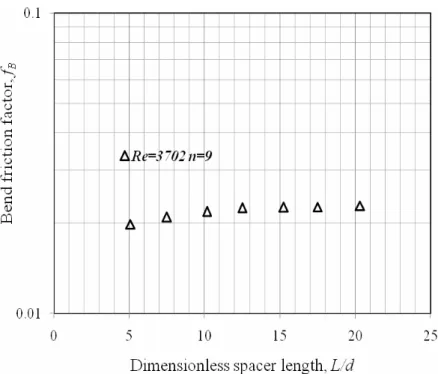
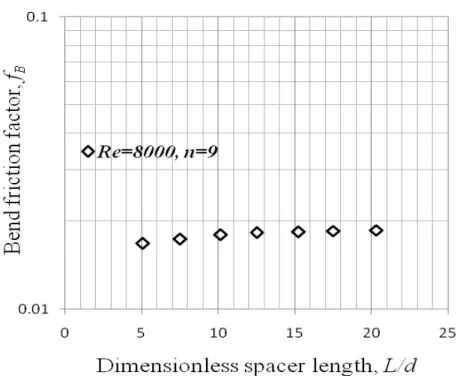
The values of bending friction factor, fB are plotted against dimensionless spacer length (L/d) in Figures 3.21 to 3.24, keeping other parameters such as d = 5 mm, R = 25.4 mm constant. As before, these figures also show that the value of bending friction factor stops increasing and becomes stable at a dimensionless spacer length ratio, L/d. It is seen that for all Reynolds numbers the bending friction factor first increases with dimensionless spacer length ratio and after reaching a value of L/d approximately equal to 15.2 it stops increasing and becomes stable.
This value of L/d defined as the critical spacer length ratio, Lcr is the same as that found with n = 9. This value is higher than the critical spacer length ratio value of 11.75 determined by Hanif et al. al.
CONCLUSION
Major Outcomes
Scope for Future Work
Y., 2004, "Measurements and correlations of frictional single-phase and two-phase pressure drops of R-410A flow in small U-type return bends", Int. C., 2008, “Two-Phase Frictional Pressure Drop Measurements in U-Type Corrugated Tubes Subjected to Horizontal and Vertical Arrangements”, J. C., 2002, “Influence of Horizontal Return Bending on Two-Phase Flow Pattern in a 6.9mm Diameter Tube”, Can.
M., 2011, “Effect of Curvature Ratio and Spacing Length Ratio on U-Type Wave Tube by CFD Analysis”, International Conference on Mechanical, Automotive and Aerospace Engineering (ICMAAE), Kualalampur, Malaysia. Shimizu, Y., Sugino, K., Kuzuhara, S., and Murakami, M., 1982, "Hydraulic losses and flow patterns in bent pipes – comparison of the results in corrugated pipes and quasi-coiled pipes", Bul.
APPENDIX-B
In most situations, the overall uncertainty in a given result is dominated by only a few of its terms. Terms in the uncertainty equation that are smaller than the largest term by a factor of 3 or more can usually be ignored (Moffat, 1988). Although this can always be calculated using equation B-3, it is also possible to do the calculation of relative uncertainty directly.
In particular, when the equation describing the result is in pure product form, such as equation B-4, the relative uncertainty can be found directly.