ENHANCEMENT OF GROWTH AND YIELD OF WHEAT THROUGH BIOCHAR AND POTASSIUM MANAGEMENT
UNDER DIFFERENT IRRIGATION REGIMES
MOUMITA SARKAR
DEPARTMENT OF AGRONOMY
SHER-E-BANGLA AGRICULTURAL UNIVERSITY DHAKA-1207
June, 2021
ENHANCEMENT OF GROWTH AND YIELD OF WHEAT THROUGH BIOCHAR AND POTASSIUM MANAGEMENT
UNDER DIFFERENT IRRIGATION REGIMES
BY
MOUMITA SARKAR REGISTRATION NO- 13-5608
A Thesis
Submitted to the Faculty of Agriculture, Sher-e-Bangla Agricultural University, Dhaka,
in partial fulfilment of the requirements for the degree of
MASTER OF SCIENCE IN
AGRONOMY
SEMESTER: JANUARY- JUNE, 2021 Approved by:
(Dr. Md. Abdullahil Baque)
Professor Supervisor
(Dr. Md. Jafar Ullah) Professor Co-supervisor
(Prof. Dr. Tuhin Suvro Roy) Chairman
Examination Committee
DEPARTMENT OF AGRONOMY
Sher-e-Bangla Agricultural UniversitySher-e-Bangla Nagar Dhaka-1207
CERTIFICATE
This is to certify that thesis entitled, “ENHANCEMENT OF GROWTH AND YIELD OF WHEAT THROUGH BIOCHAR AND POTASSIUM MANAGEMENT UNDER DIFFERENT IRRIGATION REGIMES” submitted to the Faculty of Agriculture, Sher- e-Bangla Agricultural University, Dhaka, in partial fulfillment of the requirements for the degree of MASTER OF SCIENCE in AGRONOMY, embodies the result of a piece of bona- fide research work carried out by MOUMITA SARKAR, Registration no. 13-5608 under my supervision and guidance. No part of the thesis has been submitted for any other degree or diploma.
I further certify that such help or source of information, as has been availed of during the course of this investigation has duly been acknowledged.
Dated:
Place: Dhaka, Bangladesh
(Dr. Md. Abdullahil Baque) Professor
Supervisor
Department of Agronomy
Sher-e-Bangla Agricultural University, Dhaka-1207
DEDICATED TO MY
BELOVED PARENTS
i
ACKNOWLEDGEMENTS
All gratefulness to Omnipotent “Almighty God” Who enabled the author to pursue higher study and to complete the research work as well as to submit the thesis for the degree of Master of Science (M.S.) in Agronomy, Sher-e-Bangla Agricultural University, Dhaka, Bangladesh.
The author would like to express her heartiest respect, deepest sense of gratitude, profound appreciation to her supervisor, Professor Dr. Md. Abdullahil Baque, Department of Agronomy, Sher-e-Bangla Agricultural University, Dhaka, for his sincere guidance, constructive criticism and constant inspiration throughout the course and in preparation of the manuscript of the thesis.
The author would like to express her heartiest respect and profound appreciation to her co-supervisor, Professor Dr. Md. Jafar Ullah, Department of Agronomy, Sher-e-Bangla Agricultural University, Dhaka, for his full co-operation and constructive suggestions to conduct the research work as well as preparation of the thesis.
The author expresses her sincere respect to the Chairman, Professor Dr. Tuhin Suvro Roy, Examination Committee, Department of Agronomy and all the teachers of the department of Sher-e-Bangla Agricultural University, Dhaka, for providing the facilities to conduct the research work and for their valuable advice and sympathetic consideration in terms with the study.
The author avails this opportunity to express her sincere thanks and gratitude to the Government of Bangladesh through its Ministry of Science and Technology (NST) for providing financial support to conduct thesis research work.
The author would like to thank all of her roommates and friends specially Ishrat Anjum, Bristy Basak, Sangita Sharmin who have helped her with technical support to prepare this thesis paper. Special thanks to them for their support and encouragement to complete this study.
Mere diction is not enough to express her unfathomable gratitude and heartfelt indebtedness from core of heart to her father Dulal Chandra Sarkar, her mother Chabi Rani Sarkar and her brother Deb Kumar Sarkar for their ever ending prayer, dedicated effort, sacrifice and moral support that opened the gate and paved to way of her higher study.
Finally, the author appreciates the assistance rendered by the staff of the Department of Agronomy and farm, Sher-e-Bangla Agricultural University, Dhaka-1207, who have helped her during the period of study.
The Author
ii
ENHANCEMENT OF GROWTH AND YIELD OF WHEAT THROUGH BIOCHAR AND POTASSIUM MANAGEMENT UNDER
DIFFERENT IRRIGATION REGIMES
ABSTRACT
A field experiment was conducted at the Agronomy research field of Sher-e-Bangla Agricultural University in Dhaka from November 2019 to March 2020 to study the influence of biochar and Potassium on the enhancement of growth and yield of wheat (BARI Gom 31) under different irrigation regimes. In the experiment, the treatments consisted of four doses of biochar and Potassium viz. B0K0= 5 t ha-1 Biochar + 0 kg ha-1 K, B1K1= 5 t ha-1 Biochar + 48 kg ha-1 K, B2K2= 5 t ha-1 Biochar + 36 kg ha-1 K, B3K3= 0 t ha-1 Biochar + 48 kg ha-1 K and four different irrigation levels viz. I0 = Control, I1= Irrigation at crown root initiation stage, I2= Irrigation at crown root initiation stage + Flowering stage, I3= Irrigation at crown root initiation stage + Flowering stage + Grain filling stage. The experiment was laid out in 2 Factor Split Plot Design with three replications by assigning irrigation to main plot and biochar and Potassium to sub-plots. There were 16 treatments combination. The collected data were statistically examined to determine the effectiveness of the treatments. Results revealed that there were significant variations among the treatments in the most of the examined parameters. As for growth parameters, the highest plant height (87.42 cm), no. of tillers/plant (6.60), leaf area index (42.21) and for yield parameters, the highest ear length (17.01 cm), no. of spikelets/ear (18.13), no. of grains/ear (37.70), 1000-grain wt. (46.66 gm), grain yield (3.53 tha-
1), straw yield (3.56 tha-1) and harvest index (49.80) were recorded under I2B2K2
due to irrigation at crown root stage and flowering stage interaction with Biochar: 5 tha-1 and K: 36 kgha-1. On the contrary, lowest values for above mentioned cases were obtained with I0B0K0. The results revealed that irrigation at crown root initiation and at flowering stage with 5 tha-1 biochar and 36 kg ha-1 Potassium enhance both growth and yield of wheat.
iii
LIST OF CONTENTS
CHAPTER TITLE PAGE
ACKNOWLEDGEMENTS i
ABSTRACT ii
LIST OF CONTENTS iii- v
LIST OF TABLES Vi
LIST OF FIGURES Vii
LIST OF APPENDICES Viii
LIST OF ACRONYMS Ix
1 INTRODUCTION 1-4
2 REVIEW OF LITERATURE 5-14
3 MATERIAL AND METHOD 15-22
3.1 Experimental Site Description 15
3.1.1 Location 15
3.1.2 Soil 15
3.1.3 Climate 15
3.2 Planting Materials 16
3.3 Treatments 16
3.4 Description of Field Operation 17
3.4.1 Land Preparation 17
3.4.2 Experimental Design 17
3.4.3 Fertilizer Application 17
3.4.4 Preparation and Application of Biochar 18
3.4.5 Collection and Sowing Seeds 18
3.4.6 Fencing of Experimental Field 18
3.5 Cultural and Management Practices 19
3.5.1 Irrigation and Drainage 19
3.5.2 Weeding, Mulching and Thining 19
3.5.3 Sampling 19
3.5.4 Insect and Pest Control 19
3.5.5 Harvesting and Post-harvest Operation 20
3.6 Data Collection 20
3.6.1 Growth Parameters 20
3.6.1.1 Plant height 20
3.6.1.2 Number of tillers/plant 21
3.6.1.3 Leaf Area Index 21
3.6.2 Yield Parameters 21
3.6.2.1 Ear length (cm) 21
iv
LIST OF CONTENTS (cont’d)
CHAPTER TITLLE PAGE
3.6.2.2 Number of spikelets/ear 21
3.6.2.3 Number of grains/ear 21
3.6.2.4 1000-grain weight (gm) 21
3.6.2.5 Grain Yield (tha-1) 22
3.6.2.6 Straw Yield (tha-1) 22
3.6.2.7 Harvest Index (%) 22
3.7 Analysis of Data 22
4 RESULTS AND DISCUSSION 23-46
4.1 Crop Growth Parameters 23
4.1.1 Plant Height 23
4.1.1.1 Effect of Irrigation 23
4.1.1.2 Effect of biochar and Potassium (K) management 24 4.1.1.3 Interaction effect of irrigation and biochar and
Potassium management
24
4.1.2 Number of tillers/plant 27
4.1.2.1 Effect of Irrigation 27
4.1.2.2 Effect of biochar and Potassium (K) management 27 4.1.2.3 Interaction effect of irrigation and biochar and
Potassium management
28
4.1.3 Leaf Area Index 30
4.1.3.1 Effect of Irrigation 30
4.1.3.2 Effect of biochar and Potassium (K) management 31 4.1.3.3 Interaction effect of irrigation and biochar and
Potassium management
31
4.2 Crop Yield Parameters 34
4.2.1 Ear length (cm) 34
4.2.1.1 Effect of Irrigation 34
4.2.1.2 Effect of biochar and Potassium (K) management 34 4.2.1.3 Interaction effect of irrigation and biochar and
Potassium management
35
4.2.2 Number of spikelets/ear 37
4.2.2.1 Effect of Irrigation 37
4.2.2.2 Effect of biochar and Potassium (K) management 37 4.2.2.3 Interaction effect of irrigation and biochar and
Potassium management
38
v
LIST OF CONTENTS (cont’d)
CHAPTER TITLE PAGE
4.2.3 Number of grains/ear 39
4.2.3.1 Effect of Irrigation 39
4.2.3.2 Effect of biochar and Potassium (K) management 39 4.2.3.3 Interaction effect of irrigation and biochar and
Potassium management
40
4.2.4 1000-grain wt. (g) 41
4.2.4.1 Effect of Irrigation 41
4.2.4.2 Effect of biochar and Potassium (K) management 41 4.2.4.3 Interaction effect of irrigation and biochar and
Potassium management
42
4.2.5 Grain Yield (t ha-1) 44
4.2.5.1 Effect of Irrigation 44
4.2.5.2 Effect of biochar and Potassium (K) management 44 4.2.5.3 Interaction effect of irrigation and biochar and
Potassium management
44
4.2.6 Straw Yield (tha-1) 44
4.2.6.1 Effect of Irrigation 44
4.2.6.2 Effect of biochar and Potassium (K) management 45 4.2.6.3 Interaction effect of irrigation and biochar and
Potassium management
45
4.2.7 Harvest Index (%) 45
4.2.7.1 Effect of Irrigation 45
4.2.7.2 Effect of biochar and Potassium (K) management 46 4.2.7.3 Interaction effect of irrigation and biochar and
Potassium management
46
5 SUMMARY AND CONCLUSION 47-50
6 REFERENCES 51-59
APPENDICS 61-68
PLATES 69-71
vi
LIST OF TABLES Table
no.
Caption Page
1 Interaction effects of Irrigation and Biochar and Potassium(K) on Plant height at different growth stage of wheat
26 2 Interaction effects of Irrigation and Biochar and Potassium (K) on
no. of tillers/plant at different growth stages of wheat
30
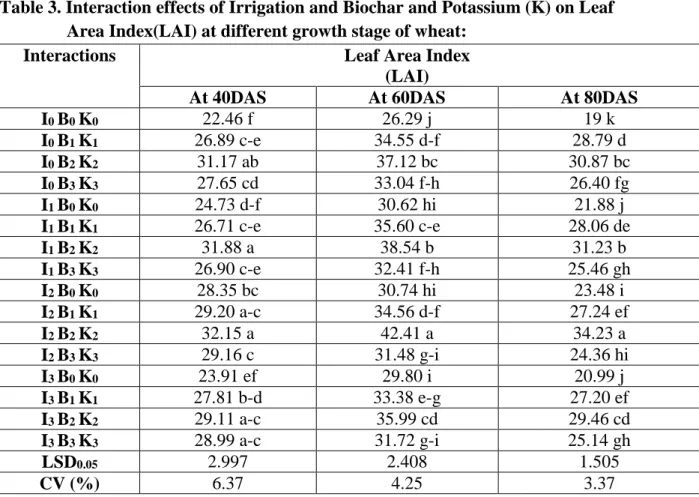
3 Interaction effects of Irrigation and Biochar and Potassium (K) on Leaf Area Index(LAI) at different growth stage of wheat
33
4 Interaction effects of Irrigation and Biochar and K on ear length (cm), No. of Spikelets/Ear & No. of Grains/Ear of wheat
36
5 1000-grain wt., Grain yield, Straw yield and Harvest Index of wheat at different levels of Irrigation
41
6 1000-grain wt., Grain yield, Straw yield and Harvest Index of wheat at different application of Biochar and Potassium(K)
42
7 Interaction effects of Irrigation and Biochar and K on 1000 grain wt., Grain yield, Straw yield and Harvest Index of wheat
44
vii
LIST OF FIGURES
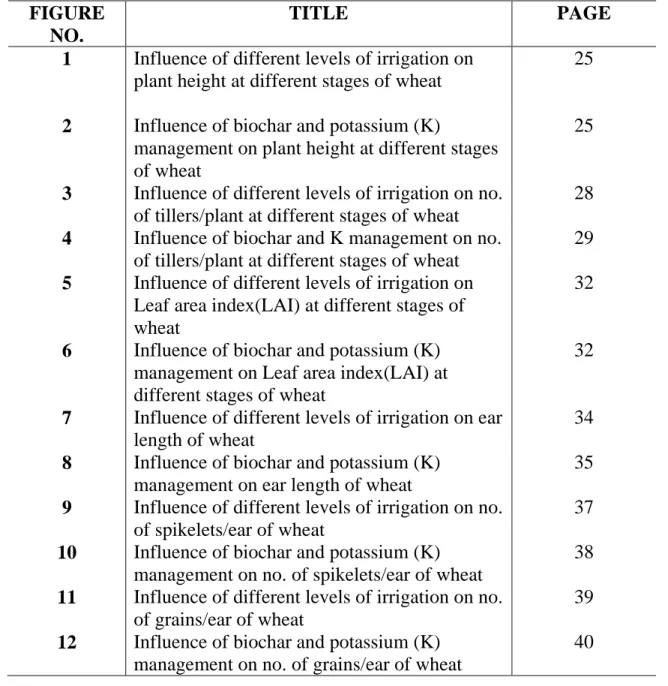
FIGURE NO.
TITLE PAGE
1 Influence of different levels of irrigation on plant height at different stages of wheat
25
2 Influence of biochar and potassium (K)
management on plant height at different stages of wheat
25
3 Influence of different levels of irrigation on no.
of tillers/plant at different stages of wheat
28 4 Influence of biochar and K management on no.
of tillers/plant at different stages of wheat
29 5 Influence of different levels of irrigation on
Leaf area index(LAI) at different stages of wheat
32
6 Influence of biochar and potassium (K) management on Leaf area index(LAI) at different stages of wheat
32
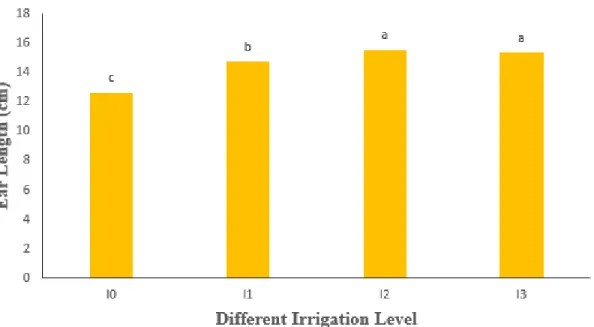
7 Influence of different levels of irrigation on ear length of wheat
34 8 Influence of biochar and potassium (K)
management on ear length of wheat
35 9 Influence of different levels of irrigation on no.
of spikelets/ear of wheat
37 10 Influence of biochar and potassium (K)
management on no. of spikelets/ear of wheat
38 11 Influence of different levels of irrigation on no.
of grains/ear of wheat
39 12 Influence of biochar and potassium (K)
management on no. of grains/ear of wheat
40
viii
LIST OF APPENDICES
APPENDIX TITLE PAGE
1 AEZ Map of Bangladesh showing the experimental sites
60
2 Layout of the experimental plot 61
3 Soil characteristics of experimental farm of Sher-e-Bangla Agricultural University
62 4 Split-Plot AOV Table for Plant Height (20
DAS)
62 5 Split-Plot AOV Table for Plant Height (40
DAS)
63 6 Split-Plot AOV Table for Plant Height (60
DAS)
63 7 Split-Plot AOV Table for Plant Height (80
DAS)
63 8 Split-Plot AOV Table for Plant Height (At
Harvest)
64 9 Split-Plot AOV Table for No. Of Tillers/plant
(40 DAS)
64 10 Split-Plot AOV Table for No. Of Tillers/plant
(60 DAS)
64 11 Split-Plot AOV Table for No. Of Tillers/plant
(80 DAS)
65 12 Split-Plot AOV Table for No. Of Tillers/plant
(At Harvest)
65 13 Split-Plot AOV Table for Leaf Area Index
(40 DAS)
65 14 Split-Plot AOV Table for Leaf Area Index
(60 DAS)
66 15 Split-Plot AOV Table for Leaf Area Index
(80 DAS)
66 16 Split-Plot AOV Table for Ear Length(cm) 66 17 Split-Plot AOV Table for No. of spikelets/ear 67 18 Split-Plot AOV Table for No. of grains/ear 67 19 Split-Plot AOV Table for 1000-grain wt. (gm) 67 20 Split-Plot AOV Table for Grain Yield (t ha-1) 68 21 Split-Plot AOV Table for Straw Yield (t ha-1) 68 22 Split-Plot AOV Table for Harvest Index (%) 68
ix
LIST OF ACRONYMS
ABBREVIATIONS ELABORATIONS
AEZ Agro-Ecological Zone
Anon. Anonymous
ANOVA Analysis of Variance
@ At the rate of
Agron. Agronomy
Agril. Agricultural
BARI Bangladesh Agricultural Research Institute
BBS Bangladesh Bureau of Statistics
Cm Centimeter
CV % Percent Coefficient of Variation
DAS Days after sowing
et al. And others
i. e. For example
FAO Food and Agriculture Organization
Gm Gram
HI Harvest Index
K Potassium
Kgha-1 Kilogram per hectare
LSD Least Significant Difference
MoP Muriate of Potash
m2 Meter squares
N Nitrogen
NS Non-significant
No. Number
t ha-1 Ton per hectare
SAU Sher-e-Bangla Agricultural University
TSP Triple Super Phosphate
viz. As follows
Wt. Weight
WG Wettable granule
1
CHAPTER 1 INTRODUCTION
Wheat (Triticum aestivum L.) belongs to the family Poaceae (Gramineae). Wheat (Triticum aestivum L.) is one of the world's most important cereals. It is grown mostly in a widely different variety of conditions. Wheat is the second most important grain crop after rice and occupies third position in production in Bangladesh. In Bangladesh, 1029354 M. tons of wheat were produced from 3,32,274 hectares of land in 2019–20, with an average yield of 3.098 metric tons per hectare (BBS, 2020). Wheat consumption is increasing on a daily basis. Wheat grain is rich in food value. It contains 69.60% carbohydrate, 12% protein, 1.72% fat and 27.20% minerals (BARI,1997). Wheat is superior to rice in terms of nutrition due to its higher protein content. In that situation, wheat could be an excellent supplement to rice, as rice is essential for feeding such a large population. Wheat and its straw, in addition to these, are utilized as animal feed. Wheat straw is also used as a fuel source and a building material by Bangladesh's underprivileged.
Bangladesh's agriculture has numerous obstacles in growing crops from its limited land resources in order to meet the ever-increasing demand of the country's population. Climate change, biological variety loss, deterioration of land quality, loss of soil fertility, water scarcity, and other major issues make agriculture susceptible. Furthermore, agricultural land is shrinking every year as a result of human settlement, growing urbanization, and industrialization. For this reason, crop productivity must be increased by land intensification and the use of high-yielding crop varieties, as well as improved crop management.
Wheat is cultivated in Bangladesh during the Rabi (winter) season, which is dry.
Because of this, the lack of soil moisture during this season limits the usage of fertilizers, resulting in lower grain yields. Irrigation is crucial for proper wheat
2
growth and development. Inadequate soil moisture impacts both seed germination and nutrient uptake from the soil. Unfortunately, most farmers in Bangladesh are unable to supply irrigation during several important stages of wheat production due to a lack of irrigation systems and irrigation supplies. At the early stages of the wheat, residual soil moisture from the rainy season is abundant, but it is rarely retained in the later stages. As a result, water is the most essential constraint to wheat production. The groundwater table is steadily declining at a pace of around 1 meter per year, with the primary causes being the expanding wheat area irrigated with groundwater and low crop water-use efficiency (Xia et al., 2002). Consequently, increasing irrigation water availability and decreasing irrigation demand while preserving agricultural output is critical.
Biochar is a carbon-rich material made from the thermo-chemical conversion of biomass in an oxygen-limited environment (slow, intermediate, and quick pyrolysis or gasification). Its porous nature allows it to hold large amounts of extractable humic and fluvic chemicals (Lin et al. 2012).
Biochar, when used as a soil conditioner, improves plant growth by delivering and, more crucially, storing nutrients, as well as enhancing soil physical and biological qualities and, as a result, boosting soil water holding capacity (Lehmann et al., 2006;
Leach et al., 2010); The use of biochar in the soil has been shown to boost agricultural output without the use of inorganic fertilizers, or with much decreased use of inorganic fertilizer. Environmental benefits of biochar include decreased groundwater pollution, lower cost of water filtration, reduced amounts of waste and higher profitability for farmers. This technology also contributes to food security by increasing crop yields and retaining water in areas prone to drought. The production of wheat varied by many factors like irrigation levels, fertilizers, high yielding varieties and adoption of improved cultural practices like adding biochar.
Regardless of nitrogen or water conditions, the addition of biochar increased wheat production under varied mineral fertilization levels. (Alburquerque et al., 2013).
3
The addition of biochar also significantly increases the content of available water in the soil by increasing the amount of water retained in the soil (field capacity) and allowing plants to draw the soil water content and lower it before wilting (Koide et al., 2015). This is mostly due to the increased capillary water capacity of the soil as a result of biochar application.
Potassium (K) is necessary to many plant functions, including carbohydrate metabolism, enzyme activation, osmotic regulation and efficient use of water, N uptake and protein synthesis and translocation of assimilates. Potassium (K) is an essential nutrient that regulates water balance and improves water intake. Aside from its role in giving pest and disease resistance, it is involved in practically all processes required to support plant life. Potassium has significant effect on dry matter accumulation and productivity of wheat under water stress condition (Baque et al., 2006). Wheat requires potassium for physiological growth and yield development. Sufficient potassium results in stronger wheat straw and assists in grain filling. Potassium has been shown to improve water relations as well as crop yield under water-stressed conditions (Johnson, 1983; Islam et al., 2004).
Many studies have been conducted to evaluate the effect of nutrient management on enhancement of wheat physiology and yield under water stress but the information on the effect of combined management of biochar and potassium is scarce. This study was undertaken to find out the change of growth and yield of wheat through biochar and potassium management under water stress condition.
In light of the aforementioned circumstances of wheat growing in Bangladesh, the current research was carried out with the cultivar of BARI Gom 31 with the following goals in mind:
4
To find out the suitable dose of K fertilizer and level of biochar for maximizing yield along with optimum growth of wheat under different irrigation regime, and
To find out interaction effect of irrigation with biochar and K fertilizer for maximum growth and yield of wheat
5
CHAPTER 2
REVIEW OF LITERATURE
Biochar has a number of advantages for soil health. Biochar is currently the topic of intense research around the world because it has the potential to be a viable choice for sustainable agriculture due to its ability to operate as a long-term carbon sink in soil and provide agricultural advantages. On the other hand, Potassium (K) is one of the most important plant nutrients, as it is essential for plant growth and physiology. Potassium plays a regulatory role in various metabolic processes such as protein synthesis, glucose metabolism, and enzyme activation, in addition to being a part of plant structure. Potassium (K) significantly reduces the negative effects of drought stress on plants.
However, studies on the impact of biochar and potassium on the response of wheat plant are very limited. Some of the relative and informative works and research findings on cereals and other crops are presented here.
Role of biochar on plant under water stress condition:
For soil health, biochar has a number of benefits. Because of its versatile physicochemical characteristics, biochar is getting attention as a low-cost, sustainable, and emerging material which can be widely used in the fields of energy, agriculture, and environment during the last two decades. Biochar can improve water holding capacity of soil, reduce soil emissions of greenhouse gases, reduce nutrient leaching, reduce soil acidity, and reduce irrigation and fertilizer requirements (Laird, 2010, Novak et al., 2009). Modest additions of biochar to soil reduce nitrous oxide N2O emissions by up to 80% and eliminate methane emissions (Lehmann, 2007a). Biochar could possibly be part of a long-term adaptation strategy, as it could improve soil physical properties including the increase of
6
porosity and water storage capacity, as well as the decrease of bulk density (Lu et al., 2014; Nelissen et al., 2015).
Wheat productivity and soil fertility increases on sustainable basis under wheat- maize-wheat cropping pattern using biochar. The interaction of biochar with synthetic fertilizer and farmyard waste was studied over the course of two years in the field. In comparison to non-biochar, biochar application increased spikes per m2, grains per spike, 1000 grain weight, grain yield, biological yield, phosphorus use efficiency, and grain phosphorus uptake. Similarly, biochar application increased soil carbon (C), phosphorus (P), and potassium (K). Biochar, used alone or in combination with FYM or mineral nitrogen, boosted wheat yield and yield components, as well as soil quality, under a wheat-maize cropping pattern (Ali et al., 2015). Moreover, biochar decreases soil pH and increases organic matter in soil.
Several yield parameters were similar between Bangladesh Agricultural Research Council (BARC) recommended fertilizer and half of BARC recommended fertilizer plus rice straw added treatment. Research revealed that combining rice straw biochar with half of the Bangladesh Agricultural Research Council (BARC) recommended fertilizer had a better effect than single application rice straw biochar and resulted in the highest wheat production in the same treatment. Rice straw biochar has the potential to reduce wheat production's reliance on chemical fertilizers. As a result, using biochar to increase wheat yield in Bangladesh is a realistic choice (Iqbal, 2017).
On the other hand, biochar showed beneficial effect on wheat production in saline sodic soil. The addition of biochars had significant effects on the saturated hydraulic conductivity, infiltration rate, available water capacity, and enhanced the grain yield of wheat. Based on the findings of the study, it was concluded that extremely large
7
volumes of biochar would be required to significantly alter soil physical attributes and boost wheat yield in salt-affected soils (Mahmoud et al., 2017).
Biochar and nitrogen fertilizer showed positive effect on soil physicochemical properties, nitrogen use efficiency and yield of upland rice (Oryza sativa). Result showed that combination of biochar and N fertilizer exerted significant interactive effect on rice harvest index, grain and straw yield and N-use efficiency. Interaction between biochar and N fertilizer increased agronomic efficiency by 140% and grain nutrient recovery by 191% over 2 years. Combination of biochar and N fertilizer reduced soil bulk density, increased water holding capacity and soil chemical status such as pH, N, P, K, Ca, CEC and base saturation, all within the top 10 cm depth of the soil. Overall, the results established that rice husk biochar can be used as a soil conditioner to enhance upland rice yield on an Alfisol (Oladele et al., 2019). Biochar has also impact on rice growth and yield in tropical riparian wetland. Results showed that, applying biochar increased rice yield, but restrained shoot elongation rate and plant height. During the vegetative growth phase, applying biochar significantly increased the number of tillers, leaves, shoot dry weight, and root dry weight. Biochar significantly affected the yield components: number of tillers, percentage of productive tiller, number of grains per panicle, panicle density, percentage of filled grain, and weight of 1,000 grains (Lakitan et al., 2018).
Biochar helps to alleviate the negative effects of drought and salinity stress on soybean productivity and water use efficiency. Drought stress reduced soybean phenology (e.g. flowering time) and all leaf gas exchange metrics significantly, but had mixed impacts on soybean root growth and WUE at the leaf and yield levels.
Photosynthetic rate, stomatal conductance, intercellular CO2 concentration, and transpiration rate were all reduced by salinity stress. Drought and salinity stress slowed photosynthesis, which resulted in lower biomass production and grain yield.
In these situation, soybean grain yield was increased with the addition of biochar.
Drought stress raised WUE-yield by 27.5 percent and 15.6 percent, respectively,
8
while salinity stress decreased. Soybean productivity and leaf gaseous exchange were negatively affected by drought and salinity stress. However, adding biochar to the mix reduces the deleterious impacts of drought and salinity on soybean productivity and water efficiency. This study's findings indicated that drought stress could drastically reduce soybean growth and production. Drought stress has interaction impacts on soybean yield and water usage efficiency, and biochar can be used to mitigate the unfavorable consequences (Zhang et al., 2020).
Under semiarid climatic conditions the adverse effects of drought at critical wheat growth stages i.e., tillering, flowering and grain filling stage mitigated by using biochar. Results revealed that drought stress significantly affected wheat growth and yield properties at all crucial growth phases, with grain filling being the most vulnerable stage, resulting in substantial yield reduction. Biochar application significantly reduced the negative effects of drought by increasing the number of fertile tillers, spike length, number of grains per spike, thousand grain weight, biological and economic yield. Furthermore, drought-stressed wheat's water use efficiency and physiological characteristics were dramatically improved by biochar.
In the end, biochar treatment can be an effective strategy for increasing wheat grain yield by reducing the negative effects of drought stress (Haider et al., 2020).
Role of potassium on plant under water stress condition:
Potassium (K) plays a crucial role in a number of physiological processes that are vital to growth, yield, quality, and stress resistance in all crops (Zo¨rb et al., 2014).
K is required for a number of physiological activities, including stomatal control and photosynthesis. K has just been discovered to provide abiotic stress tolerance.
When exposed to salt, K aids in ion homeostasis and osmotic balance management.
K controls stomatal opening in drought-stressed plants, allowing them to adjust to
9
droughts (Hasanuzzaman et al., 2018). During drought stress, root growth and the rates of K+ diffusion in the soil towards the roots were both restricted, thus limiting K acquisition. The resulting lower K concentrations can further depress the plant resistance to drought stress, as well as K absorption. Maintaining adequate plant K is, therefore, critical for plant drought resistance (Wang et al. 2013)
Maize (Zea mays L., cv. Azam) showed increased growth and productivity due to foliar and soil applied K. Applying foliar K and foliar Zn was helpful in terms of better growth, greater yield, and yield components of maize under moisture stress conditions. Spraying in vegetative stage resulted in better growth and higher yield than spraying in reproductive stage. Soil K treated plots performed better than control (K not applied) in terms of improved growth, higher yield and yield components of maize crop. The findings also show that increasing the rate of soil applied K up to 90 kg ha-1 in two equal splits (50 percent at sowing and knee height) improves growth and maize productivity in semiarid conditions (Amanullah et al., 2016). Potassium levels and its application periods had a significant influence on wheat production and yield components. In the case of K timings application, the higher grain yield was achieved when K was applied one time at sowing time. It is concluded that K should be applied in full at sowing for achieving higher wheat production (Ali et al., 2019).
Potassium-Nitrate containing chitosan alleviates drought stress on spinach. Results showed that drought stress decreased physiological parameters and increased oxidative stress indicators in spinach. Applying Potassium nitrate significantly increased root and shoot length, shoot fresh weight and shoot dry weight, chlorophyll a, carotenoids, total soluble proteins, soluble sugars, potassium, and phosphorous concentrations over no potassium nitrate at severe drought. While stress indicators, like glycine betaine, malondialdehyde, hydrogen peroxide,
10
electrolyte leakage, peroxidase, superoxide dismutase, and ascorbic acid levels, were increased in stress. Potassium nitrate treatment was proved efficient and effective in improving spinach physiological status in both mild drought stress and severe drought stress (Bukhkari et al., 2021). In addition, potassium fertilizer showed positive effect on growth, yield and nutrient uptake of wheat variety (Shatabdi) under water stress. Water stress significantly affected dry matter accumulation in leaf, stem, spikes and roots. Also nutrient uptake such as N, P and K was negatively affected in water stress. As a result, the majority of the yield contributing characters were drastically reduced. Higher K levels increased dry matter production in several plant parts. Wheat yield and yield contributing characteristics were also improved as a result of the high quantity of potassium application, regardless of soil moisture conditions. Nutrient uptake was also increased with increasing levels of K application especially under water stress condition. High potassium application could enhance wheat production by reducing the negative impacts of water stress (Baque et al., 2006).
Potassium fertilizers such as K-Silicate, K-Citrate and K-Nitrate showed effect on biochemical changes of growth and yield parameters of some sensitive barley varieties (Giza 125, Tombari, Ksar Megrine, Tamellat) under water stress conditions. Water stress has a negative effect on yield characters of barley varieties.
Application of K Citrate followed by K Silicate gained the highest values of the yield and yield components under water stress treatment, while the opposite was true in case of the control. Nitrogen, phosphorus and protein content in barley grain of the examined varieties were higher under normal than water stress ones, where barley Giza 125 scored the highest nitrogen values and protein content under water stress conditions. The barley varieties Tombari and Ksar Megrine gained the highest values for most studied stress tolerance indices indicating enhancement in their drought tolerance after application of K-Citrate and the opposite was true in case of K Silicate applied for barley Giza 125 and Tamellat. It can be concluded that
11
application of potassium fertilizers enhances yield of every barley variety under water stress (Hellal et al., 2020).
In another finding, Potassium silicate (K-silicate) increased maize productivity and water use efciency (WUE). The highest yield was obtained by spraying K-silicate three times on the leaves. Even when water was scarce, irrigation every fifteen days combined with three foliar applications of K-silicate resulted in the maximum grain yield and component values. These findings suggest that using K-silicate to boost WUE and create a high grain yield with minimal watering is possible (Gomaa et al., 2021). Tobacco plant that grown under drought stress condition showed optimum shoot growth only after application of potassium, whereas root biomass and length responded under both watering regimes. Analyses of water relation parameters in different aged leaves showed lower susceptibility of the middle-aged leaves to both K deficiency and drought stresses than the upper and lower leaves; this phenomenon was accompanied by a more conservative control of water loss in the middle-aged leaves. In contrast, proline was accumulated in the young leaves, and K application increased it further. Although various organic osmolytes were accumulated under the combinative effect of K deficiency and drought stress, they did not exceed the amounts found in the control (well-watered +K) plants and were merely a result of the concentration effect. The majority of leaf biochemical responses to drought stress are developmentally controlled mechanisms, according to the findings.
Furthermore, the relieving effect of both RA and LA despite greater water loss indicated that better stomatal function following K treatment permitted carbohydrates synthesis, hence boosting plant growth under water stress (Bahrami and Hajiboland, 2017).
Foliar potassium influences wheat productivity under water stress condition. The yield and nutrient uptake performance of two wheat (Triticum aestivum L.) varieties (Pirsabak-2013 and Atta Habib) to foliar feeding of 2% potassium (K) at three
12
various growth phases of wheat (Zadoks Growth Scale-22, Zadoks Growth Scale- 60 and Zadoks Growth Scale-73) was explored under water restricted environment.
According to the findings, drought stress had an unfavorable effect on plant height, spike length, number of spikelets per spike, number of grains per spike, 1000-grain weight, grain production, and nutrient uptake of the wheat plant during all three acute growth stages. The exogenous K application under drought stress at all three acute growth phases boosted tolerance of wheat by decreasing noxious nutrient’s uptake and augmenting the yield and yield characters. In this regard, both types demonstrated unusual behavior. When K was applied during the grain filling stage of both kinds, it resulted in a dramatic improvement in all of the documented yield parameters and nutrient uptake (Shah et al., 2017).
Role of biochar and potassium management on plant under water stress condition:
Potassium (K) is absorbed by the plants from relatively dilute soil solutions.
However, because biochar can boost soil CEC, it can improve the soil's ability to hold K and store it for plant absorption (Gunaratne et al. 2017). Furthermore, biochar may include exchangeable Potassium for plant absorption. K content in plant biomass had increased by 57 percent one year following biochar application, whereas manure application had increased by 43 percent at the same time period (Lentz and Ippolito 2012). A great availability of Potassium in soil, soon after biochar application, has been reported (Cheng et al., 2008). Furthermore, K absorption by maize grain was significantly increased following the application of cow manure biochar (Uzoma et al., 2011). Several researchers suggested that increased K availability in soil could be attributed to enhanced soil pH by biochar (Manolikaki and Diamadopoulos 2016; Smider and Singh 2014). The increase in soil pH may cause less accessible Potassium Ion to be released into the soil solution, as it remains strongly linked to the clay particles. The K given by biochar has been
13
shown to boost rice and cowpea biomass. (Lehmann et al., 2003a). Biochar produced from plant biomass increased Potassium uptake in common bean (Rondon et al., 2007). Additionally, increased K concentrations in legume biomass have been recorded following the addition of grass-derived biochar. In the same study, it had been found that available K in biochar applied treatment soils was even exceeding concentrations in the treatments that received K fertilizer (Oram et al., 2014). The authors had highlighted that decrease in net nitrification resulted reduced N uptake and thereby enhanced K uptake as there could be a competition in legume plants for N and K. Particularly, fresh biochar is considered to have available K that can be rapidly taken by plants (Karer et al., 2013). However, some researchers have suggested that high availability of K for plants with biochar may not persist beyond the year after application (Steiner et al., 2007).
In moderate acidic soil, biochar and potassium alleviate nutrient stress on maize growth. Study showed that biochar addition increased soil moisture, potassium (K) and plant available phosphorous (P), which all showed significant positive relationship with above ground biomass of maize. However, biochar was much more effective at abundant soil watering (+311% biomass) than at water-starved conditions (+67% biomass), indicating that biochar did increase soil moisture, though this was not the main reason for the positive biomass growth effects (Pandit et al., 2018). Another study showed, residual effect of potassium fertilizer and biochar on growth and yield of maize. Through a field experiment on an Inceptisol showing that application of biochar can increase availability of plant nutrients and yield. The findings revealed that residual biochar, alone or in combination with various levels of potassium application, increased maize yield. Also, the availability of N, P, K, Ca, and Na in the soil was increased by residual biochar (Widowati et al., 2017).
14
A combination of Potassium Solubilizing Bacteria (KSB) and biochar showed effect on growth indices and Phosphorous, Potassium and chlorophyll content in sorghum under drought stress. It stated that, drought has become a major danger to crop production in recent years, particularly in arid and semi-arid countries. In this context, appropriate macronutrient availability and uptake, as well as soil moisture conservation, are important considerations. At 30 percent of field capacity moisture level, KSB and biochar boosted plant height, root length, shoot fresh biomass, root fresh biomass, potassium, and phosphorus content shoots increased over control. At a moisture level of 30% of field capacity, chlorophyll a and chlorophyll b content were found higher than control. The combined application of KSB and biochar is found to be extremely beneficial in enhancing sorghum growth under drought conditions (Hye et al., 2020). Biochar and Potassium also showed positive impact in acidified paddy soils by verifing the connection between tobacco potassium (K) accumulation and soil chemical properties along with K bacteria activity for biochar addition. Biochar was added once into the soil to evaluate the release and transformation characteristics of K and tobacco growth sown in paddy soil.
Compared to K accumulation value from the control treatment, applied Biochar improved K accumulation value in each year. It also improved tobacco plant height and roots fresh weight. Besides, it increased soil available potassium for three consecutive years. In conclusion, addition of Biochar is seemed beneficial to improve soil K status, tobacco growth and K contents of tobacco leaf (Zhang et al., 2020).
15
CHAPTER 3
MATERIALS AND METHOD
This experiment was conveyed at the Research Field of Sher-e- Bangla Agricultural University (SAU), Dhaka-1207, during the period of November 27, 2019 to March 21, 2020. This chapter shows a brief description on experimental site, experiment period, climatic condition, experimental design and layout, land preparation, intercultural operations, data collection and their statistical analysis.
3.1 Experimental Site Description 3.1.1 Location
During the Rabi season of 2019, the experiment was carried out at the Sher-e-Bangla Agricultural University farm in Dhaka, under the Agro-ecological zone of Madhupur Tract, AEZ-28. The land area is located at 23°41′N latitude and 90°22′E longitude at an elevation of 8.6 meters above sea level. The experimental site is shown in the AEZ Map of Bangladesh in Appendix 1.
3.1.2 Soil
The texture of the top soil was silty clay, olive-gray in color with fine to medium noticeable dark yellowish brown mottles. The pH of the soil ranged from 5.48 to 5.63, with 0.44 percent organic carbon. The test area was flat, with an irrigation and drainage system in place, and was above flood levels (Appendix 3). The chosen plot was a medium-high piece of land.
3.1.3 Climate
The experimental site was in the subtropical monsoon climatic zone, with winter months from November to April separating it from the rest of the year (Rabi season).
During the trial period, there is plenty of sunshine and a rather cool temperature, ideal for wheat cultivation in Bangladesh.
16
3.2 Planting Materials
BARI Gom 31 was the wheat cultivar used in this investigation. This variety's seeds collected from the Bangladesh Agricultural Research Institute (BARI) in Gazipur.
This variety was first introduced in 2017. The variety is high yielding, matures early and is tolerant to terminal heat stress. The variety is BLB disease tolerant and resistant to leaf rust.
3.3 Treatments
The experiment consists of two factors and they were different level of irrigation and biochar and K management. Four different levels of irrigation and four biochar and K management were used under the present study. The treatments of the experiment were as follows:
Factor A: Level of Irrigation 1. I0 = Control (without irrigation)
2. I1 = Irrigation at crown root initiation stage
3. I2 = Irrigation at crown root initiation stage and flowering stage
4. I3 = Irrigation at crown root initiation stage, flowering stage and grain filling stage
Factor B: Biochar and Potassium(K) management 1. B0K0 = Biochar: 5 t ha-1 and K: 0 kg ha-1
2. B1K1 = Biochar: 5 t ha-1 and K:48 kg ha-1 3. B2K2 = Biochar: 5 t ha-1 and K:36 kg ha-1 4. B3K3 = Biochar: 0 t ha-1 and K: 48 kg ha-1
17
3.4 Description of field operations 3.4.1 Land preparation
On November 27, 2019, the final land was prepared after repeated ploughing with a power tiller and a country plough. Plowing was followed by laddering, which was used to break up clods and level the ground. The experimental plot was cleaned of all weeds, stubbles, and agricultural residues. The experiment was set up according to statistical design.
3.4.2 Experimental design
The experiment was designed as a Split-plot with three replications. To indicate replications, the field was divided into three blocks. Each block was divided into four main plots for irrigation treatments, and each main plot was divided into 4 sub- plots for Biochar and Potassium management treatments. Each unit plot was 2 m x 1 m in size. The space between rows was 75cm. The layout of the experiment has been shown in Appendix 2.
3.4.3 Fertilizer application
The following doses of manure and fertilizers were used:
Cowdung: 10 t ha-1 Biochar: as per treatment Urea: 220 kg ha-1
TSP: 150 kg ha-1 MoP: as per treatment Gypsum: 110 kg ha-1 Zinc oxide: 4 kg ha-1 Boric acid: 5 kg ha-1
Cowdung was applied 10 days before final land preparation. The unit plots were fertilized with Biochar (as per treatment), Urea, TSP, MoP (as per treatment), Gypsum, Zinc Oxide, Boric acid. Urea, Triple Super Phosphate (TSP) and Muriate of Potash (MoP) and gypsum were used as source of nitrogen, phosphorus and
18
potassium, and sulfur respectively. One-third of the urea and the whole amount of Biochar (as per treatment), triple super phosphate (TSP), Gypsum Zinc oxide, Boric acid and muriate of potash (as per treatment) were incorporated in each plot (except control plot in case of Biochar and MoP) at the time of final land preparation. Rest two third of urea was applied in two equal splits at crown root initiation stage (21 DAS) and spike initiation stage (55 DAS).
3.4.4 Preparation and application of biochar
Biochar was bought from Manikgonj. After that, it was powdered and sieved before being used in the field. Then, at the time of final field preparation, biochar was put to the soil of each (except control) plot in accordance with the treatment dosages (5 t ha-1), along with other fertilizers.
3.4.5 Collection and sowing of seeds
As per treatment seeds of wheat variety (BARI Gom 31) were collected from Bangladesh Agricultural Research Institute (BARI), Gazipur. Furrows were prepared with hand rakes under good tilth conditions for sowing. Seeds were treated with Provax 200-EC @ 2.5 g powder per kg seed prior to sowing. Seeds were sown continuously in line having a depth of 2-3 cm from the soil surface on 27 November 2019 @ 125 kg ha-1. The line to line distance was maintained 25 cm. After sowing, the seeds were covered with soil and lightly pressed by hand.
3.4.6 Fencing of experimental field
The entire experimental area was surrounded by a net to keep birds and other animals out.
19
3.5 Cultural and Management Practices:
3.5.1 Irrigation and drainage
In this experiment, irrigations were delivered according to the treatment. For I0
leveled plot no irrigation was provided, for I1 leveled plot one irrigation was provided at 20 DAS (at crown root initiation-CRI stage), for I2 leveled plot two irrigation provided at 20 DAS (at crown root initiation-CRI stage) and 55 DAS (at flower initiation stage) and for I3 leveled plot three irrigation was provided at 20, 55 and 75 DAS (at crown root initiation stage, flowering stage and at grain filling stage). During irrigation, sufficient care was taken to ensure that water can't run from one plot to another or overflow the plot's boundaries. The field's excess water was drained.
3.5.2 Weeding, mulching, thinning
Weeding and mulching were required to keep the plots weed-free and to retain soil moisture. Weeding was done twice during the growing period, the first time after 20 days and the second after 40 days. Mulching was done after sowing and when needed. Thinning was done carefully in each unit plot once to maintain a balanced plant population in each plot. Thinning was carried out at 20 DAS (Days after sowing).
3.5.3 Sampling
From each plot, five plants were chosen at random. Data on growth and yield characteristics were collected from the five sample plants.
3.5.4 Insect and pest control
Throughout the growing season, the crop was attacked by some insects (cereal aphid, grass hopper, and fall armyworm). To control the Aphids, the experimental plot was sprayed 35 days later with Aktara 25 WG. After watering in the afternoon at 60 DAS, Virtako insecticides were applied to the plots.
20
3.5.5 Harvesting and post-harvest operations
The crop was harvested when the leaves and stems turned yellowish in color manually from each plot 21 March, 2020. Each plot's harvested crop was bagged separately, carefully labelled, and carried to the threshing floor. Enough care was taken during threshing and cleaning period of wheat grain. The grains were cleaned and weighted. The weight was adjusted to a moisture content of 14%. The straw was sun dried and the yields of wheat grain and straw from one m2 area per plot were recorded and converted to t ha-1.
3.6 Data Collection 3.6.1 Growth parameters 1. Plant height (cm) 2. No. of tillers/plant 3. Leaf Area Index (LAI) 3.6.2 Yield parameters
1. Ear length (cm) 2. No. of spikelets/ear 3. No. of grains/ear 4. 1000-grain weight (g) 5. Grain yield (t ha-1) 6. Straw yield (t ha-1) 7. Harvest index (%)
3.6.1.1 Plant height(cm)
The heights of five sampled plants were measured with a meter scale from the ground level to the top of the plants and the mean height was recorded in centimeter.
The plant height was measured at 20, 40, 60, 80 DAS and at harvest.
21
3.6.1.2 No. of tillers/plant
At 40, 60, 80 DAS and at harvest the number of total tiller per plant counted from five sampled plant separately and then averaged.
3.6.1.3 Leaf Area Index (LAI)
Leaf area index was estimated measuring the length and width of leaf and multiplying by a factor 0.75 as suggested by Yoshida (1981). Data were counted from five sampled plant separately at 40, 60 and 80 Days after sowing (DAS) and then averaged.
3.6.2.1 Ear length (cm)
After harvest, ear length was measured with a meter scale from the base level to the top of the ear on five sampled plants, and the mean length was represented in centimeters.
3.6.2.2 No. of spikelets/ear
Total number of spikelets per ear were counted from five sampled plants and then averaged and presented as number of spikelets/ear.
3.6.2.3 No. of grains/ear
Total number of grains was counted by observing from each spikelets that was obtained from pre-selected five plants. After that it was averaged and presented as number of grains/ear.
3.6.2.4 1000-grain weight (g)
One thousand cleaned dried seeds were counted randomly from harvest area of each plot and weighed by using digital electric balance and the mean weight was expressed in gram.
22
3.6.2.5 Grain yield (t ha-1)
Wheat was harvested from selected 1m2 area of land of each plot. Then the seeds were threshed, cleaned and sun-dried. After that the grain yield recorded and converted into t ha-1.
3.6.2.6 Straw yield (t ha-1)
Straw from each individual plot was dried and properly weighed. The straw yield was then converted to t ha-1.
3.6.2.7 Harvest index (%)
Harvest index was calculated from per hectare grain yield and straw yield that were obtained from each unit plot and expressed in percentage using the following formula-
HI= 𝐺𝑟𝑎𝑖𝑛 𝑌𝑖𝑒𝑙𝑑
𝐵𝑖𝑜𝑙𝑜𝑔𝑖𝑐𝑎𝑙 𝑌𝑖𝑒𝑙𝑑× 100
Here, Biological yield (t ha-1) = Grain Yield (t ha-1) + Straw Yield (t ha-1)
3.7 Analysis of data
The data obtained for different parameters were statistically analyzed following computer based software Statistix 10 and mean separation was done by LSD at 5%
level of significance.
23
CHAPTER 4
RESULT AND DISCUSSION
This chapter presents and discusses the outcome of the study for various growth and yield parameters of wheat (BARI Gom 31) under water stress conditions which were influenced by different irrigation levels and different doses of biochar and Potassium (K), as well as other analyses. Data on different crop characteristics have been presented through Figures (1-12) and Tables (1-7). The analysis of variance on different parameters have been presented in Appendices (4-22).
4.1 Crop growth parameters
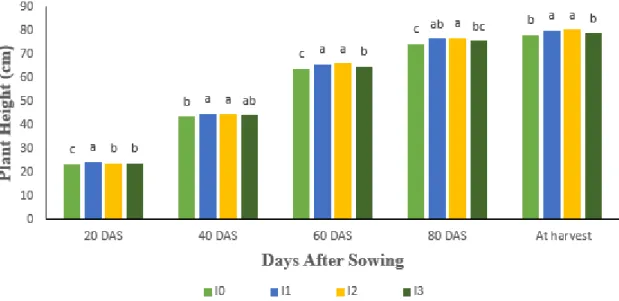
4.1.1 Plant height (cm) 4.1.1.1 Effect of irrigation
Plant height of wheat was influenced significantly in different stage of growth due to different levels of irrigation (Figure. 1). At 20 DAS, the tallest plant height was 24.30 cm that recorded from I1 (one irrigation) and the shortest plant (23.44 cm) recorded from I0 (no irrigation). And data recorded 23.83 cm and 23.74 cm obtained from I2 (two irrigation) and I3 (three irrigation), respectively were statistically similar. At 40 DAS the longest (44.67 cm) and shortest plant (43.64 cm) was recorded from I1 (one irrigation) and I0 (no irrigation) respectively. Accordingly, at 60 DAS, 80 DAS and at harvest the longest (65.97, 76.77, 80.30 cm) and the shortest (63.81, 74.30, 78.10 cm) plant heights were measured from I2 (two irrigation) and I0 (no irrigation) respectively. Irrigation at critical stages is important for plant height. Hwary and Yagoub (2011) and Dang et al. (2012) studied the impact of
24
irrigation at various stages of wheat plant growth and observed that irrigation at various levels had a substantial impact on plant height.
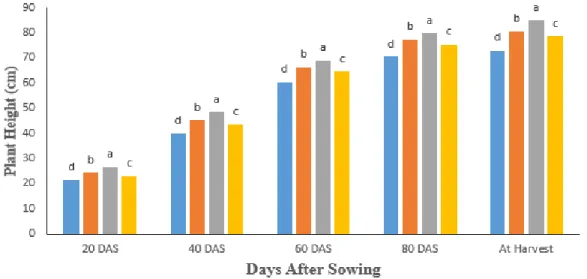
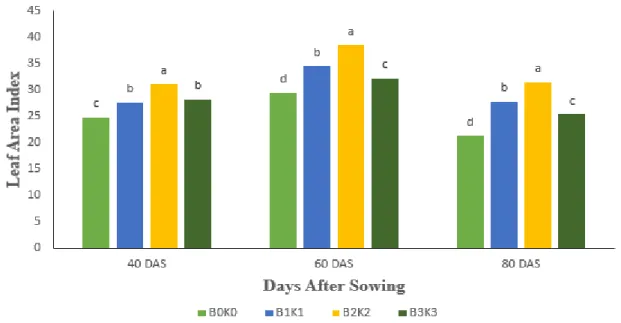
4.1.1.2 Effect of Biochar and Potassium (K) management
Because of different dosages of biochar and K, plant height varied significantly (Figure 2.). At 20, 40, 60, 80 DAS and at harvest the highest plant height (26.41,48.38, 69.07,79.85 and 85.02 cm respectively) were recorded from B2K2
(K:36 kg ha-1+ Biochar: 5 t ha-1) followed by B1K1 (K:48 kg ha-1+ Biochar: 5 t ha-1) and B3K3 (K: 48 kg ha-1 + Biochar: 0 t ha-1). And the lowest plant height (at 20.40,60,80 and at harvest were 21.50, 39.93, 60.48, 70.38, 73.12 cm respectively) were recorded from B0K0 (K: 0 kg ha-1 + 5 t ha-1 biochar). Zee et al. (2017), Iqbal (2017), Li and Shangguan (2018) analyzed the effect of biochar and observed that varying levels of biochar application boosted wheat plant height. Saren and Jana (2008) discovered that applying 50 kg of potassium per hectare as a top dressing after irrigation resulted in the longest plant.
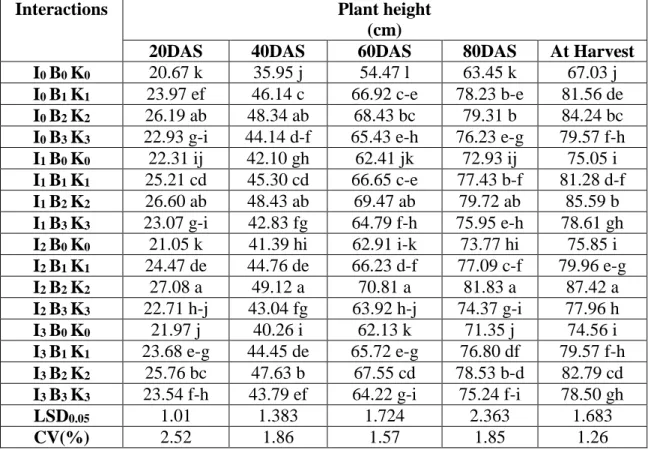
4.1.1.3 Interaction effect of irrigation and Biochar and Potassium (K) management
Interaction effects of different levels of irrigation and biochar and potassium (K) on plant height showed significant differences (Table 1). The highest plant height is showed at 20, 40, 60, 80 and at harvest were 27.08, 49.12, 70.81, 81,83 and 87.42 cm respectively from I2B2K2 (two irrigations with K:36 kg ha-1 + Biochar: 5 t ha-1).
And the lowest height (20.67, 35.95, 54.47, 63.45 and 67.03 cm at 20,40,60,80 DAS and at harvest respectively) recorded from I0B0K0 (no irrigation with K: 0 kg ha-1 + 5 t ha-1 Biochar). Without irrigation and potassium plant height drastically reduced.
25
Here, I0 =Control, I1=Irrigation at crown root initiation stage, I2=Irrigation at crown root initiation stage + Flowering stage, I3= Irrigation at crown root initiation stage + Flowering stage + Grain filling stage.
Figure 1. Influence of different levels of irrigation on plant height at different stages of wheat (LSD0.05= 0.1921, 0.550, 0.847, 1.261 and 1.027 at 20,40,60,80 DAS and at harvest respectively).
Here, B0K0=5 t ha-1 Biochar + 0 kg ha-1 K, B1K1=5 t ha-1 Biochar + 48 kg ha-1, B2K2= 5 t ha-1 Biochar + 36 kg ha-1 K, B3K3= 0 t ha-1 Biochar + 48 kg ha-1 K,
Figure 2. Influence of biochar and potassium (K) management on plant height at different stages of wheat (LSD0.05= 0.506, 0.692, 0.862, 1.181 and 0.841 at 20,40,60,80 DAS and at harvest respectively)
26
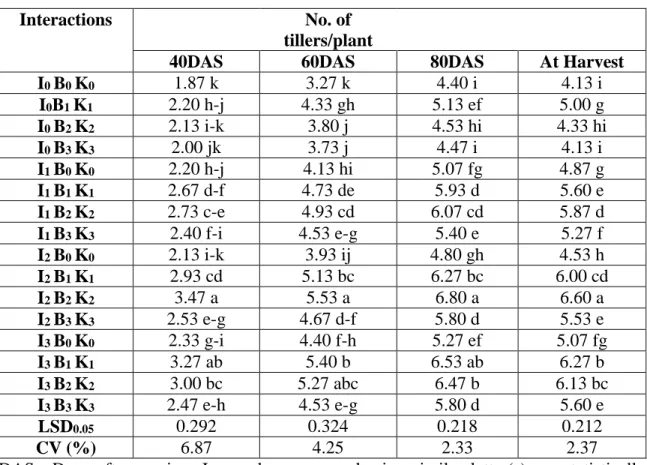
Table 1. Interaction effects of Irrigation and Biochar and Potassium(K) on plant height at different growth stage of wheat:
Interactions Plant height
(cm)
20DAS 40DAS 60DAS 80DAS At Harvest
I0 B0 K0 20.67 k 35.95 j 54.47 l 63.45 k 67.03 j I0 B1 K1 23.97 ef 46.14 c 66.92 c-e 78.23 b-e 81.56 de I0 B2 K2 26.19 ab 48.34 ab 68.43 bc 79.31 b 84.24 bc I0 B3 K3 22.93 g-i 44.14 d-f 65.43 e-h 76.23 e-g 79.57 f-h I1 B0 K0 22.31 ij 42.10 gh 62.41 jk 72.93 ij 75.05 i I1 B1 K1 25.21 cd 45.30 cd 66.65 c-e 77.43 b-f 81.28 d-f I1 B2 K2 26.60 ab 48.43 ab 69.47 ab 79.72 ab 85.59 b I1 B3 K3 23.07 g-i 42.83 fg 64.79 f-h 75.95 e-h 78.61 gh I2 B0 K0 21.05 k 41.39 hi 62.91 i-k 73.77 hi 75.85 i I2 B1 K1 24.47 de 44.76 de 66.23 d-f 77.09 c-f 79.96 e-g I2 B2 K2 27.08 a 49.12 a 70.81 a 81.83 a 87.42 a I2 B3 K3 22.71 h-j 43.04 fg 63.92 h-j 74.37 g-i 77.96 h I3 B0 K0 21.97 j 40.26 i 62.13 k 71.35 j 74.56 i I3 B1 K1 23.68 e-g 44.45 de 65.72 e-g 76.80 df 79.57 f-h I3 B2 K2 25.76 bc 47.63 b 67.55 cd 78.53 b-d 82.79 cd I3 B3 K3 23.54 f-h 43.79 ef 64.22 g-i 75.24 f-i 78.50 gh
LSD0.05 1.01 1.383 1.724 2.363 1.683
CV(%) 2.52 1.86 1.57 1.85 1.26
DAS= Days after sowing. In a column means having similar letter(s) are statistically similar and those having dissimilar letter(s) differ significantly at 5% level of significance.
Here, I0 =Control, I1=Irrigation at crown root initiation stage, I2=Irrigation at crown root initiation stage + Flowering stage, I3= Irrigation at crown root initiation stage + Flowering stage + Grain filling stage.
Here, B0K0=5 t ha-1 Biochar + 0 kg ha-1 K, B1K1=5 t ha-1 Biochar + 48 kg ha-1, B2K2= 5 t ha-1 Biochar + 36 kg ha-1 K, B3K3= 0 t ha-1 Biochar + 48 kg ha-1 K,
27
4.1.2 Number of tillers/plant 4.1.2.1 Effect of irrigation
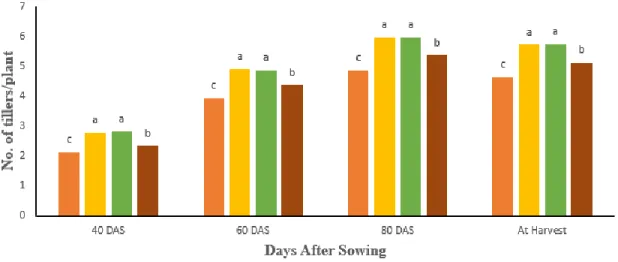
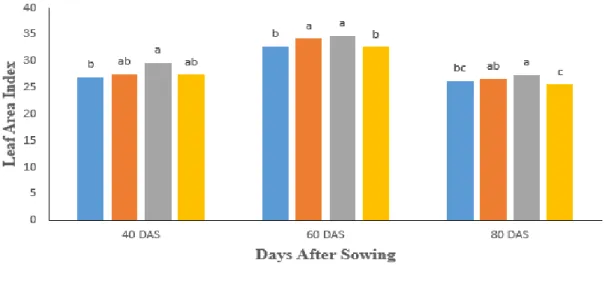
Different levels of irrigation varied significantly in terms of number of tillers/plant of wheat at 40 ,60, 80 DAS and at harvest in this experiment (Figure 3). At 40 DAS the highest number of tillers/plant viz. 2.77 was recorded from I2 (two irrigation) which is statistically similar to I3. But in case of 60, 80 DAS and at harvest the highest number of tillers/plant viz. 4.90, 6.01 and 5.76 were recorded from I3 (three irrigation) which are statistically similar to I2 (two irrigation). While corresponding the lowest number of tillers/plant (2.05, 3.78, 4.63 and 4.40 at 40, 60, 80 DAS and at harvest respectively) was recorded in I0 (no irrigation). However, I1 (one irrigation) showed intermediate result. The current study's findings are consistent with those of Sher and Parvender (2006), who showed that increased irrigation levels increased the number of tillers/plant.
4.1.2.2 Effect of Biochar and Potassium (K) management
The number of tillers/plant were significantly influenced by different doses of Biochar and Potassium (K) management (Figure 4). At 40, 80 DAS and at harvest in this experiment the number of tillers/plant were the highest (2.83, 5.97, 5.73) respectively at B2K2 (36 kg ha-1 K with 5 t ha-1 biochar). At 60 DAS the highest number of tillers/plant viz. 4.90 was recorded from B1K1 (48 kg ha-1 K with 5 t ha-1 biochar). Data recorded from B1K1 and B2K2 were statistically similar. On the other hand, B0K0 (no Potassium with 5 t ha-1 biochar) showed the lowest number of tiller/plant (2.13, 3.93, 4.88, 4.65 at 40, 60, 80 DAS and at harvest respectively).
Meanwhile, B3K3 (no biochar with 48 kg ha-1 K) showed intermediate result.