ISSN: 2339-076X (p); 2502-2458 (e)
,
Volume 4, Number 2 (January 2017): 749-757
DOI:10.15243/jdmlm.2017.042.749
Research Article
Effect of sago waste, manure and straw biochar on peanut (Arachis
hypogaea
L.) growth and yield on an Ultisol of Southeast Sulawesi
E. Tando
1,2*, A. Nugroho
3, T. Islami
3 1Postgraduate Program, Faculty of Agriculture, Brawijaya University, Jl. Veteran, Malang 65145, Indonesia
2
Institute for Agricultural Technology Southeast Sulawesi, Jl. Prof. Muh. Yamin No. 89, Kendari, Indonesia
3
Faculty of Agriculture, Brawijaya University, Jl. Veteran, Malang 65145, Indonesia *corresponding [email protected]
Abstract:
Farmland in Southeast Sulawesi is largely dominated by Red and Yellow Podzolic soil type or Ultisol up to 60.30% of total soil. Aspects that caused low productivity, deteriorating soil physically and chemical properties in Ultisol soil is low soil organic matter content. Average peanut production in Southeast Sulawesi 2014 reached 0.46 t, on the other hand average domestic production is 1.87 t. The decrease in production is caused by decline in land productivity. Low peanut production is caused by soil fertility. Declining soil fertility can be restored by applying organic matter into the soil, but, in a tropical environment, the rate of organic matter decomposition and mineralization take place very quickly, resulting in additional organic material each planting season. Another alternative is to reduce the organic matter decomposition rate and release carbon in the soil through utilizing agricultural and animal waste into biochar which is resistant to corrosion. The experiment was conducted using a randomized block design which consisted of nine treatments and three replications. The results exhibited that straw biochar at 25%, or 2.48 t/ha + manure biochar at 75% equivalent to 5.87 t/ha was capable of increasing growth and yield rate for peanut varietiesTalam1 . Peanut varieties Talam 1 yield increased after sago waste , manure and straw application, by 45.62% compared to peanut crops yield without utilizing biochar on Ultisol.Keywords: biochar, peanut, sago, ultisol
Introduction
Farmland in Southeast Sulawesi is largely dominated by Red and Yellow Podzolic soil type or Ultisol amounted to 60.30% (BPS Sultra, 2015). Aspect that causes low productivity, deteriorating soil in physical and chemical properties in ultisol soil is low soil organic matter content. Dry acid ultisol soil have acid ground reaction, Al content that could be exchanged and P fixations, low organic matter content, low alkali and cation exchange, alkali saturation and low biological activity (Hidayat and Mulyani 2005; Hartatik and Setyana, 2012). Soil physical properties limiting factors is described as follows. high BD (bulk density), low water mitigation ability and soil densification (Erfandi et al.,2003). Average peanut production in Southeast Sulawesi 2014 is 0.46 t, it could be considered low compared to the average domestic peanut production which is at 1.87 t (CBS, 2015).
Decrease in production is caused by decline in peanut productivity (Raja et al., 2013). In addition, said decline is caused by several factors, e.g. soil fertility, cultivation techniques, the availability of improved seed as well as pests and diseases (Mulyani, 2006). Soil fertility decline can be restored by applying organic matter into the soil through administering organic matter in the form of manure, compost and green fertilizer or
pupuk hijau (Sudiarso 2007). Application of organic matter into the soil through manure and agricultural crops waste can increase soil N and C content (Fliebbach et al., 2007). However, in a tropical environment, the organic matter decomposition and mineralization rate take place very quickly, therefore requiring additional organic material each planting season to maintaining land productivity (Glaser et al.,
productivity and increase in farming cost. An alternative to reduce organic matter decomposition rate and release carbon from soil is through utilization of agricultural and animal waste into biochar or bio-charcoal which is resistant to corrosion.
Lehmann and Joseph (2009) states that biochar is a material derived from biomass or processing plant waste which is heated in a container with little to no oxygen. Additionally, biochar is fine grains of porous charcoal, when in maintaining soil it can reduce the amount of CO2 from the air (Gani 2009). Lehmann (2007) states that all organic material added to soil will give significant effect in increasing soil functions variety, including retention (ability to reserve nutrients) for plant growth, but biochar hold nutrients more effectively so there are more available nutrient compared leaf, compost and manure fertilizer. Biochar application into soil has the potential of increasing the C content - soil, water and nutrient retention in soil (Mawardiana et al.,2013).
Biochar potential use in maintaining soil is huge in Southeast Sulawesi, considering the availability of raw materials from the agricultural crops and animal waste. Sago waste is one type of organic matter derived from plant tissues that contain macro and micro nutrients important to plants growth. Based on Chemistry and Soil Fertility Laboratory, Faculty of Agriculture UNTAN analysis, it exhibits that sago waste
bokashi contain high C-Organic (52.62%). (Sulistyowati, 2011). Sudiarso (2007) stated that fresh cow manure (undecomposed manure) contained 0.92% N, 0.43% P and 12.54% K, after anaerobic decomposition for 10 weeks contained 1.52% N, 0.71% P and 0.79% K. Straw is rice crops waste, that is easily obtained, can be utilized as environmentally sound fertilizers. Waste straw is one type of organic material containing high C / N ratio (50-70%). Materials that have high C / N give greater influence to change the soil physical properties (Nurhayati et al., 2011).
The purpose of this research was to study the effect of sago waste, manure and straw biochar on peanut growth and yield in an Ultisol.
Materials and Methods
The research was conducted in the Ranomeeto Village, Ranomeeto Sub-District, South Konawe, Southeast Sulawesi Province, from January 2016 to June 2016. The study area is geographically located on 04003.017 S and 122027.569 E, at an altitude of 109 meters above sea level (masl), pH 4.3 (high acid), Ultisol soil type. Humidity average is 80.01%, and the average daily temperature is 28.150C. The experiment was conducted using a randomized block design, which consisted of nine treatments and three replications (Table 1)
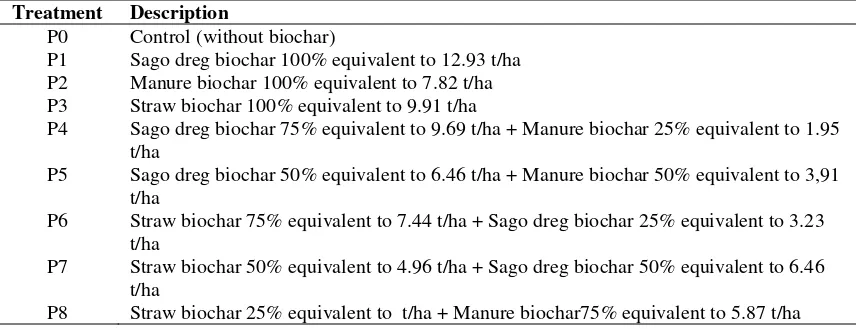
Table 1. Biochar application treatment.
Treatment Description
P0 Control (without biochar)
P1 Sago dreg biochar 100% equivalent to 12.93 t/ha P2 Manure biochar 100% equivalent to 7.82 t/ha P3 Straw biochar 100% equivalent to 9.91 t/ha
P4 Sago dreg biochar 75% equivalent to 9.69 t/ha + Manure biochar 25% equivalent to 1.95 t/ha
P5 Sago dreg biochar 50% equivalent to 6.46 t/ha + Manure biochar 50% equivalent to 3,91 t/ha
P6 Straw biochar 75% equivalent to 7.44 t/ha + Sago dreg biochar 25% equivalent to 3.23 t/ha
P7 Straw biochar 50% equivalent to 4.96 t/ha + Sago dreg biochar 50% equivalent to 6.46 t/ha
P8 Straw biochar 25% equivalent to t/ha + Manure biochar75% equivalent to 5.87 t/ha
Research stages involve land cultivation, biochar manufacture, liming, biochar application, planting, base fertilizing, plant reform and harvest. Plant growth parameter observed included. the number of leaf, leaf area and leaf area il index. Unfolded leaves at 21, 35, 49, 56
would be followed by Least Significant Difference test (LSD) at 5%.
Results and Discussion
Nutrient status prior to biochar application
Soil fertility status or soil nutrient at research site, prior to biochar application is presented in Table 1. The soil at the research site according to Pusat Penelitian dan Pengembangan Tanah dan Agroklimat (2005) had low values of pH, C
content, N content, C/N ratio, available P content, exchangeable K content, and cation exchange capacity. Furthermore, according to Pusat Penelitian dan Pengembangan Tanah dan Agroklimat (2005), Ultisols and prime agricultural dry land soils are characterized by acidic soil reaction (pH 4.1 - 4.8), thin upper layered organic matter content (8-12 cm ), low to moderate, and low C / N ratio (5-10) at the bottom layer.
Table 1. Soil nutrient status at research site, prior to biochar application
Location
Parameter
pH (H2O) C (%) N(%) C/N P2O5Bray
(ppm P)
K (me/100 g
soil)
KTK (me/100 g
soil)
Ranomeeto Sub-district
4.3 0.09 0.02 4 5.01 0.01 5.16
Value*) Very Low Very
Low
Very Low
Very Low
Low Very Low Low
Note . Estimation criteria of soil analysis (Penelitian dan Pengembangan Tanah dan Agroklimat, 2005)
Plant growth
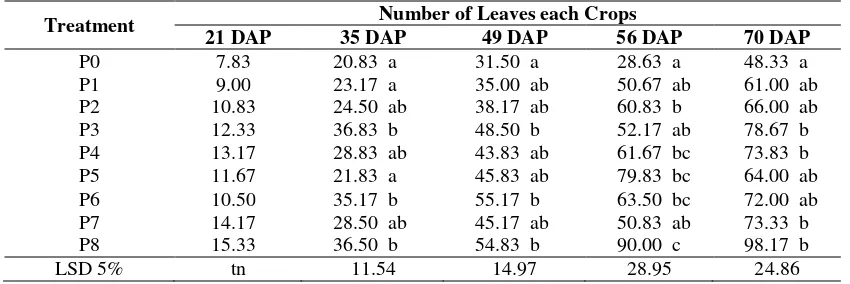
Data presented in Table 2 exhibit difference between treatment with and without biochar biochar on number of leaves at 35 49, 56 and 70 DAP. Application Straw Biochar 25% equivalent of 2.48 t/ha + Manure biochar 75% equivalent of 5.87 t/ha (P8), Straw Biochar 75% equivalent of 7.44 t/ha + sago dreg biochar 25% equivalent of 3.23 t/ha (P6) and Straw biochar 100% equal 9.91 t/ha (P3), showed an increase in leaf area compared to those without biochar application (P0). Increasing the number of leaves under the influence of biochar application, likely due to
biochar having a role in creating growing environment for plant growth by improving the physical, chemical and biological soil properties. Biochar potential as land reform media can improve the physical, chemical and biological soil and improve plant growth by supplying a number of useful nutrients (Glauser et al., 2002). With N, P and K availability, then the plant possess adequate nutrient availability, thus increasing plant growth. The increase in growth is caused by soil chemical properties include increased levels of N and P in soil (Chan et al., 2007; Harsono et al., 2010).
Table 2. Average number of leaves at various age observation (days after planting = DAP).
Treatment Number of Leaves each Crops
21 DAP 35 DAP 49 DAP 56 DAP 70 DAP
P0 7.83 20.83 a 31.50 a 28.63 a 48.33 a
P1 9.00 23.17 a 35.00 ab 50.67 ab 61.00 ab
P2 10.83 24.50 ab 38.17 ab 60.83 b 66.00 ab
P3 12.33 36.83 b 48.50 b 52.17 ab 78.67 b
P4 13.17 28.83 ab 43.83 ab 61.67 bc 73.83 b
P5 11.67 21.83 a 45.83 ab 79.83 bc 64.00 ab
P6 10.50 35.17 b 55.17 b 63.50 bc 72.00 ab
P7 14.17 28.50 ab 45.17 ab 50.83 ab 73.33 b
P8 15.33 36.50 b 54.83 b 90.00 c 98.17 b
LSD 5% tn 11.54 14.97 28.95 24.86
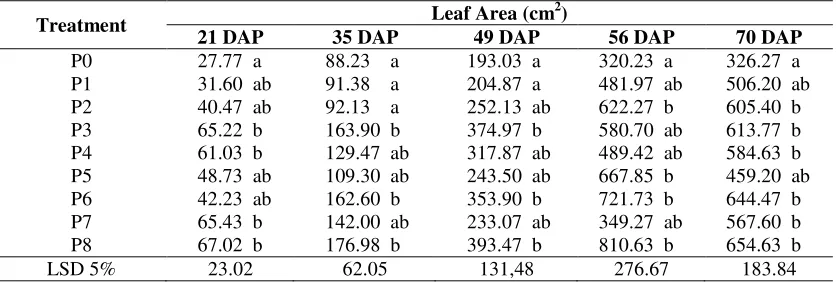
Table 3 shows the difference between the treatment with or without biochar. Variation trend of increased leaf area at various ages observations. Application Straw biochar 25% equal to 2.48 t/ha + manure biochar 75% equal to 5.87 t/ha (P8) exhibits bigger leaf area compared to those without biochar (P0). This is likely due to the biochar ability to help create an environment
fitting to grow crops and biochar nutrient availability spurs the growth of leaves to carry out photosynthesis. Laird et al. (2010) stated that application of biochar into the soil reduced the N, P and K leaching. Subsequent biochar application can improve soil C-organic, pH, structure, CEC and the capacity to store water (Chan et al., 2007).
Table 3. Average leaf area per plant at various age observation (days after planting = DAP).
Treatment Leaf Area (cm
2)
21 DAP 35 DAP 49 DAP 56 DAP 70 DAP
P0 27.77 a 88.23 a 193.03 a 320.23 a 326.27 a
P1 31.60 ab 91.38 a 204.87 a 481.97 ab 506.20 ab
P2 40.47 ab 92.13 a 252.13 ab 622.27 b 605.40 b
P3 65.22 b 163.90 b 374.97 b 580.70 ab 613.77 b
P4 61.03 b 129.47 ab 317.87 ab 489.42 ab 584.63 b
P5 48.73 ab 109.30 ab 243.50 ab 667.85 b 459.20 ab
P6 42.23 ab 162.60 b 353.90 b 721.73 b 644.47 b
P7 65.43 b 142.00 ab 233.07 ab 349.27 ab 567.60 b
P8 67.02 b 176.98 b 393.47 b 810.63 b 654.63 b
LSD 5% 23.02 62.05 131,48 276.67 183.84
Note . Numbers accompanied by the same letter in the column or the same age are not significantly different based on the LSD 5%; DAT (days after planting).
Table 4 shows the difference between the treatment with and without biochar regarding leaf area index at 21, 35, 49 and 56 DAP. Straw biochar 25% equal to 2.48 t/ha + manure biochar 75% equal to 5.87 t/ha (P8) resulted in higher leaf area index compared to those without biochar (P0). This was probably due biochar role in creating a growing environment that support crops vegetative growth through improved physical, chemical and biological soil properties. Biochar in maintaining soil role can improve soil physical properties, biology as well as supplying a number of nutrients essential for plant growth (Lehmann
et al., 2003; Lehmann and Rondon, 2006; Steiner, 2007). thus indirectly support plant growth. The vegetative growth development followed by peanut plants leaf area index. According to Sitompul (2016), the value of leaf area index> 1 illustrates the leaves mutual shading with the consequent reduction in the exposure to the leaf canopy shaded in the bottom layer with a lower rate of photosynthesis compared to shaded leaves. But this does not mean that the leaf area index≤1 is left without shade from one leaf to another. It is highly dependent on the morphology of the leaf (distribution, shape and position of the leaves).
Table 4. Average Leaf Area Index at various age observation (days after planting = DAP).
Treatment Leaf Area Index
21 DAP 35 DAP 49 DAP 56 DAP 70 DAP
P0 0.05 a 0.15 a 0.32 a 0.53 a 0.65
P1 0.05 a 0.15 a 0.34 a 0.80 ab 0.84
P2 0.07 ab 0.15 a 0.42 ab 1.04 b 1.01
P3 0.11 b 0.27 b 0.62 b 0.97 ab 1.02
P4 0.10 b 0.22 ab 0.53 ab 0.82 ab 0.97
P5 0.08 ab 0.18 ab 0.41 ab 1.11 b 0.77
P6 0.07 b 0.27 b 0.59 b 1.20 b 1.02
P7 0.11 b 0.24 ab 0.39 ab 0.58 a 0.95
P8 0.11 b 0.29 b 0.72 b 1.35 b 1.09
LSD 5% 0.04 0.10 0.22 0.46 tn
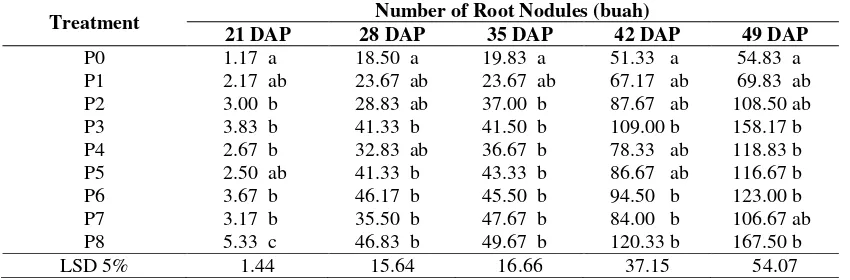
Table 5 shows the difference between the treatment with and without biochar crop leaves the number of observations at various ages. Straw biochar 25% equal to 2.48 t/ha + manure biochar 75% equal to 5.87 t/ha (P8) indicates the number of root nodules was higher compared to those without biochar (P0). Increasing the number of root nodules under the influence of biochar proved that it can be a good medium for soil microbes growth and development. Biochar application can increase the number of beneficial microbes. Microbes can aid peanut crops in fixating N through advantageous cooperation (Atkinson et al., 2010). The molecular structure of chemical biochar shows high stability for
microbes. Porous physical structure and large surfaces that provide favorable habitat for microorganisms such as bacteria and mycorrhizal which plays an important role in increasing nutrient. As a result of the specific surface area of biochar which reaches 400-800 m2/ g, it becomes adequate growth habitat, develops and accelerates activities for soil microorganisms, thereby increasing the nutrient availability for crops (Fiscer and Glaser, 2012). The existence of biochar in the soil can be used as a habitat for fungi and other soil microbes. Saito and Marumoto (2002) has reported that in the biochar micropores, fungi can sporulate, because of low competition that occurs with other saprofit.
Table 5. Average number of root at various age observation (days after planting = DAP).
Treatment Number of Root Nodules (buah)
21 DAP 28 DAP 35 DAP 42 DAP 49 DAP
P0 1.17 a 18.50 a 19.83 a 51.33 a 54.83 a
P1 2.17 ab 23.67 ab 23.67 ab 67.17 ab 69.83 ab
P2 3.00 b 28.83 ab 37.00 b 87.67 ab 108.50 ab
P3 3.83 b 41.33 b 41.50 b 109.00 b 158.17 b
P4 2.67 b 32.83 ab 36.67 b 78.33 ab 118.83 b
P5 2.50 ab 41.33 b 43.33 b 86.67 ab 116.67 b
P6 3.67 b 46.17 b 45.50 b 94.50 b 123.00 b
P7 3.17 b 35.50 b 47.67 b 84.00 b 106.67 ab
P8 5.33 c 46.83 b 49.67 b 120.33 b 167.50 b
LSD 5% 1.44 15.64 16.66 37.15 54.07
Note . Numbers accompanied by the same letter in the column or the same age are not significantly different based on the LSD 5%; DAP (days after planting).
Table 6 shows the difference between the number of ginofor with and without biochar treatment at 28, 35, 42 and 49 DAP. Straw biochar 25% equal to 2.48 t/ha + manure biochar 75% equal to 5.87 t/ha (P8) indicates higher ginofor amount compared to those without biochar (P0). Increased number of ginofor caused by biochar influence
capable of improving physical, chemical and biological through soil reform that facilitates ginofor growth and develop easily into the soil. Biochar utilization raises productivity through improved soil chemical, physical and biological soil properties (Glaser et al., 2002; Chan et al., 2007).
Table 6. Average number of ginofor at various age observation (days after planting = DAP).
Treatment Number of ginofor (/crops)
21 DAP 28 DAP 35 DAP 42 DAP 49 DAP
P0 0.00 0.37 a 2.00 a 13.33 a 14.67 a
P1 0.00 2.00 b 3.83 ab 13.17 a 16.33 a
P2 0.33 3.33 bc 3.67 ab 13.83 a 18.67 ab
P3 0.83 4.00 c 5.33 b 17.67 ab 27.17 b
P4 0.50 2.67 bc 5.17 b 17.17 ab 23.83 b
P5 0.00 2.33 bc 5.00 b 16.17 ab 27.17 b
P6 0.83 4.33 c 6.33 b 21.00 b 21.17 ab
P7 0.00 3.67 c 5.67 b 12.50 a 17.33 ab
P8 2.00 5.00 c 8.83 c 23.67 b 27.00 b
LSD 5% tn 1.37 2.23 5.54 7.13
Biochar application of organic materials can improve soil’s physical properties and beneficial to crops. The organic material may influence soil density, so reduced soil density will allow crop roots to grow easily and facilitate ginofor into the ground (Martin and Wijayanti, 2011).
Table 7 shows the total dry weight difference between crop treatment with and without biochar at 70 DAP. Straw biochar 25% equal to 2.48 t/ha + manure biochar 75% equal to 5.87 t/ha (P8) shows the total crops dry wight are higher compared to those without biochar (P0). The increase crops dry weight is caused by biochar ability to improve physical, chemical and biological soil properties, so as to facilitate the plant roots in improving nitrogen, phosphorus and potassium uptake and distributed to the plants’ vital organ which are reflected in total crop dry weight. Biochar can directly increase the crop nutrient content productivity and indirectly release nutrients and improve the nutrient retention, making it available to plants (Lehmann et al.,
2003).
Table 7. Average crop dry weight at 70 days after planting
Treatme nt
Dry weight of total crop (9) at 70 DAP
Note . Numbers accompanied by the same letter in the column or the same age are not significantly different based on the LSD 5%; DAP (days after planting).
Component of peanut crops
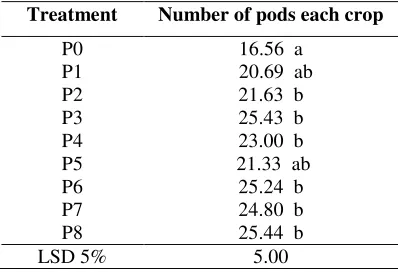
Table 8 shows the difference between the number of pods with and without treatment. Straw biochar 25% equal to 2.48 t/ha + manure biochar 75% equal to 5.87 t/ha (P8) showed higher number of pods compared to those without biochar (P0) at harvested at 93 DAP. Increased number of pods is high likely caused by biochar ability to improve physical, chemical and biological soil property, especially on low soil fertility such as in research sites, which have a low C-organic, low organic matter and a very low pH. Biochar can function as
area of the ground. Otherwise it could absorb anions, cations and molecules in the form of organic and inorganic compounds, solvents and gas (Asai et al., 2009). Table 8 shows the difference between the number of pods with and without biochar treatment. Straw biochar 25% equal to 2.48 t/ha + manure biochar 75% equal to 5.87 t/ha (P8) showed a high number of pods crop compared to those without biochar (P0) at 93rd DAP harvest.
Table 8. Average number of pods at 93rdday after planting
Treatment Number of pods each crop
P0 16.56 a
Note . Numbers accompanied by the same letter in the column or the same age are not significantly different based on the LSD 5%; DAP (days after planting).
Table 9 shows the difference in pods dry weight cropping with and without biochar treatment at 93rd DAY harvest. On the other hand, Table 10 shows the difference between the peanut yield with and without biochar at 93rd DAP harvest. Biochar influence on crop productivity depends on the amount and the ingredients applied. This is consistent with the statement of Gani (2010) that increased crop productivity is affected by applied biochar amount.
Table 9. Average pods dry weight at 93rdday after planting
Treatment Pods dry weight each crop (g)
P0 12.34 a
The results showed straw biochar 25% equivalent of 2.48 t/ha + manure biochar 75% equivalent of 5.87 t/ha (P8) indicates the pods dry weight and high yields compared to those without biochar (P0) at 93rd day harvest.
Table 10. Average harvest at 93rd day after planting.
Note . Numbers accompanied by the same letter in the column or the same age are not significantly different based on the LSD 5%; DAP (days after planting).
This was caused by influence of biochar which could improve physical and chemical soil properties so that it could meet plant nutrient needs and in the end influence peanut yield.
Lehman et al. (2003) stated that with increasing biochar doses, encourages plants positive response and and increase máximum achievement in certain areas. In this study, sago waste, animal manure and straw biochar can increase pods dry weight by 45.72% and its yield by 45.93% compared to those without biochar. In addition, the influence of biochar can improve physical, chemical and biological soil fertility, especially on soils with low fertility such as in research sites, which have low C-organic (12.09%), low organic matter (0.15%) and very low pH (4.3). Glaser et al. (2002) states that increase in nutrient retention and availability occured after biochar application, increased nutrient retention can improve fertilizer efficiency and reduce nutrient leaching (Steiner et al., 2008) and increase crop yields (Verheijen, 2009).
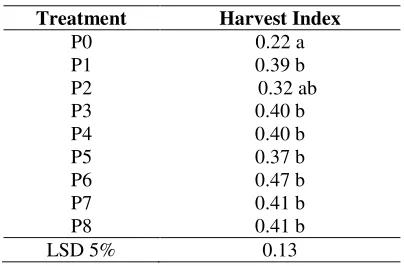
Table 11 shows the harvest index difference between those with and withour biochar treatment. Harvest index is a value that describes the photosynthesis distribution (biomass) plants between the two parts of the plant which are photosythesis organ and economically valuable organs (pods). Straw biochar 7.44 75% equal to 2.48 t/ha + 25% sago dreg biochar 3.23 t/ha (the P6), Straw biochar 25% equal to 2.48 t/ha + manure biochar 75% equal to 5.87 t/ha (P8) and Straw biochar 25% equal to 2.48 t/ha + manure biochar 75% equal to 5.87 t/ha (P8) and Straw
biochar equal to 50% 4.96 t/ha + sago waste biochar 50% equal to 6.46 t/ha (P7) shows the harvest index were higher tan those without biochar (P0) during harvest. The increased harvest index is caused by biochar influence, which is capable of improving growth conditions through improvements in physical, chemical and biological properties, crops will grow well and possess improved results.
Table 11. Average harvest index at 93rdday after planting.
Note . Numbers accompanied by the same letter in the column or the same age are not significantly different based on the LSD 5%; DAP (days after planting).
Latuponu et al. (2011) exhibits that sago waste biochar can increase C-organic, pH, Al-dd, KPK and prevent N leaching. Moreover, the results of Yamato et al. (2006) research ehxhibits that biochar application from acacia wood plus fertilizer, can increase peanut yield. Manure fertilizer and manure biochar application on cassava and peanut significantly increased crop yields. Biochar application and fertilizer is capable of optimizing efficient use of land (Islami et al., 2011)
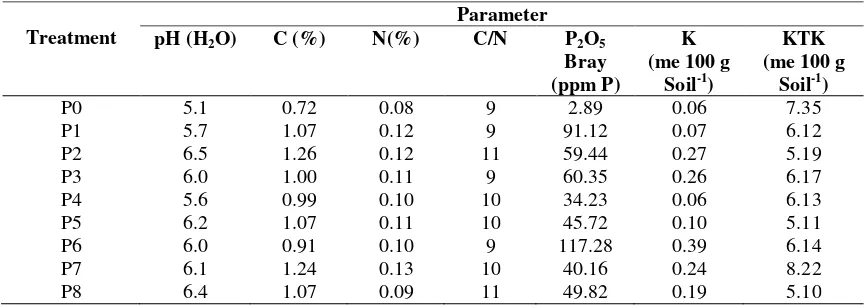
Nutrient status after biochar application
Table 12. Nutrient Status in research site after biochar application
Straw Biochar 25% equivalent to 2.48 t/ha + Manure biochar 75% equivalent to 5.87 t/ha could increase growth and an increase in peanut Talam 1 varieties yield due to the sago waste, manure and straw biochar influence by 45.93% compared to Ultisol without biochar.
Acknowledgement
Agriculture Research and Development Department and Post Graduate Program Agriculture Faculty of Universitas Brawijaya
References
Amonette, J.E. and Joseph S. 2009. Characteristic of biochar : Microchemical properties. In : Lehman J. and Joseph S. (eds). Biochar for Environmental Management.Science and Technology. Earthscan. London, UK. p. 33 - 52.
Asai, H., Samson, B.K., Haefele, M., Stephan, S., Khamdok, H., Koki, K., Yoshiyuki, I., Yoshio, S., Tatsuhiko, H. and Takeshi, H. 2009. Biochar amendment techniques for upland rice production in Northern Laos : 1. Soil physical properties, leaf SPAD and grain yield.Field Crop Research111 (1 - 2) : 81-84.
Atkinson, C.J. Fitzgerald, J.D. and Hipps, N.A. 2010. Potential mechanisms for achieving agricultural benefits from biochar application to temperate soil : a review.Plant and Soil337: 1 - 18.
Badan Pusat Statistik Provinsi Sulawesi Tenggara, 2015. Sulawesi Tenggara Dalam Angka. BPS Sulawesi Tenggara. p. 17.
BPS. 2015. Tanaman Pangan. Available at http://bps.go.id/tnmn_pgn.php
Chan, K.Y., van Zwieten, L., Meszaros, I.. Downie, A. and Joseph, S. 2007. Agronomic values of greenwaste biochar as a soil amendement.
Australian Journal of Soil Research45 : 629 - 634. Erfandi, D., Kurnia, U. dan Juarsa, I. 2003.
Prosiding Simposium Nasional Pendayagunaan Tanah Masam. Pusat Penelitian dan Pengembangan Tanah dan Agroklimat. Badan Penelitian dan Pengembangan Pertanian. Departemen Pertanian. Fisher, D. and Glaser, B. 2012. Synergisms Between
Compost and Biochar for Sustainable Soil Amelioration “Management of Organic Waste”. Institute of Agricultural and Nutritional Sci. Soil Biogechemistry, Halle. Germany.
Fliebbach, A. Oberholzer, H., Gunst, L. and Mader, P. 2007. Soil organic matter and biological soil quality indicators after 21 years of organic and conventional farming.Agriculture, Ecosystem and Environment118 : 273 - 284.
Gani, A. 2009. Biochar Penyelamat Lingkungan.Warta Penelitian dan Pengembangan Pertanian31 : 6. Gani, A. 2010. Multiguna Arang - Hayati Biochar.
Sinar TaniEdisi 13 - 19 Oktober 2010.
Glaser, B., Lehmann, J. and Zech, W. 2002. Ameliorating physical and chemical properties af highly weathered soils in the tropics with charcoal : a review.Biology and Fertility of Soil 35 : 219 -230.
Glauser, R., Doner, H.E. and Paul, E.A. 2002. Soils aggregate stability as a function of particle size sludge treated soils. Soil Science 146 : 37 - 43. Harsono, A., Subandi. dan Suryantini. 2010. Formulasi
Pupuk Hayati dan Organik untuk Meningkatkan Produktivitas Aneka Kacang 20%, Ubi 40% Menghemat Pupuk Kimia 50%. Laporan Hasil Penelitian Tahun 2010. Balai Penelitian Tanaman Kacang-Kacangan dan Umbi-umbian. p. 53. Hartatik, W. dan Setyana, 2012. Ameliorasi dan
Pemupukan untuk Peningkatan dan Produktivitas Kedelai.di Lahan Suboptimal. Prosiding Seminar Nasional Teknologi Pemupukan dan Pemulihan Lahan Terdegradasi. Badan Penelitian dan Pengembangan Pertanian. Kementerian Pertanian. Hidayat, A. dan Mulyani, A. 2005. Lahan Kering Untuk
East Java, Indonesia. Journal of Tropical Agriculture 49 (1-2) : 40 - 46.
Laird, D.A. Fleming, P., Davis, D.D., Horton, R., Wang, B. and Karten, D. 2010. Impact of biochar amendments on the quality of typical midwestern agricultural soil.Geoderma158 : 443 - 449. Latuponu, H., Shiddieq, Dj., Syukur, A. dan Hanudin,
E. 2011. Pengaruh biochar dari limbah sagu terhadap pelindian nitrogen di lahan kering masam.
Jurnal Agronomika11 (2) : 144 - 155.
Lehman, J. and Rondon, M. 2006. Biochar Soil Management on Highly Weathered Soil in the Humid Tropics. 517- 530 in Biological Approaches to Sustainable Soil System (Norman Upholf et al Eds).Taylor & Francis Group PO BOX 409267 Atlanta, GA 30384-9267.
Lehmann, J. and Joseph, S. 2009. Biochar for Enfironmental Management Science and Technology. Earthscan in the UK and USA. Lehmann, J. 2007. Bioenergy in the black.Frontiers in
Ecology and the Enviroment 5 : 381- 387. Lehmann, J., da Silva Jr. JP., Steiner, C., Nehls, T.,
Zech W. and Glaser, B. 2003. Nutrient availability and leaching in an archaeological anthrosol and a ferralsol of the Central Amazon Basin: fertilizer, manure and charcoal amendements.Plant and Soil
249 : 343 - 357.
Liang, B., Lehmann, J., Solomon, D., Kinyangi, J., Grossman, J., O’Neill, B., Skjemstad, J.O., Thies, J., Luizao, F.J., Peterson, J. and Neves, E.G. 2006. Black carbon increases cation exchange capacity in soils.Journal Soil Science Society of America70 : 1719 - 1730.
Marthin, A.K. dan Wijayanti, F.W. 2011. Pengaruh bokelas dan pupuk kandang terhadap hasil kacang tanah (Arachis hypogealL.)Jurnal Agrinimal1 (1) : 28 - 32.
Mawardiana, Sufardi. dan Husen E. 2013. Pengaruh residu biochar dan pemupukan NPK terhadap sifat kimia tanah dan pertumbuhan serta hasil tanaman padi musim tanam ketiga. Jurnal Konservasi Sumber Daya Lahan1 (1) : 16 - 23.
Mulyani, A. 2006. Potensi lahan kering masam untuk pengembangan pertanian. Warta Penelitian dan Pengembangan Pertanian28 (2) : 16 - 17.
Nurhayati, Jamil, A. dan Anggraini, R.S. 2011. Potensi limbah pertanian sebagai pupuk organik lokal di lahan kering dataran rendah iklim basah. Jurnal Iptek Tanaman Pangan(6) (2) : 193 - 202.
Pusat Penelitian dan Pengembangan Tanah dan Agroklimat. 2005. Teknologi Pengelolaan Lahan Kering; Menuju Pertanian Produktif dan Ramah Lingkungan. Badan Penelitian dan Pengembangan Pertanian. Departemen Pertanian. Edisi kedua. 245 pp.
Raja, B.S.L., Damanik, B.S.J. dan Ginting, J. 2013. Respon pertumbuhan dan produksi kacang tanah terhadap bahan organik Tithonia diversifolia dan pupuk SP-36. Jurnal Online Agroekoteknologi Universitas Sumatera Utara1 (3) : 725 - 731. Saito, M. and Marumoto, S. 2002. Inoculation with
arbuscular micorrhizal fungi. The status quo in Japan and the future prospects.Plant and Soil244 : 273 - 279.
Sitompul, S.M. 2016. Analisis Pertumbuhan Tanaman. UB Press. Malang. pp. 406.
Steiner, C. 2007. Soil charcoal amendments maintain soil fertility and establish carbon sink – res. and prospects. Soil Ecology Research Developments. Nova Science Publishers, Inc. p. 1 - 6.
Steiner, C., Glaser, B., Teixeira, W.G., Lehmann, J.J., Blum, W.E.H. and Zech, W. 2008. Nitrogen retentation and plant uptake on a highly weathered central amazonian ferralsol amended with compost and charcoal.Journal of Plant Nutrition and Soil Science171 : 893 - 899.
Sudiarso. 2007. Pupuk Organik dalam Sistem Pertanian Berkelanjutan. Fakultas Pertanian Universitas Brawijaya. Malang. Cetakan Pertama. pp. 264. Sulistyowati, S. 2011. Pemberian bokashi ampas sagu
pada medium aluvial untuk pembibitan jarak pagar.
Jurnal Teknik Perkebunan & PSDL1 : 8 - 12. Verheijen, F.G.A., Jeffery, S., Bastos, A.C., van der
Veide, M. and Diafas, I. 2009. Biochar Application to Soil - A. Critical Scientific Rev. of Effects on Soil Properties, Processes and Functions. EUR 24099 EN, Office for the Official Publications of the European Communities, Luxembourg. pp 149. Warnock, D.D., Lehmann, J., Kuyper, T.W. and Rillig,
M.C. 2007. Mycorrhizal responses to biochar in soil concepts and mechanisms.Plant and Soil300 (1) : 9 - 20.