Internship Report on
Financial Performance Analysis of Jamuna Bank Limited
Submitted to
Department of Business Administration Faculty of Business
Sonargaon University (SU) Dhaka-1215
Submitted by
Md. Sabug Ali ID: BBA1901016139
Program: BBA ( Major in Accounting) Semister: Spring 2022
Department of Business Administration Faculty of Business
Sonargaon University (SU) Dhaka-1215
Internship Report
on
Financial Performance Analysis of Jamuna Bank Limited
Submitted for the Partial Fulfillment of the Requirements for the Degree of Bachelor of Business Administration
Submitted by:
Md.Sabug Ali BBA1901016139
Program: BBA (Major: Accounting) Semester: Spring 2022
Department of Business Administration Faculty of Business
Sonargaon University Dhaka-1215
Supervised by:
Md. Masud Rana Assistant Professor
Department of Business Administration Faculty of Business
Sonargaon University Dhaka-1215
Sonargaon University (SU) Dhaka-1215
Date of Submission: 12th May, 2022
ii
Letter of Transmittal
Date: 12th May, 2022
Md. Masud Rana Assistant Professor
Department of Business Administration Faculty of Business Studies
Sonargaon University Dhaka-1215
Subject: Submission of Internship Report.
Dear Sir,
I have completed the Internship report on “Financial Performance Analysis of Jamuna Bank Limited.” With due respect, I am submitting my internship report on the above mentioned title for the fulfillment of the requirements for the Degree of Bachelor of Business Administration.
I request you to receive the internship report prepared by me on the basis of my findings. Writing this internship report has been a great pleasure and an extremely interesting and rewarding experience. I tried my level best to complete this report properly and to produce a meaningful report within all the constraints.
All the supports and guidelines, I received from you proved very efficient to prepare the report. I would like to gratitude you for giving me such a great opportunity to prove my ability in making a quality report. If any mistakes remain I am heartily apologized for those. I hope you will take my mistakes with due consideration.
Sincerely yours,
………
Md.Sabug Ali ID:BBA1901016139
Department of Business Administration Faculty of Business Studies
Sonargaon University
i
ii
Certificate of Supervisor
This is to certify that Md.Sabug Ali student of BBA, ID No: BBA1901016139, Department of Business Administration, Sonargaon University (SU), Dhaka has successfully completed his
“internship report“ entitled “Financial Performance Analysis of Jamuna Bank Limited.”
under my supervision for the partial fulfillment of his BBA Program.
He has done his work according to my supervision and guidance. He has tried his level best to do this report successfully. I think this task will help him in future to create a better career.
I wish him all the best in his future endeavors.
………
Md.Masud Rana Assistant Professor
Department of Business Administration Faculty of Business
Sonargaon University (SU) Dhaka-1215
ii
Student’s Declaration
This is Md.Sabug Ali, a student of Bachelor of Business Administration ID: BBA1901016139 from Sonargaon University hereby declare that this internship report on “Financial Performance Analysis of Jamuna Bank Limited” is uniquely prepared by me.
I am further declaring that, this report is only prepared for my academic requirement and it will not publish in any magazine or journal.
Sincerely yours,
………..
Md.Sabug Ali ID: BBA1901016139
Department of Business Administration Faculty of Business
Sonargaon University (SU) Dhaka-1215.
iii
ii
Acknowledgement
At the very beginning I would like to express my deepest gratitude to almighty for giving me the strength and the composure to finish the task. I am also grateful to Sonargaon University for the academic life of BBA that I have passed and enjoyed here entirely.
Secondly, I would like to acknowledge my deepest gratitude to my honorable supervisor Md.
Masud Rana, Assistant Professor, Department of Business Administration, Sonargaon University. Without his guidance and help I would not have completed my internship report. He gave me enough motivation and time for my report. Whenever I was in need of any kind of help regarding preparation of my internship paper, I found him as my guardian.
Finally, I express my gratefulness to all those who have been helpful in the preparation of this internship report. It certainly would not have been possible without the help of many people and I would like to acknowledge my pleasure to all those who had helped me during this entire process.
iv
ii
Executive summary
Jamuna Bank Ltd. was incorporated as a public Limited company on the 3rd June 2001.under Company Act 1994. This is a 3rd generation bank.. The Bank carries banking activities through its 149 branches in the country. The commercial banking activities of the bank encompasses a wide range of services including mobilizing deposits, providing investment facilities, discounting bills, conducting money transfer and foreign exchange transactions, and performing other related services such as safe keeping, collections and issuing guarantees, acceptances and letter of credit.
The report attempts to analyze the financial performance of Jamuna Bank Limited. The objective of the study is to analyze the performance of Jamuna Bank Ltd., by doing ratio analysis, identifying problems and recommendations. Both primary and secondary data were collected for the study.
This paper is intended to provide improve analysis frame work to present the different aspect of performance of the Jamuna Bank Limited in Bangladesh. The framework of this report analysis the ratio and interrelated ratios of the health of the institution. The different types of ratios are liquidity Ratios, leverage ratio, efficiency and profitability ratio and market position ratios. This report has several chapters. Each chapter has been described properly as a descriptive study.
Bank’s profile included with proper details. So that readers can understand the profile properly.
Different types of Ratio analysis has done for Jamuna Bank. Tables, charts and figures are added in this report. The ratio analysis part is the crucial part of this report. It has been done very carefully. Findings are added as per the study. As a part of my BBA program, I used 5 years financial statement data from Jamuna Bank Limited annual report to calculate the ratios. This ratio helps me to find out the past situation of Jamuna Bank which might help them to overcome the past blunder and also help them to better future decision.
Last but not the least, some problems are shared that are found while analysing the financial performance and in the later chapter few suggestions are mentioned for the betterment of the Bank so that manager of Jamuna Bank can take precautionary steps if they feel the suggestions are well enough.
v
Table of Content
Serial No. Name of Contents Page No.
Title Page
Letter of Transmittal
iCertificate of Supervisor
iiStudent’s Declaration
iiiAcknowledgement
ivExecutive Summary
vChapter one: Introduction
1.1 Background of the Study 1
1.2 Rationale of the Study 1
1.3 Objectives of the Study 1
1.4 Methodology 2
1.4.1
Research Design 2
1.4.2
Nature of Data 2
1.4.3
Sources of Data 2
1.5 Scope of the Study 2
1.6 Significance of the Study 3
1.7 Limitations of the Study 3
Chapter Two: Organizational Overview
2.1 Introduction 4
2.2 Vision 4
2.3 Mission 4
2.4 Strategic Priority 5
2.5 Values 5-6
2.6 Objectives 6
2.7 Ethical Principles 6
2.8 Product and Services 6 2.8.1
Deposit Product 7
2.8.2
Loans Product 7
2.8.3
Card & ADC Product 8
2.8.4
Corporate Banking 8
Chapter Three: Internship Duties &
Responsibilites
3.1 Internship position and duties learning point 9
3.2 Description of the Internship 9-10
3.3 Duties performed in the general Banking 10
3.4 Foreign Remittance 11
3.5 Loan and Advances 11
Chapter Four: Data Collection & Analysis
4.1 Financial Performance Analysis 12
4.1.1
Liquidity Ratio 12
4.1.2
Efficiency and profitability Ratio 13 4.1.3
Leverage Ratio 13
4.1.4
Market Performance Ratio 13
4.2 Diagram of financial ratios 14
4.3 Ratio analysis for Jamuna Bank 15
4.3.1
Efficiency and Profitability ratios 15
a. Return on Asset 15-16
b. Return on equity
16 c. Return on investment capital 17
d. Expense control efficiency
18
e. Net profit margin 19
4.3.2
Liquidity ratio 20
a. Current Ratio 20 b. Earning assets to total assets ratios 21 c. Current deposits to total liabilities 22
d. Cash ratio 23
4.3.3 Debt ratios or leverage ratio 24
a. Debt to asset ratios 24
b. Debt to equity ratios 25
c. Equity multiplier 26
d. Capital adequacy ratio 27
4.3.4
Market performance ratio 28
a. Earnings per share (EPS) 28
b. Price-to-Earnings P/E ratio 29
Chapter Five: Findings
5.1 Findings 30
5.1.1
Findings regarding overall financial position of the bank
30 5.1.2
Findings specific to ratio analysis 31
Chapter Six: Recommendations & Conclusion
6.1 Recommendations for JBL 32-33
6.2 Conclusion 33
References 34
1
1.1 Background of the Study
The internship program is an essential part of to obtain a Bachelor of Business Administration (BBA) from Sonargaon University (SU). Each student must meet the required credit hours, then they are placed for observing a specific situation in a real workplace and to guide him to prepare their internship report, an honorable supervisor always guides the students to prepare their report well. I decided to prepare my internship report on the Financial Performance Analysis of Jamuna Bank Limited.
1.2 Rationale of the study
The rationale of the report is to measure the financial performance of Jamuna Bank comparing the years of 2016-2020. The analysis of financial performance is a subjective measure of a company's ability to utilize the resources of its primary mode of business and to generate revenue. This term is also used as a general measure of the overall financial health of a business over a given period of time and can be used to compare similar businesses in the same sector or to compare industries or sectors. In order to prepare my report I have collected different financial data for analysis the performance of the Bank. The scope of my study is limited to organizational setup, functions and performance.
To know the organogram of Jamuna Bank Limited and also evalute the performance of Jamuna Bank Limited.
Understanding Balance sheet, Income statement and Cash flow statement of Jamuna Bank Ltd.
1.3 Objectives of the study
To know the real business world is the main objective of our study. More specifically I am trying to understand the banking industry of Bangladesh. I collected the annual report of Jamuna Bank Limited and analysis those report to understand the performance of the bank. The prime objectives of the study are:
To give an overall view of Jamuna Bank.
To evaluate the financial performance of jamuna Bank Limited by using annual report of the bank.
To find out the strength and weakness of Jamuna Bank Limited.
To suggest remedial measures for the development of Jamuna Bank.
2
1.4 Methodology
Methodology is a systematic method that applied to a field of the study and its principles associated with a branch of knowledge. Primary and secondary data helps to create this report in effective way. The study is accomplished based on the information collected from balance sheet and income statement from annual report by using a specific methodology.
1.4.1 Research Design
This report is descriptive type which contain the overview of financial performance of Jamuna Bank Limited and also contain the mission, vision and product of the bank. I also collect the annual report of last 05 years of the bank for analysis. For data analysis I use ratio analysis is the main tools. By using Microsoft Excel we calculate different financial ratio which can give us the actual picture of the organizations financial health.
1.4.2 Nature of Data
I use the secondary data to complete the report (05 years annual report of Jamuna Bank Limited).
1.4.3 Sources of Data
To prepare the report and find out problem all required data have been collected from two sources, but mostly secondary data have been used for the analysis purpose of the report.
Secondary data sources:
Official website of Jamuna Bank Limited.
Annual Reports and other published documents of the banks.
Books, journals, research papers, newspaper articles have been used for the study purpose.
1.5 Scope of the Study
Banks have been playing an important role in economic development and contributing immensely to build the country. Banking sector is fast expanding in our country because of globalization and reform of private sector. To survive as a key player in this highly competitive and complex business environment a bank should develop its business focusing the customer’s satisfaction.
3
1.6 Significance of the Study
As a student, I have learned about a bank; I also have learned the report writing, as a great deal of theory is included in this report. It will be also benefited for the people who are interested to know about JBL. Here I try to evaluate the financial performance of JBL which will help user of this report to get an overall picture of the financial position of the Jamuna Bank Limited.
1.7 Limitations of the Study
Due to some legal obligation and business secrecy the bank was reluctant to provide some sensitive data. Thus, this study limits only on the available published data. Although the particular study is extensive in nature, hard effort was given to make the study worthwhile and meaningful even then there exists some limitation.
These limitations are:
Lack of time
The time limit of my internship program is only three month. This is very short time for understanding the banking industry of Bangladesh as well as performance analysis of Jamuna Bank Limited.
Inadequate data
Proper information and adequate date is the precondition of any qualitative research. During my research it was very difficult for me to collect the qualitative data.
Non-Disclosure policy
An organization can’t revile all its data and statistics to public because of its policy of secrecy.
So all these secret matters have not been possible to collect and to incorporate in the report which may result in a lesser amount of acceptability.
Lack of experiences
This is my first organized research work. So due to my lack of experience I may not been able to prepare my report properly. So my own observations may vary from person to person.
1
Chapter Two
An Overview of Jamuna
Bank Ltd.
4
2.1 Introduction
Jamuna Bank Limited (JBL) is a Banking Company registered under the Companies Act, 1994 of Bangladesh with its Head Office currently at Jamuna Bank Tower, Plot# 14, Bir Uttam A. K.
Khandaker Road, Block# C, Gulshan-1, Dhaka, Bangladesh. The Bank started its operation from 3rd June 2001.
The Bank provides all types of support to trade, commerce, industry and overall business of the country. JBL's finances are also available for the entrepreneurs to set up promising new ventures and BMRE of existing industrial units. The bank was established by a group of local entrepreneurs who are well reputed in the field of trade, commerce, industry and business of the country.
The Bank offers both conventional and Islamic banking through designated branches. The Bank is being managed and operated by a group of highly educated and professional team with diversified experience in finance and banking. The Management of the bank constantly focuses on understanding and anticipating customers' needs. Since the need of customers is changing day by day with the changes of time, the bank endeavors its best to devise strategies and introduce new products to cope with the change. Jamuna Bank Ltd. has already achieved tremendous progress since its beginning. The bank has already built up reputation as one of quality service providers of the country.
At present the Bank has real-time Online banking branches (of both Urban and Rural areas) network throughout the country having smart IT-backbone. Besides traditional delivery points, the bank has ATMs of its own, sharing with other partner banks and consortium throughout the country.
2.2 Vision
To become a leading banking institution and to play a significant role in the development of the country.
2.3 Mission
The Bank is committed for satisfying diverse needs of its customers through an array of products at a competitive price by using appropriate technology and providing timely service so that a sustainable growth, reasonable return and contribution to the development of the country can be ensured with a motivated and professional work-force.
5
2.4 Strategic Priority
Delivering customer’ desired products and services to create true customers’ value.
Focusing on export of both traditional and nontraditional items and remittance to ensure a comfortable position of foreign exchange all the time.
Doing businesses that have higher risk adjusted return.
Focusing on maintenance of assets quality rather than its aggressive expansion.
Changing the deposit mix thereby reduce the cost of deposits.
Ensuring all modern alternative delivery channels for easy access to our services by customers.
Taking banking to the doorstep of our target group.
Restructuring existing products and introducing new products to meet the demand of time and the target group.
Entering into new avenues of business to increase profitability.
Bringing unbanked people into our delivery channels.
Increasing fee based service/activities where costly capital is not changed.
Ensuring organizational efficiency by continuous improvement of human capital and motivation level, dissemination of information and thereby ensuring a sustainable growth of the organization.
Maximizing shareholders’ value at all times alongside ensuring a sustainable growth of the organization.
Pursuing CSR activities for our continued support to future generation, distressed people and for advancement of underprivileged people of the country.
Establishing the brand image as a growth supportive and pro-customers’ bank.
Strengthening risk management techniques and ensuring compliance culture.
Remaining cautious about environment and supporting for maintaining a green and clean soil.
2.5 Values
Customer Focus
Integrity
Quality
Teamwork
Respect for the individual
Harmony
Fairness
Courtesy
Committment
Respectable Citizenship
6
Business Ethics
Unique Culture
2.6 Objectives
To earn and maintain CAMEL Rating 'Strong'
To establish relationship banking and improve service quality through development of Strategic Marketing Plans.
To remain one of the best banks in Bangladesh in terms of profitability and assets quality.
To introduce fully automated systems through integration of information technology.
To ensure an adequate rate of return on investment.
To keep risk position at an acceptable range (including any off balance sheet risk).
To maintain adequate liquidity to meet maturing obligations and commitments.
To maintain a healthy growth of business with desired image.
To maintain adequate control systems and transparency in procedures.
To develop and retain a quality work-force through an effective human Resources Management System.
To ensure optimum utilization of all available resources.
To pursue an effective system of management by ensuring compliance to ethical norms, transparency and accountability at all levels.
2.7 Ethical Principles
We strictly comply with all rules and regulations.
We provide fair treatment to all stakeholders.
We maintain strict secrecy of customers’ accounts.
We listen to our customers and work to serve their needs.
We provide adequate disclosure of corporate information and operation results to shareholders for taking suitable investment decision.
2.8 Product and Services
The responsibility of the Bank is to provide financial solutions by taking different socio-economic factors into consideration. Bank is the primary agent for economic growth by channeling savings into productive investment activity. Jamuna Bank emphasizes the importance to bring the people of all segments under the banking system. Jamuna Bank has been launching different products and services since its inception. At present Jamuna Bank is operating with the following customer focused and distinctive products and services:
7
2.8.1 Deposit Product Transactional Accounts
Current Deposit (CD) Account
Short Notice Deposit (SND) Account
Savings Bank(SB) Account
Special Savings Bank Account
Fixed Deposit Receipts
Earn First Deposit Scheme
Lakhpati Deposit Scheme
Millionaire Deposit Scheme
Kotipati Deposit Scheme
Monthly Savings Scheme
Monthly Benefit Scheme
Islami Banking
Mudaraba Monthly Savings Deposit Scheme
Mudaraba Crorepoti Deposit Scheme
Mudaraba Lakhopoti Deposit Scheme
Mudaraba Double/Triple Growth Deposit Scheme
Mudaraba Education Deposit Scheme
Mudaraba Hajj Deposit Scheme
Mudaraba Marriage Deposit Scheme
Mudaraba Millionaire Deposit Scheme
2.8.2 Loans Product
Auto Loan
Any Purpose loan
Personal Loan
Salary Loan
Doctors Loan
Education Loan
Overseas Job Loan
8
2.8.3 Card & ADC Product Card
Visa classic credit card
Visa gold credit card
Visa dual gold credit card
Visa electron debit card
Protection plus
Corporate facility
Easy pay EMI & discount offer
ACD (Card Accountability, Responsibility and Disclosure)
ATM card
SMS & Mobile Banking Service
Mobile Financial Service
2.8.4 Corporate Banking
Corporate Banking of Jamuna Bank Limited offers customized corporate banking solution for both its local Business Houses as well as Multinational Companies. JBL’s Corporate Banking exposure is concentrated in diversified areas of business that include:
Spinning
Textile
Garments
Garments Accessories
Iron & Steel
Cement
Building Materials
Furniture & Furniture materials
Edible Oil
Food & Beverage items
Various Trading
Ship Building
Ship Breaking
Infrastructure Building & Construction
Electronics & Electrical Equipments
Agro & Agro Products
Transport
Real Estate
Transport
Real Estate
Telecommunication
1
Chapter Three Internship Duties
&
Responsibilities
9
3.1
Internship position and duties learning pointMy internship period was three months so I divided my work in time basis. I tried my best for acquiring data within the internship period. I visited the following departments within the period.
Department Time Duration
General Banking 10 days
Foreign Remittance 15 days
Loan and advances 10 days
Others 30 days
3.2 Description of the Internship
During my internship I worked according to the following routine:
I spent 45 hours per week at work on internship project. I tried to participate directly or indirectly in the daily operational activities of the branch.
Specific responsibilities of the Jobs:
As an intern, I have no specific job responsibility in the branch. I observed activities of almost all departments. But I carry out some responsibilities also:
In the general banking department, I helped the clients to fill up the account open form.
I gave information about different scheme of CBL that are offered.
I involved directly preparing the Bangladesh Bank’s Returns of Foreign Trade & foreign exchange transactions.
I prepared the IBEA (Inter Branch Exchange Advice) for the Head office.
I prepared some vouchers for the Import LC.
I wrote down PAD (Payment Against Document) register in the Import LC Section.
I wrote down Liability and Cash Margin Register for PAD (Payment Against Document) in the Import LC Section
These are some responsibilities that I carried in the Farmgate Branch.
Different aspect of job performance:
At first I started my internship from General Banking Department. I observed activities of different sections, namely Account Opening section, Cheque Book Issue and Dispatch section, Remittance Section, Clearing and Bills Section, Accounts Section, Cash Section.
10
Then I worked with Loan & Advance department. I got knowledge about various aspects of loans. I also knew how the credit officer analyses credit proposal and disburse credit if proposal is sound. I knew about different kinds of loan like secured, unsecured, hypo, pledge, cash credit etc.
At the end I worked in Foreign Exchange department. In this department, I facilitated the official for receiving and preparing the LlC (letter of Credit) document. I got knowledge about LC, PAD, LTR, LIM, ECC, and PCC, bill Purchase, F.C account etc.
3.3 Duties performed in the general Banking
General banking is one of the most important department every department transection. During my internship period I learn most from this section I did work in the following section in general banking Division:
Assistant on Loan sanctioning process
Account opening
Account Closing
Cheque Book Issue
Local Remittance Transaction
Clearing section
Now I am giving the explanation how I performed the bank duties:
General Banking
General banking is one of the most important departments of every bank transaction. During the period I learned most from the department. I did my work in the following sections,
a)
Account Opening: For opening a new account I collected some documents from the client because it was bank required formalities. Like two copies of passport size photos with attached signature, voter ID cards photos copy, one copy of nominees passport size photo etc.b)
Account closing: :when any client close there account, He/she send a application to bank manager ,If bank authority accept the application then bank charge 200 TK for saving account and 300 Tk. for current account and also take his cheque book and closing his account number.c)
Check Issue: If any client need check book then I put his/her account name and account number with the mobile phone number in to the register book. I also provide him/her the check book collection date.d)
Clearing: For clearing the check I input the checks data into the banks computer software that was passed me from the account section.11 3.4: Foreign Remittance
When remittance money or any other money comes from the different countries then I provide some forms to complete the client‟s agent. After completing the form I send it to the banks second head sir to check and signature for providing the clients expected money.
Basically I have done my job on loan and advance the information‟s are as follows.
3.5 : Loan and Advances
Welcoming the clients who came for loan and advances.
Provide them necessary documents for loan processing.
Assisting loan officer in calculating interest and quantitative figures
Helping the officer in setting installment of loan with interest and principal
Verification of the primary document and loan proposal with the direction of officer
Follow up the recovery of loan and advances.
Calling over phone to different clients who were default to pay loan for their updates
12
Chapter Four
Data Collection & Analysis
12
Financial Performance Analysis of Jamuna Bank Limited.
3.1 Financial Performance Analysis:
Financial Performance analysis is a process of evaluating the relationship between the component parts of financial statement to obtain a better understanding of the banks position and performance. This process helps to identify the strength and weakness of the bank by buildup the relationship between the balance sheet and income statement. The information is taken from financial statement and others reports which are performed by the professionals and top level management making their decisions from these reports.
The process of testing and comparing the financial information of different year’s ratio analysis is necessary. Data are mainly collected from the annual reports of financial statements. The value should be meaningful. Through ratio analysis, it is easy to understand the position of the company.
All the ratios that are analysis here are fall into four category:
Liquidity Ratio
Efficiency and profitability Ratio
Leverage Ratio
Market Performance Ratio
3.1.1 Liquidity Ratio
Liquidity alludes to the accessibility of assets of an organization to meet momentary money prerequisites. It is influenced by the planning of money inflows and surges alongside prospects for future execution. Examination of liquidity is gone for an organization's financing necessities.
In the event that an organization neglects to meet its present commitments, it’s proceeded with presence is farfetched. From this perspective, every single other proportion of investigation is in optional significance. In spite of the fact that bookkeeping estimations expect the organization's proceeded with presence, our investigation should consistently survey the legitimacy of this suspicion utilizing liquidity measures.
This section describes the key ratios relevant to assessing liquidity ratio:
Current ratio
Earning assets to total assets ratios
Current deposits to total liabilities
Cash ratio
13
3.1.2 Efficiency and profitability Ratio
Effectiveness alludes to how gainful an organization in utilizing its benefits. Productivity is typically estimated with respect to how much income is created from a specific degree of benefits. Besides, wasteful utilization of advantages can cause liquidity issues. Absence of liquidity regularly goes before lower benefit and fewer chances. An organization's clients and providers are likewise influenced by transient liquidity issues, and it is quicker when it is a financial organization.
This section describes the key ratios relevant to assessing efficiency and profitability:
Expense control efficiency
Return on Assets
Return on Equity
Return on investment
Net Profit Margin
3.1.3 Leverage Ratio
A leverage ratio is any kind of financial ratio that indicates the level of debt incurred by a business entity against several other accounts in its balance sheet, income statement, or cash flow statement. These ratios provide an indication of how the company’s assets and business operations are financed (using debt or equity).
This section describes the key ratios relevant to assessing leverage ratio:
Debt to asset ratios
Debt to equity ratios
Equity multiplier
Capital adequacy ratio
3.1.4 Market Performance Ratio
This section describes the key ratios relevant to assessing leverage ratio:
Earnings per share (EPS)
Price earnings ratio
14
Financial Ratio 3.2 Diagram of financial ratios:
Efficiency and profitability
ratios
Liquidity ratio Debt ratios or leverage ratio
Market performance ratio analysis
ROA
ROE
Return on investment
Current Ratio
Earning assets to total assets
ratios
Debt to asset ratios
Debt to equity ratios
Price
EPS Earing
Expense control efficiency
Current deposits to
total
liabilities Equity multiplier
Net profit
margin Cash ratio
Capital adequacy ratio
15
Return on Assets
1.22 1.2 1.18 1.16 1.14 1.12 1.1 1.08 1.06 1.04
2016 2017 2018 2019 2020
Return on Assets
3.3 Ratio analysis for Jamuna Bank:
3.3.1 Efficiency and Profitability ratios:
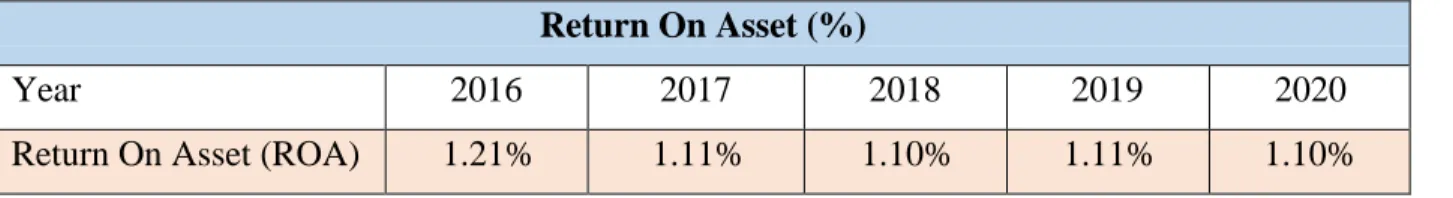
a. Return On Asset:
ROA is displayed as a percentage which gives an idea to a manager, investor or analyst that how efficient a bank is at using its assets to generate earnings. Higher ROA ratio is better because it indicates that bank is earning more money with less investment.
Formula: ROA = (Net income / Total assets)*100
Return On Asset (%)
Year 2016 2017 2018 2019 2020
Return On Asset (ROA) 1.21% 1.11% 1.10% 1.11% 1.10%
(Source JBL annual report) Graphical presentation
Fig: Return on Assets (ROA) Interpretation:
We found that the return on assets is fluctuating during the considering period. In the year 2016 it was maximum (1.21%) and in the year 2018 and 2020 it was minimum (1.10%). From our analysis we can say that although the fluctuation of ROA is very low between the years but there
16
Return on Equity
16 14 12 10 8 6 4 2 0
2016 2017 2018 2019 2020
Return on Equity
is a downward trend in the ROA which is worrying for the bank. A low percentage return on assets indicates that the bank is not making enough income from the use of its assets. Unstable economic condition, lower net investment income might be responsible for the poor ROA.
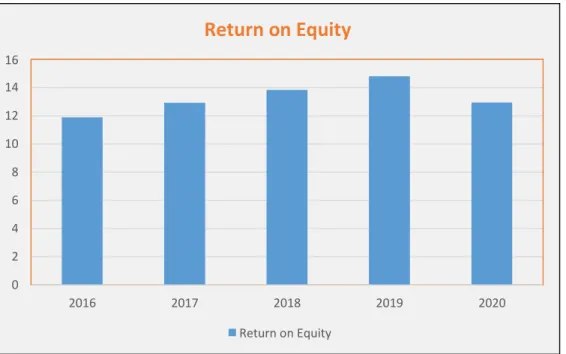
b. Return on equity:
Return on equity is the most important efficiency profitability ratio and this ratio measures the profit from it shareholders’ Investment in the bank. It also indicates how well banks management is deploying the shareholders' capital. In other words, the higher the ROE is the better.
Formula: ROE= (Net income / total equity) *100
Return On Equity (%)
Year 2016 2017 2018 2019 2020
Return On Equity (ROE) 11.89% 12.92% 13.83% 14.80% 12.93%
(Source JBL annual report) Graphical presentation
Fig: Return on Equity (ROE) Interpretation:
The return on equity measures the return earned on the owner’s investment. The graph shows that the bank return on equity has fluctuated over the years. In 2019 it was highest (14.80%) and in 2016 it was lowest (11.89%). However, the return on equity has decreased from 14.80% in 2019 to 12.93% in 2020 which might result because of some bad investment but the overall ROE trend of JBL is satisfactory.
17
Return on Investment
14 12 10 8 6 4 2
0
2016 2017 2018 2019 2020
Return on Investment
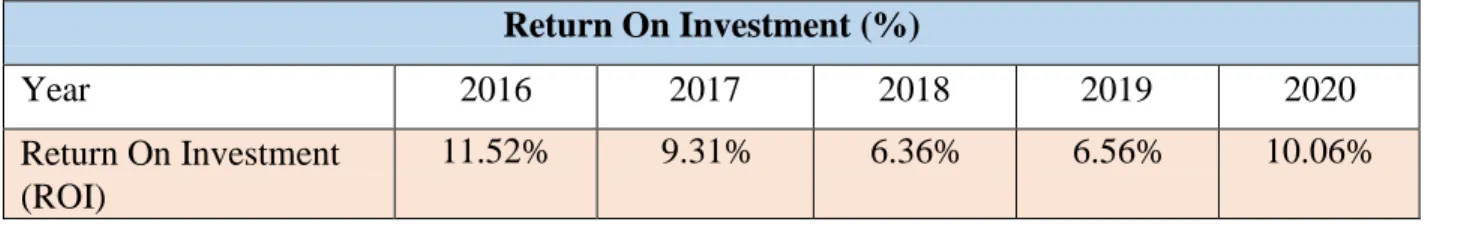
c. Return on investment capital:
This ratio gives an impression of how well a bank is using its capital to generate returns. Return on investment capital percentage often comparing with weighted average cost of capital to check whether invested capital is being used efficiently or not.
Formula: ROIC= (Net operating profit after tax/Invested capital)*100
Return On Investment (%)
Year 2016 2017 2018 2019 2020
Return On Investment (ROI)
11.52% 9.31% 6.36% 6.56% 10.06%
(Source JBL annual report) Graphical presentation
Fig: Return on Investment (ROI) Interpretation:
This graph shows that the bank return on investment capital has been fluctuating over the years. In 2016 it was highest (11.52%) and in 2018 it was lowest (6.36%). However, the return on investment has decreased from 11.52% in 2016 to 9.31%, 6.36%, and 6.56% in 2017, 2018, and 2019 respectively. But in 2020 they bounce back and start increasing again which means they are improving to generate the revenue.
18
Expense Control Efficiency
54 53 52 51 50 49 48 47 46
2016 2017 2018 2019 2020
Expense control efficiency
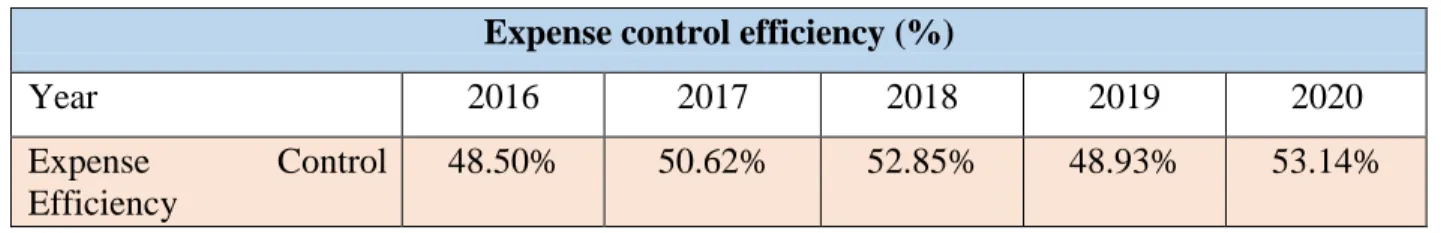
d. Expense control efficiency:
A bank's operating expenses are in the numerator and its revenue is in the denominator, a lower efficiency ratio means that a bank is operating better. If the efficiency ratio increases, it means a bank's expenses are increasing. It is a measure of operating efficiency and expense control and it indicates the percentage operating revenue after the operating expense is deducted.
Formula: Expense control efficiency = Total operating expense / Total operating revenue
Expense control efficiency (%)
Year 2016 2017 2018 2019 2020
Expense Control Efficiency
48.50% 50.62% 52.85% 48.93% 53.14%
(Source JBL annual report) Graphical presentation
Fig: Expense Control Efficiency Interpretation:
This graph shows that the bank return on investment capital has been fluctuating over the years.
However it can be seen that the average expense control efficiency for Jamuna Bank Limited Increased over the last 5 years is 50.81% which is good. Except for 2019 the overall trend of expense control efficiency is upward which means that the bank has a good grip over its expense.
19
Net Profit Margin
25 24.5 24 23.5 23 22.5 22
21.5
2016 2017 2018 2019 2020
Net Profit Margin
e. Net profit margin:
The net profit margin, or simply net margin, measures how much net income or profit is generated as a percentage of revenue. It is the ratio of net profits to revenues for a company or business segment. Net profit margin is typically expressed as a percentage but can also be represented in decimal form. The net profit margin illustrates how much of each taka in revenue collected by a company translates into profit.
Formula: Net profit Margin= Net profit after tax/ Revenue.
Net Profit Margin (%)
Year 2016 2017 2018 2019 2020
Net Profit Margin 23.12% 23.02% 23.60% 22.80% 24.59%
(Source JBL annual report) Graphical presentation
Fig: Net Profit Margin Interpretation:
This graph shows that the net profit margin of the bank was relatively stable over the 5 years period but in 2019 there is a decrease in net profit margin which might be due to higher operating cost during that year. However in 2020 the net profit margin increased by 1.79% than the previous year which is good sign for the bank.
20
Current Ratio
1.4 1.2 1 0.8 0.6 0.4 0.2
0
2016 2017 2018 2019 2020
Current Ratio
3.3.2 Liquidity ratio:
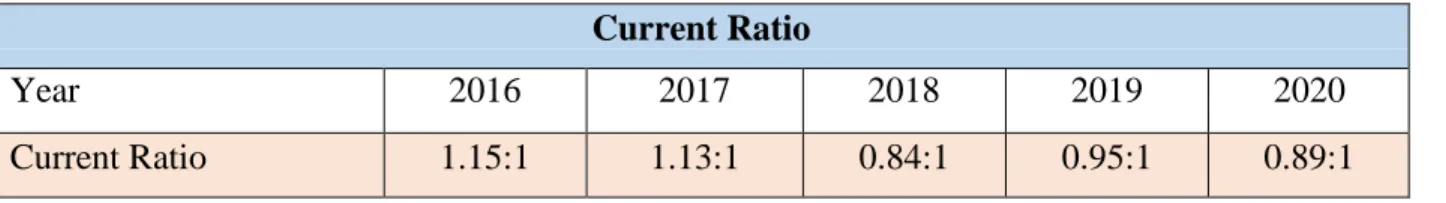
a. Current Ratio:
Current ratio indicates the ability of the bank to pay its current liabilities through its current assets. Current ratio shows the strength of the bank’s working capital. It informs analysts and investors whether the bank is maximizing its current assets on its balance sheet to satisfy its current debtors and other accounts payable or not.
Formula: Current Ratio = Current assets / Current liabilities
Current Ratio
Year 2016 2017 2018 2019 2020
Current Ratio 1.15:1 1.13:1 0.84:1 0.95:1 0.89:1
(Source JBL annual report) Graphical presentation
Fig: Current Ratio Interpretation:
Current ratio of Jamuna Bank Limited shows a decreasing trend which is a worrying sign for the bank. In 2016 the current ratio was at its highest 1.15:1 and in 2018 it was its lowest .84:1. In 2019 and 2020 the ratio increases but not much. Because of the downward trend the overall current ratio of Jamuna bank is not satisfactory.
21
Earning Assets to Total Assets Ratio
Earning Assets to Total Assets Ratios
b. Earning assets to total assets ratios:
Banks use the earning assets to total assets ratio method as a quick way to determine the percentage of the balance sheet that is working to generate income which is useful for long-term goals such as retirement planning.
Formula: Earning Assets to Total Assets Ratios = Average earning assets/ Average total assets
Earning Assets to Total Assets Ratios
Year 2016 2017 2018 2019 2020
Earning Assets to Total Assets Ratios
0.64 0.72 0.74 0.73 0.70
(Source JBL annual report) Graphical presentation
0.76 0.74 0.72 0.7 0.68 0.66 0.64 0.62 0.6 0.58
2016 2017 2018 2019 2020
Fig: Earning Assets to Total Assets Ratio Interpretation:
The analyzed data shows that, in 2018 the ratio of earning assets to total assets of JBL was at its highest at 0.74. Jamuna Bank performed more efficiently in 2018 and 2019 compared to other years. Higher investment on government and other shares and securities, general investments etc.
might be the factors of higher earnings assets. In 2020 however the ratio of earning assets to total assets of JBL was decreased to 0.70. In 2016 the ratio of earning assets to total assets was at its lowest at 0.64.
22
Current Deposit to Total Liabilities
89 88 87 86 85 84 83 82 81 80
2016 2017 2018 2019 2020
Current Deposit to Total Liabilities
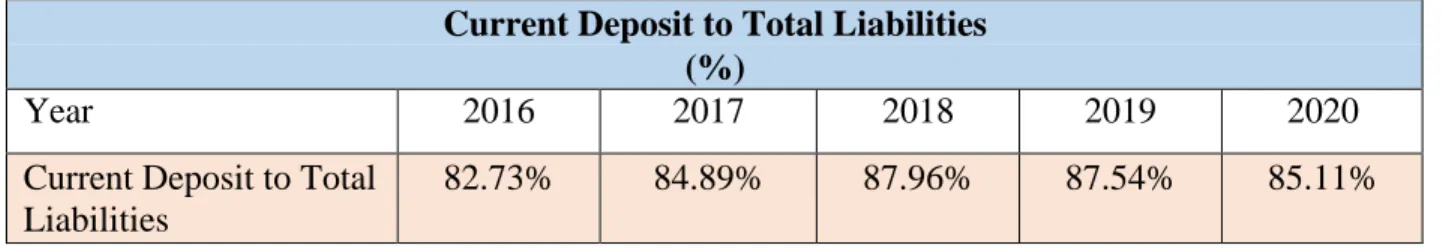
c. Current deposits to total liabilities:
This ratio is used to assess banks liquidity by comparing banks total loans to its total deposits for the same period. It is expressed as a percentage. If the ratio is too high, it means that the bank may not have enough liquidity to cover any unforeseen. Conversely, if the ratio is too low, the bank may not be earning as much as it could be. This ratio shows a bank’s ability to cover loan losses and withdrawals by its customers. Investors monitor this of banks to make sure there is adequate liquidity to cover loans in the event of an economic downturn resulting in loan defaults.
Formula: Current Deposit to Total Liabilities = Total loans / total deposits
Current Deposit to Total Liabilities (%)
Year 2016 2017 2018 2019 2020
Current Deposit to Total Liabilities
82.73% 84.89% 87.96% 87.54% 85.11%
(Source JBL annual report) Graphical presentation
Fig: Current Deposit to Total Liabilities Interpretation:
This graph shows that, the ratio of current deposits to total liabilities of JBL was increasing from 2017 to 2018. Among last 5 years in 2018 the ratio of current deposits to total liabilities was at its highest 87.96% and it indicated the highest efficiency of JBL. Comparatively lower total liabilities for lower bill payable, mudaraba term deposits etc. might be the reason behind the
23
Cash Ratio
0.7 0.6 0.5 0.4 0.3 0.2 0.1
0
2016 2017 2018 2019 2020
Cash Ratio
scenario of JBL performance in 2018. From 2019 to 2020 the ratio is decreasing and the JBL need to take a close look at this and find out the causes.
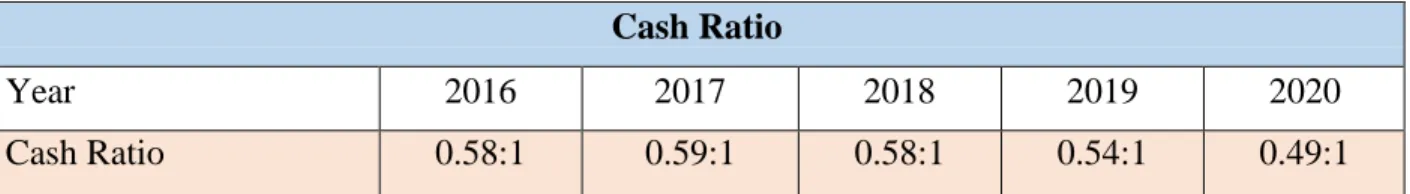
d. Cash ratio:
The cash ratio is a measurement of a bank's liquidity, specifically the ratio of a bank's total cash and cash equivalents to its current liabilities. The metric calculates a bank's ability to repay its short-term debt with cash or near-cash resources, such as easily marketable securities. This information is useful to creditors when they decide how much money, if any, they would be willing to loan a company.
Formula: Cash Ratio = Cash and cash equivalents / current liabilities
Cash Ratio
Year 2016 2017 2018 2019 2020
Cash Ratio 0.58:1 0.59:1 0.58:1 0.54:1 0.49:1
(Source JBL annual report) Graphical presentation
Fig: Cash Ratio
Interpretation: The graph shows that the cash ratio of JBL is declining which is not a good sign for the bank. In 2017 the cash ratio was at its highest and in 2020 it was its lowest. The bank needs to investigate the reason behind the decline and take appropriate action.
24
Debt to Assets Ratio
Debt to Assets Ratio
3.3.3 Debt ratios or leverage ratio
a. Debt to asset ratios:It indicates the percentage of debts a company has against its percentage of assets. It’s a percentage of a bank total asset that was financed by creditors. Generally, the higher percentage of debt to total assets ratio shows the greater financial leverage and the greater the risk.
Formula: Debt to Assets Ratio = Total debt / total assets
Debt to Assets Ratio
Year 2016 2017 2018 2019 2020
Debt to Assets Ratio 0.90 0.92 0.92 0.93 0.90
(Source JBL annual report) Graphical presentation
0.935 0.93 0.925 0.92 0.915 0.91 0.905 0.9 0.895 0.89 0.885
2016 2017 2018 2019 2020
Fig: Debt to Assets Ratio Interpretation:
Though there are slight fluctuations, Jamuna Bank has been able to maintain an average debt ratio of 0.91 from 2016 to 2020. Their total asset and their liabilities are increasing mostly in same range. But it has slightly decreased from 0.93 to 0.90 in 2020. This is good from a risk perspective, because higher leverage means higher earnings. Higher leverage also implies that the bank is exposed to higher risk. During good times when earnings are high, financial leverage is beneficial for a bank.
25
Debt to Equity Ratio
14 12 10 8 6 4 2
0
2016 2017 2018 2019 2020
Debt to Equity Ratio
b. Debt to equity ratios:
Debt to equity ratio is a major performance indicator for every bank. This ratio compares the amount of funds supplied by creditor and the amount of funds supplied by the owner. However, the debt to equity ratio depends on the industry because some industries use more debt financing than others. It is also a financial leverage ratio. It indicates the ability of shareholder equity to cover up all the obligations arising from debts.
Formula: Debt to Equity Ratio = Total debt / total shareholder equity.
Debt to Equity Ratio
Year 2016 2017 2018 2019 2020
Debt to Equity Ratio 9.63 11.77 11.45 13.16 9.00
(Source JBL annual report) Graphical presentation
Fig: Debt to Equity Ratio Interpretation:
There is an unstable trend in the debt to equity capital ratio of Jamuna Bank Ltd. from 2016 to 2020. The debt to equity capital ratio of Jamuna Bank has decreased from 13.16 in 2019 to 9.00 in 2020 over 5 years period of time. It means that their liability is increasing at a higher rate than their equity capital from 2016 to 2020.
26
Equity Multiplier
16 14 12 10 8 6 4 2 0
2016 2017 2018 2019 2020
Equity Multiplier
c. Equity multiplier:
This financial leverage ratio shows the banks percentage of assets which is financed by the shareholder. Conversely it also shows the level of debt financing which is used to maintain banks operations. If the bank is rely on only debt financing then it will have to raise more cash flows in order to pay their obligations. Higher equity multiplier means the bank is relying more on debt to finance its assets.
Formula: Equity Multiplier = Total asset / total shareholders’ Equity.
Equity Multiplier
Year 2016 2017 2018 2019 2020
Equity Multiplier 10.63 12.77 12.45 14.16 10.00
(Source JBL annual report) Graphical presentation
Fig: Equity Multiplier Interpretation:
The graph indicates that there is an upward trend in equity multiplier ratio. Although the ratio decreases from 14.16 in 2019 to 10.00 in 2020, overall the bank’s equity multiplier ratio has increased over the last 5 years period. This is not a good sign. Higher multiplier ratios are risky for the bank because it indicates that more assets were funding by debt to pay banks operations.
27
Capital Adequacy Ratio
18 16 14 12 10 8 6 4 2 0
2016 2017 2018 2019 2020
Capital Adequacy Ratio
d. Capital adequacy ratio:
The capital adequacy ratio (CAR) is a measurement of a bank's available capital expressed as a percentage of a bank's risk-weighted credit exposures. The capital adequacy ratio, also known as capital-to-risk weighted assets ratio (CRAR), is used to protect depositors and promote the stability and efficiency of financial systems around the world.
Formula: Capital Adequacy Ratio = (Tire-I Capital + Tire-II Capital)/Risk weighted assets Capital Adequacy Ratio (%)
Year 2016 2017 2018 2019 2020
Capital Adequacy Ratio 10.93% 11.86% 13.58% 14.25% 15.50%
(Source JBL annual report) Graphical presentation
Fig: Capital Adequacy Ratio Interpretation:
From our analysis we can see that there is an upward trend in capital adequacy ratio of jamuna Bank. The average capital adequacy ratio of JBL was above 13% over the last 5 years period.
The higher capital adequacy ratio is safe for the bank. So we can say that risk absorbing position of Jamuna Bank Limited was good.
28
Earnings Per Share
4 3.5 3 2.5 2 1.5 1 0.5 0
2016 2017 2018 2019 2020
Earnings Per Share
3.3.4 Market performance ratio
a. Earnings per share (EPS):EPS indicates the profitability of a company and market participants use it frequently to gauge the profitability of a company before buying its share.
Formula: EPS = (Net income-preferred dividend) / weighted average number of shares outstanding.
Earnings Per Share (EPS)
Year 2016 2017 2018 2019 2020
Earnings Per Share (EPS) 3.06 2.70 3.09 3.48 3.56
(Source JBL annual report) Graphical presentation
Fig: Earnings Per Share (EPS) Interpretation:
EPS represents the amount that is earned on behalf of each ordinary shares. EPS is closely observed by investors because it is an important indicator of business success. We found that EPS of JBL was 3.06 Taka in 2016 but in 2017 it was decreased to 2.70 after that the EPS is gradually increasing and reached at 3.56 Taka in 2020. This increasing trends in EPS is good sign for the Bank.
29
P/E Ratio
9 8 7 6 5 4 3 2 1 0
2016 2017 2018 2019 2020
P/E Ratio
b. Price-to-Earnings P/E ratio:
It is also known as price multiple. It is banks share price that earns form per share. It is used for valuing a bank to find out whether banks are overvalued or undervalued. The investors are expecting that higher P/E ratio brings higher earnings growth.
Formula: P/E Ratio =Market price per share of common stock/Earning per share.
P/E Ratio (Times)
Year 2016 2017 2018 2019 2020
P/E Ratio 5.11 8.16 5.69 5.31 5.27
(Source JBL annual report) Graphical presentation
Fig: P/E Ratio Interpretation:
Price earnings ratio measures the investors’ confidence toward the organization. Except in 2017 where the P/E ratio was at its highest 8.16 others years shows a declining trend in P/E ratio.
However the JBL maintain an average P/E ratio of 5.91 over the 5 years period which is good for the bank investors.
30
Chapter Five
Findings
30
4.1 Findings:
After analyzing the financial data of Jamuna bank limited for the period of 2016 to 2020, the following findings are noted down:
4.1.1 Findings regarding overall financial position of the bank:
In terms of operating income and operating profit 2019 was the best year for the Jamuna bank during the 5 years period of 2016 to 2020. Because the bank records its highest operating income and operating profit in that year which is 11,439.53 and 5,841.84 million taka respectively.
Profit before tax shows an increasing trend during 2016 to 2020. But in 2020 it has decreased by 8.99% than the previous year.
Net Profit after tax was highest in 2020 (2,670.71 million taka) among the 5 years period and it is also showing an increasing trend during that period.
In 2020 the deposits of the bank has decreased by 5.63% than the previous year. But the overall deposits has grown during the last 5 years.
Total Assets has decreased in 2020 by 0.57% than the previous year. However the overall total assets of the bank is increasing.
In 2020 the total liabilities of the bank has decreased by 3.71% than the previous year.
In terms of market price per share 2017 was the best year (22.00) among the 5 years period of 2016 to 2020. Overall market price per share of the bank is relatively stable.
Although in 2017 it was decreased by 13.45% than the previous year the overall investment of the bank increasing.
Dividends paid to the shareholders has fluctuated over the 5 years period. In 2017 it was at its highest 22.00% and in 2019 it was at its lowest 15.00%.
There is a growth in the number of employees and number of branches during the 5 years period of 2016 to 2020.
31
4.1.2 Findings specific to ratio analysis:
Return on assets (ROA) fluctuated over the 5 years period and they shows a downward trend.
Return on equity shows an upward trend which is good for the bank.
Current ratio and cash ratio both shows a downward trend.
Earnings per share (EPS) shows an upward trend while P/E ratio shows a downward trend.
32
Chapter six
Recommendations
&
Conclusion
32
4.2 Recommendations for JBL
From this study I understand and gain real world knowledge on banking industry. After finishing my study I want to put some suggestions according to my academic knowledge for the betterment and to improve the variables and conditions of the financial performance of Jamuna Bank Limited.
These suggestions are:
The bank authority should pay attention to their growing expenses. From 2016 to 2020 the total operating expense of the bank is growing every year. Hence, it is crucial to focus on the areas which are increasing the expenses for the bank.
Since JBL’s cash ratio has been decreasing and bank facing liquidity problem. In this setting, the management should take proper steps to manage the liquidity of the bank.
Return on assets is the pointer how bank utilize its assets to make returns. The bank needs to focus on the increment of ROA.
JBL need to put some special look on some ratios which fluctuates more.
The JBL management needs to take the necessary steps to increase the P/E ratio.
The bank’s Earnings per share (EPS) is increasing and the bank needs to maintain this in the future.
Jamuna Bank Limited need to introduce few new ideas on services so that customers can receive better service that may change their interest from other banks
The JBL should introduced various incentives in order to increase remittance.
The JBL management should take effective and efficient initiative in order to recover the default loans.
33
The bank should be very agile and dynamic when it comes to applying new technology in their banking system.
JBL is needed to reach the brand value to the customers for building up ideal relationship to create loyal customer
5.1 Conclusion
Jamuna Bank has been a successful private commercial bank in the banking industry of Bangladesh. It has started with a vision to be the most efficient financial intermediary in the country and it believes that the day is not far off when it will reach its desired goal. The bank has been practicing conservative banking over the years. Thus, it has adopted new technologies to make every area of the bank more transparent to the central management. It has cut down processes that took hours previously, now can be executed within minutes. Jamuna Bank is also continuously expanding its offerings and services to the clients. Again, its social causes programs create a strong image for the bank among the shareholders.
The bank has remained profitable since its inception. However, recently the banking sector continued to face challenges like swelling non-performing loans, excess liquidity, lower capital adequacy etc. These challenges has also affected the bank in some way or other eventually.
However JBL has a strong financial base and huge assets to meet up its liabilities which make this organization financially sound and solvent.
The banking sector is very dynamic and ever changing and always through new challenges. I believe Jamuna bank has all the capabilities to overcome those challenges. By introducing innovative ideas and new technology Jamuna bank is always trying to be the best. If this thing continues I hope that Jamuna Bank Limited will develop even more in the future.
34
References
Annual Report:
https://jamunabankbd.com/jb_uploads/files/files/AR_2016.pdf https://jamunabankbd.com/jb_uploads/files/files/A_R_2017.pdf https://jamunabankbd.com/jb_uploads/files/files/AR_2018_final.pdf
https://jamunabankbd.com/jb_uploads/files/files/Annual_Report_2019_f.pdf https://jamunabankbd.com/jb_uploads/files/files/Annual_Report_2020.pdf
Websites:
https://jamunabankbd.com/
https://www.bibm.org.bd/
https://www.wikipedia.org/
https://www.google.com/