EFFECT OF NITROGEN AND GIBBERELLIC ACID ON GROWTH AND YIELD OF TOMATO
MAHMUDA SULTANA
DEPARTMENT OFHORTICULTURE
SHER-E-BANGLA AGRICULTURAL UNIVERSITY DHAKA -1207
DECEMBER, 2013
EFFECT OF NITROGEN AND GIBBERELLIC ACID ON GROWTH AND YIELD OF TOMATO
BY
MAHMUDA SULTANA REG. NO. 07- 02505
A Thesis
Submitted to the Department of Horticulture, Sher-e-Bangla Agricultural University, Dhaka,
In partial fulfillment of the requirements for the degree
of
MASTER OF SCIENCE (MS) IN
HORTICULTURE
SEMESTER: JULY-DECEMBER, 2013 Approved by:
Prof. Md. Hasanuzzaman Akand Department of Horticulture Sher-e-Bangla Agricultural University
Supervisor
Prof. Dr. Md. Ismail Hossain Department of Horticulture Sher-e-Bangla Agricultural University
Co-supervisor
Prof. Dr.A.F.M. Jamal Uddin Chairman
Examination Committee
Ref:- Date:…………..
CERTIFICATE
This is to certify that thesis entitled, “EFFECT OF NITROGEN AND GIBBERELLIC ACID ON GROWTH AND YIELD OF TOMATO”
submitted to the Faculty of Agriculture, Sher-e-Bangla Agricultural University, Dhaka, in partial fulfillment of the requirements for the degree of MASTER OF SCIENCE in HORTICULTURE, embodies the result of a piece of bona fide research work carried out by MAHMUDA SULTANA, Reg. No. 07-2505 under my supervision and guidance. No part of the thesis has been submitted for any other degree or diploma in any institute.
I further certify that such help or source of information, as has been availed of during the course of this investigation has duly been acknowledged.
Dated: December, 2013 Place: Dhaka, Bangladesh
Department of Horticulture Sher-e Bangla Agricultural University
Dhaka-1207, Bangladesh
Prof. Md. Hasanuzzaman Akand Department of Horticulture Sher-e-Bangla Agricultural University
Supervisor
ACKNOWLEDGEMENTS
The author deems it a much privilege to her enormous sense of gratitude to the almighty Allah for there ever ending blessings for the successful completion of the research work.
The author wishes to express her profound sense of appreciation and heartiest gratitude to her Supervisor, Prof. Md. Hasanuzzaman Akand, Department of Horticulture, Sher-e-Bangla Agricultural University, Dhaka for his help, scholastic supervision, continuous encouragement and constructive suggestion throughout the period of research and for taking immense care in preparing this manuscript.
The author expresses her immense appreciation and gratitude to her Co-supervisor, Prof. Dr. Md. Ismail Hossain, Department of Horticulture, Sher-e-Bangla Agricultural University, Dhaka for his valuable advice and constructive criticism during the critic period of research work.
The author would like to extend her appreciation to all teachers and staffs, the Department of Horticulture, Sher-e-Bangla Agricultural University, Dhaka for their co-operation and encouragement during the study period.
The author feels proud to express her sincere appreciation and gratitude to all of her friends especially Tanvir Hasan, Al Imran, Lobna Yesmin, Mst. Marzia Begum and some younger sisters for their help and encouragement.
The author can never repay the debt of her heavenly grandfather, grandmother and beloved parents, uncle, aunty, sisters, brothers and well wishers for their inspiration, constant encouragement and sacrifice for her higher education.
The author expresses her immense gratefulness to all of them who assisted and inspired her to purse higher education and regret for her inability for not to mention every one by name.
Dated: December, 2013 The Author
Place: SAU, Dhaka
EFFECT OF NITROGEN AND GIBBERELLIC ACID ON GROWTH AND YIELD OF TOMATO
MAHMUDA SULTANA
ABSTRACT
A field experiment was conducted at the Horticultural Farm of Sher-e-Bangla Agricultural University, during the period from November 2012 to March 2013. Two factors experiment included four levels of nitrogen i.e. N0 : 0kg, N1 : 200 kg, N2 : 225 kg and N3 : 250 kg N/ha and three levels of GA3i.e. G0 : 0, G1 : 50 and G2 : 70 ppm respectively, was outlined in Randomized Complete Block Design(RCBD) with three replications. Application of nitrogen and GA3 influenced independently and in combination on growth and yield of tomato.
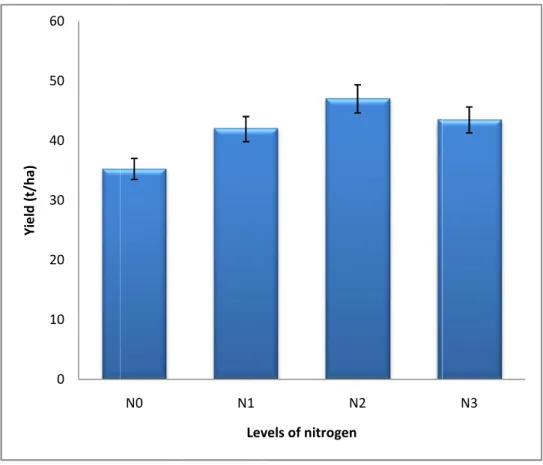
For nitrogen the highest yield (47.02 t/ha) was recorded from N2 and lowest (35.26 t/ha) was from N0. For GA3 the highest yield (46.09 t/ha) was recorded from G1, while the lowest (34.82 t/ha) was from G0. In case of combined effect, the highest yield (49.29 t/ha) was from N2G1, while lowest (35.02 t/ha) from N0G0. Economic analysis revealed that N2G1 gave maximum benefit cost ratio (2.21). So, it can be concluded that 225 kg N with 50 ppm GA3/ha is the best for growth and yield of tomato.
CONTENTS
SL NO. TITLE PAGE
ACKNOWLEDGEMENT i
ABSTRACT ii
CONTENTS iii-v
LIST OF TABLES vi
LIST OF FIGURES vii
LIST OF APPENDICES vii
LIST OF ACRONYMS viii-ix
1. INTRODUCTION 1-2
2. REVIEW OF LITERATURE 3-15
2.1 Effect of nitrogen on the growth and yield of tomato 4 2.2 Effect of GA3on the growth and yield of tomato 11
3. MATERIALS AND METHODS 16-25
3.1 Experimental site 16
3.2 Experimental period 16
3.3 Soil type 16
3.4 Weather 16
3.5 Materials used for experiment 17
3.6 Raising of seedling 17
3.7 Treatments 17
3.8 Experimental design and layout 18
SL NO. TITLE PAGE
3.9 Land Preparation 20
3.10 Application of manure and fertilizers 20
3.11 Preparation and application of GA3 21
3.12 Transplanting of seedlings 21
3.13 Gap filling 21
3.14 Intercultural operation 21
3.14.1 Irrigation and drainage 21
3.14.2 Staking 22
3.14.3 Weeding 22
3.14.4 Top dressing 22
3.14.5 Control of pest and disease 22
3.15 Harvesting 22
3.16 Collection of data 23
3.16.1 Plant height 23
3.16.2 Number of leaves per plant 23
3.16.3 Number of flower clusters per plant 23
3.16.4 Number of flowers per cluster 23
3.16.5 Number of fruit clusters per plant 23
3.16.6 Fruit Diameter 24
3.16.7 Fruit yield per plant 24
3.16.8 Fruit yield per hectare 24
3.16.9 % Dry weight of head per plant 25
3.16.10 % Dry matter content in fruit 25
3.17 Analysis of data 25
SL NO. TITLE PAGE
3.18 Economic analysis 25
SL NO. TITLE PAGE
4. RESULTS AND DISCUSSION 26-46
4.1 Plant height 26
4.2 Number of leaves 30
4.3 Number of flower clusters per plant 34
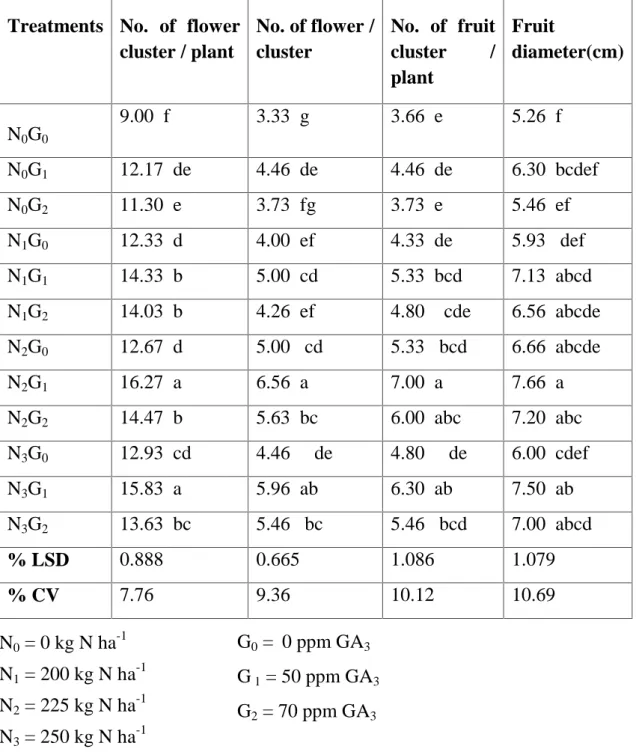
4.4 Number of flowers per cluster 34
4.5 Number of fruit clusters per plant 35
4.6 Fruit diameter 35
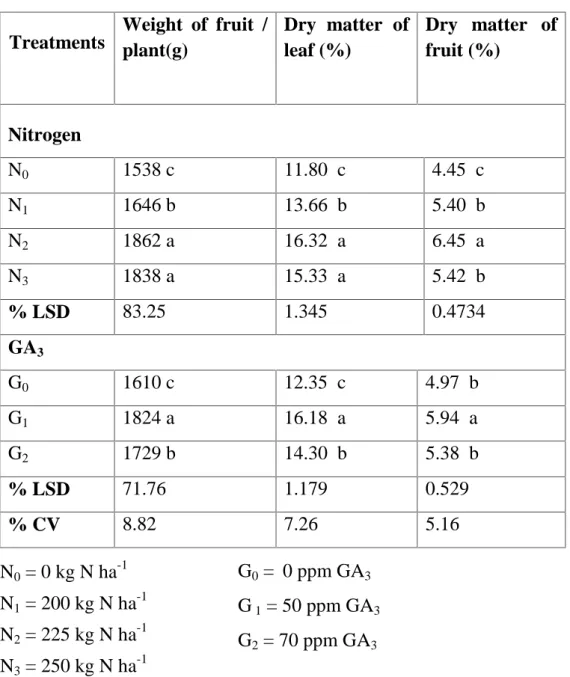
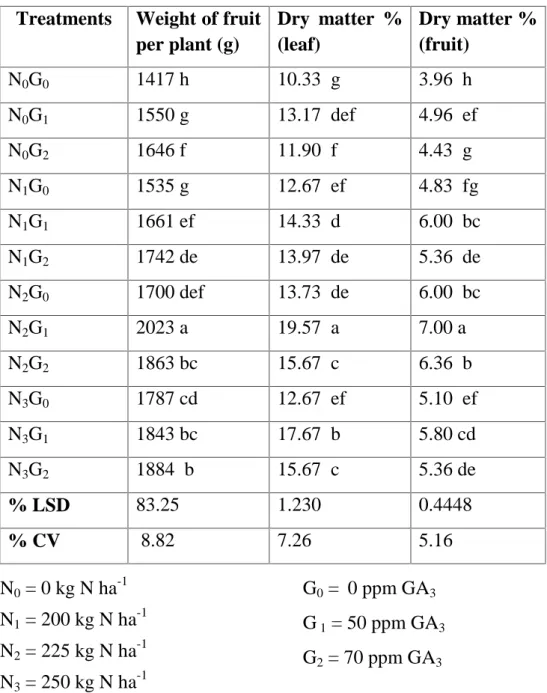
4.7 Weight of fruits per plant 39
4.8 Dry matter content in leaves 39
4.9 Dry matter content in fruits 40
4.10 Fruit yield per hectare 43
4.11 Economic analysis 46
4.11.1 Gross return 46
4.11.2 Net return 46
4.11.3 Benefit cost ratio (BCR) 46
5. SUMMARY AND CONCLUSION 48-50
REFERENCES 51-59
APPENDICES 60-66
LIST OF TABLES
SL NO. TITLE PAGE
1 Fertilizer and manure applied for the experimental field preparation. Manure and fertilizers were used as recommended by BARI (2005)
20
2 Effect of nitrogen and GA3on the plant height of tomato 28 3 Combined effect of nitrogen and GA3 on the plant height
of tomato
29 4 Effect of nitrogen and GA3 on the number of leaves of
tomato
32 5 Combined effect of nitrogen and GA3 on the number of
leaves of tomato
33
6 Effect of nitrogen and GA3 on yield contributing characters of tomato
37 7 Combined effect of nitrogen and GA3 on yield
contributing characters of tomato
38 8 Effect of nitrogen and GA3 on yield contributing
characters and yield of tomato
41
9 Combined effect of nitrogen and GA3 on yield contributing characters and yield of tomato
42
10 Combined effect of nitrogen and GA3 on total net return contributing characters and yield of tomato
48
LIST OF FIGURES
SL NO. TITLE PAGES
1 Layout of the experimental plot 19
2 Effect of nitrogen on the yield of tomato 43
3 Effect of GA3on the yield of tomato 44
4 Combined effect of nitrogen and GA3 on the yield of tomato
45
LIST OF APPENDICES
SL NO. TITLE PAGES
I Experimental location on the map of agro-ecological zones of Bangladesh
60
II Records of meteorological information (monthly) during the period from October 2012 to March 2013 and morphological characteristics of soil of the experimental plot
61
III Analysis of variance of different Character of tomato 62-64 IV Production cost of tomato per hectare land 65-66
LIST OF ACRONYMS
ABBREVIATIONS ELABORATIONS
% Percent
@ At the rate
AEZ Agro-Ecological Zone
Agric. Agriculture
Agril. Agricultural
Agron. Agronomy
ANOVA Analysis of variance
BARI Bangladesh Agricultural Research Institute BBS Bangladesh Bureau of Statistics
BD Bangladesh
BINA Bangladesh Institute of Nuclear Agriculture
CEC Cation Exchange Capacity
cm Centi-meter
CV% Percentage of coefficient of variation
df Degrees of Freedom
DMRT Duncan’s Multiple Range Test
EC Emulsifiable concentration
et al. and others
etc. Etcetera
FAO Food and Agriculture Organization of United Nations
g gram
hr. Hours
j. Journal
Kg/ha kiligrams per hectare
kg kilogram
m Meter
m2 square meter
MoA Ministry of Agriculture
MSE Mean square of the error
No. Number
ppm parts per million
RCBD Randomized Complete Block Design
Rep. replication
Res. research
SAU Sher-e-Bangla Agricultural University
Sc. science
SE Standard Error
Univ. University
var. variety
CHAPTER I
INTRODUCTION
Tomato (Lycopersicon esculentum Mill.) belonging to the family Solanaceae, is one of the most important vegetable crop grown in Bangladesh. It was originated in tropical America, particularly in Peru, Ecuador and Bolivia. It is popular for its taste, nutritional status and various uses. Tomato is cultivated all over the country due to its adaptability to wide range of soil and climate (Ahmad, 1976). The crop is adapted to a wide variety of climates ranging from the tropics to a few degree of the Arctic Circle. The present leading tomato producing countries of the world are China, United States of America, India, Egypt, Turkey, Iran, Italy, Mexico, Brazil and Indonesia (FAO. 2002).
In Bangladesh tomato has great demand throughout the year but its production is mainly concentrated during the winter season. Recent statistics showed that tomato was grown in 17.790 hectares of land and the total production was approximately 202.000 metric tons in Bangladesh during the year 2004-2005.
Thus the Average yield of tomato was 11.35 tons/ha (BBS. 2005). While it was 69.41 t/ha in USA, 21.27 t/ha in India , 31.13 t/ha in China and 65.45 t/ha in Japan (FAO. 2004).
The popularity of tomato and different products produced from tomato processing is increasing day by day. It is a nutritious and delicious vegetable used in salads, soups and processed into stable products like ketchup, sauce, marmalade, chutney and juice. They are extensively used in the canning industry for canning.
Nutritive value of the fruit is an important aspect of quality tomato and public demand. Food value of tomato is very rich because of higher contents of vitamins A, B and C including calcium and carotene (Bose and Som, 1990).
Tomato adds flavor to the foods and it is also rich in medicinal value.
The lower yield of tomato in Bangladesh, however, is not an incidence of the low yielding potentiality of this crop but of the fact that the lower yield may be
attributed to a number of reasons viz. unavailability of quality seeds of improved varieties, fertilizer management, disease infestation and improper moisture management. Among them fertilizer management is a vital factor that influences the growth and yield of tomato. Among the different nutrients that were required for tomato cultivation nitrogen is most important nutrients.
On the other hand soils of Bangladesh have been deficient in nitrogen fertilizer.
Tomato requires large quantity of readily available nitrogen nutrients (Gupta and Shukla, 1977). In indeterminate type of tomato, vegetative and reproductive stages over lap and the plants need nitrogen up to fruit ripening.
Again GA3is also an important factor for tomato good yield. The application of Gibberellic acid had significantly increased the number of fruits plan than the untreated controls. Tomar and Ramgiry, (1997); and Adlakha and Verma, (1995); reported that GA3 (55 ppm) sprayed on flower cluster resulted is an increase in fruit weight. To increase the yield and to avoid flower and fruit dropping, application of GA3 at right concentration and right time is important.
Gibberellic acid has great effects on plant physiological systems including fruit setting, leaf expansion, germination, breaking dormancy, increasing fruit size, improving fruit quality and in many other aspects of plant growth and thereby increased crop production.
Research on the effect of nitrogen in association with application of GA3 on the growth and yield of tomato under Bangladesh conditions is limited. Under the circumstances, the present piece of research was undertaken with the following objectives:
i) To find out the effect of nitrogen on the growth and yield of tomato, ii) To determine the effect of GA3 on the growth and yield of tomato
and
iii) To find out the suitable combination of nitrogen and GA3 for ensuring the maximum growth and yield of tomato.
CHAPTER II
REVIEW OF LITERATURE
Tomato (Lycopersicum esculentum Mill.) is one of the most important vegetable crops in Bangladesh and received much attention to the researcher throughout the world. Plant growth regulators arc the substances, which affect the growth of plants quite miraculously. GA3 is one of them. Application of this growth regulator has different modifying influences on growth, yield and yield contributing characters of tomato as well as other vegetables. Some of the available research works in this connection have been reviewed with the hope that these may contribute useful information to the present study. In these chapter morphological characters, growth, yield and biochemical parameters have been reviewed as follows:
2.1 Effect of nitrogen on the growth and yield of tomato
A field experiment was conducted at Bhubaneswar, India by Sahoo et al.
(2002) to study the effects of nitrogen (50, 100, 150 or 200 kg N/ha) and potassium (75 or 150 kg K/ha) on the growth and yield of tomato var. Utkal kumari during the rabi season of 1999-2000.The wide range of variation was marked by the application of nitrogen with respect to growth, development and yield of tomato fruit. The fruit yield increased with each increase in the levels of nitrogen from 50 to 150 kg but further increased of nitrogen beyond 150 kg/ha reduced the yield considerably. They also found that the highest value relating to yield attributing characters like number of fruits per plant and single fruit weight were maximum when potassium was applied at the rate of 75 kg/ha. However, the combination of 150 kg N/ha along with 75 kg K/ha gave best result with respect to tomato from yield and other yield attributing characters.
Sainju et al. (2001) conducted an experiment at Agricultural Research Station, Fort Valley State University, Fort Valley to evaluated hairy vetch residue as nitrogen fertilizer for tomato in soilless medium. The ability of hairy vetch
(Vicia villosa Roth) residue (l00 g/plant) to supply N and to increase yields of tomato (Lycopersicon esculentum) was compared with that of N fertilization (0, 4.1, and 8.2 g N/plant) in a medium containing a mixture of 3 per liter: 1 vermiculite in a greenhouse. Leaf dry weight, leaf and stem N uptake, total dry weight and N uptake of tomato, and Nl4 and inorganic N concentrations in the medium at transplanting were significantly greater with than without residue.
Nitrogen fertilization increased fruit number, fresh and dry yields and N uptake, stem, leaf, and root dry weights and N uptake, root length, and total dry weight and N uptake. The residue was as effective in increasing fresh fruit yield, total dry weight, and N uptake as was 4.4 to 7.9 g/plant of N fertilizer.
Tomato yield and N uptake per unit amount of N supplied was greater for the residue than for N fertilization.
A study was conducted by Ceylan et al. (2001) at Odemis, Izmir, Turkey to assess the effect of ammonium nitrate and urea fertilizers at 0, 12, 24, 36 kg N/ha on nitrogen uptake and accumulation in tomato plants. The total nitrogen, N02-N and N03-N contents of leaves and fruits were determined. On the first and second harvest dates, the highest N03-N and N02-N amounts in tomato leaves and fruits were obtained upon treatment with 36 kg N/ha. Ammonium nitrate application increased nitrate and nitrite accumulation compared to urea application. The highest yield was recorded upon treatment with 24 kg N/ha.
Two field experiments were conducted in Egypt by Awad et al. (2001) to study the effect of intercropping parsley and demsisa with tomato under 4 rates of N fertilizer (100, 120, 140 and 160 kg N/fed). The results showed that increasing N fertilizer rate enhanced total yield and net assimilation rate (NAR) of both mono and mixed crops, earliness index of tomato and NPK uptake of tomato in NAR. Total yield, earliness index and N uptake. The best values were obtained by pure stand planting at the highest N rate (160 kg N/fed), whereas the best P and K uptake were attained at 140 and 120 kg N/fed, respectively. The highest value of N supplementation index (NSI) for tomato was obtained at 100 kg N/fed, whereas the highest values of phosphorus supplementation index (PSI)
and potassium supplementation index (KSI) were recorded by plants which received 160 kg N/fed.
A field experiment was conducted by Manoj and Raghav (1998) to evaluating two F1 hybrids of tomato, three plant spacing (75 cm x 50 cm, 75 cm x 75 cm and 75 cm x 100 cm) and four levels of nitrogen (0, 75, 150, 225 and 300 kg/ha) was conducted during 1995-96 and 1996-97 at the Research Station, Nagina of G.B. Pant University of Agriculture and Technology, Pantnagar (Uttar Pradesh, India) on sandy loam soil. Among the various levels of nitrogen, 300 kg/ha was found to be best in improving the growth and yield.
High ammonium nitrogen (NH4N) concentration in solution may adversely affect greenhouse tomato yield, but it has been reported that small NH4N fractions improve yield and may increase vegetative growth and nutrient element uptake. 1 he objective of this study was conducted by Sandoval et al.
(1999) to determine the tomato yield response to 0 : 100, 10 : 90, 20 : 80, 30 : 70, and 40 : 60 NH4N : N03Nratios supplied at the vegetative, vegetative plus flowering, flowering plus fruiting, and fruiting stages, and over the entire plant life cycle. Neither the length of NH4N supply nor the NH4N concentration in solution affected tomato yield. Plant height was not affected by NH4N concentration in either the winter or spring experiments, and neither was fruit firmness measured for fruit at the mature green stage. Fresh and dry weights were unaffected by NH4N concentration.
Bot et al. (2001) carried out an experiment to evaluate the response of adult tomato plants growing in rock wool in a greenhouse to N withdrawal from the nutrient solution was studied over a 6-week period during fruit production.
The major effect of N withdrawal included the impairment of growth of fast growing organs. Fruit growth was impaired, leading to a reduction in yield. The growth of young leaves was also inhibited. The stores of nitrate N were depleted after removal of N in the solution, but it took 45 days for the plants to metabolize completely their nitrate reserves.
Tomato CV. Pusa Gaurav was treated with N at 0, 40, 80 and 120 kg/ha and K at 0, 30 and 60 kg/ha in a field experiment conducted in Madhya Pradesh, India during rabi 1992-93 and 1993-94 by Gupta and Sengar (2000). N application resulted in increases in plant height, number of fruits per plant, fruit weight and fresh yield. Increasing N rate produced a corresponding increase in yield and yield components, except total soluble solids (TSS) content. K increased vegetative growth, yield, and TSS content.
An experiment was conducted in Uttar Pradesh, India, by Singh et al. (2000) to determine the suitable rate and application of N fertilizers for obtaining optimum growth and yield of tomato cv. Pusa Hybrid-2. N was applied at 40 kg/ha basal, 40 kg/ha top dressing, 80 kg/ha in 2 splits (40 kg/ha basal + 40 kg/ha top dressing) 50 kg/ha in 2 splits (40 kg/ha basal + 10 kg/ha foliar), 60 kg/ha (40 kg/ha basal + 210 kg/ha foliar), 70 kg/ha (40 kg/ha basal + 30 kg/ha foliar) and 80 kg/ha (40 kg/ha basal + 20 kg/ha top dressing + 20 kg/ha foliar).
N at 80 kg/ha applied in 3 splits produced the highest yield and biomass.
Increasing N rates resulted in increasing biomass and yield.
Experiment was conducted by Default et al. (2000) in Charleston, South Carolina, to determine (1) if supplemental nitrogen (N) at 60 or 120 kg/ha following winter cover crops of wheat. Tomato (Lycopersicon esculentum Mill.) and snap bean(Phaseolus vulgaris L.) grown in rotation; and (2) the distribution and retention of soil nitrates in the soil profile as affected by N fertilization and cover cropping, Total marketable tomato yield increased as fertilizer N increased to 60 kg/ha in two out of four years and with 120 kg/ha in one out of four years. In all cover crop or fallow plots, as fertilizer N application levels increased, the soil nitrates also increased.
Sainju et al. (2000) conducted an experiment on cover crops can influence soil properties and crop yield they examined the influence of legume and N fertilizer application (0, 90, and 180 kg N/ha) on the short and long-term effects on soil C and N and tomato yield and N uptake. N uptake similar to that produced by 90 and 180 kg N /ha. Nitrogen fertilizer application increased
PNM and inorganic N after split application and tomato yield and N uptake but decreased organic C and N and PCM.
Hoffland et al. (2000) conducted an experiment to study how nitrogen availability affects within plant allocation to growth and secondary metabolites.
Tomato plants were grown at six levels of 'nitrogen availability. When nitrogen availability increased, plant relative growth rate increased, but tissue carbon/nitrogen ratio in the second oldest true leaf and allocation to large glandular trichomes as well as to the defense compounds rutin, chlorogenic acid decreased but leaf protein concentration increased.
This study was conducted by Chang et al. (2000) to investigate the effect of nitrogen supply by NH4N deposit fertilizer on plant growth and nitrogen uptake of tomatoes. NH4 deposit fertilizer was applied using the "CULTAN"
(Controlled Uptake Long Term Ammonium Nutrition) method. It was prepared by mixing one-third ammonium sulfate and two-thirds urea as nitrogen sources and by combining gypsum as a binder and loamy soil and compost as diffusion regulators in the beaker. In the first experiment, the application of NH4N, deposit fertilizer with 7.5 g gypsum as a binder resulted in increased tomato fruit yield and nitrogen uptake efficiency compared to control. In the second experiment, the application of NH4N deposit fertilizer with loamy soil and compost as a diffusion regulator and adjusted C/N ratio to 16 also resulted in increased nitrogen uptake of fruits.
There are few growth studies evaluating within-season effects of N on vegetative growth and N accumulation of tomato conducted by Scholberg (2000). Growth analysis of field grown tomato for a number of Florida (USA) locations and management systems is presented here. Severe N stress resulted in fewer and smaller, but thicker, leaves. With increasing N, average leaf area index increased from 0.75 to 3.0, but radiation use efficiency (RUE) typically increased less than 30%. Lower RUE under N limited conditions reflected a decrease in N concentration of the most recently matured leaves from 40 mg/g to as little as 15 mg/g. Over the life of well- fertilized crops. Leaf N
concentrations dropped from 55 to 65 mg got during initial growth to 20 to 35 mg/g at final harvest. Corresponding N concentrations for fruit and for stems were 30 to 35 mg g-I and 15 to 25 mg/g. Severe N stress affected leaf and stem N concentrations most drastically, whereas N in fruits was less variable.
Rhoads et al. (1999) carried out an experiment to evaluate the influence of N rates and ground cover following tomato on soil nitrate-N movement was monitored in spring and fall [autumn] crops grown at the Florida A&M University, Florida, USA. Nitrogen rates varied from 0 to 360 lb/acre in the spring crop and from 0 to 600 lb/acre in fall tomato. Yield ranged from 1900 to 2600 boxes/acre in spring tomato, and from 1300 to 2700 boxes/acre in fall tomato. Fertilizer N rates above, 80 lb/acre were excessive, as shown by yield and residual soil nitrate-N levels. Residual soil nitrate-N was proportional to N application rate. Soil nitrate-N concentration following harvest was highest in the 1 to 3 ft depth range for spring tomato and the 2 to 4 ft depth range for fall tomato.
Hoffland et al. (1999) conducted an experiment on tomato plants with varying N availability were grown by adding N daily in exponentially increasing amounts to a nutrient solution at different rates. Leaves of plants grown at low N availability had a high leaf C : N ratio (21 g/g). The level of soluble carbohydrates correlated positively with susceptibility independent of the growth method. It is therefore suggested that the effect of N availability on susceptibility can be explained by variation in levels of soluble carbohydrates which hence may play a role in the infection process.
The effects of low and high water vapor deficit regimes and electrical conductivities of 3.8 or 4.8 ms/cm on the growth and N uptake of 7-month-old tomatoes in NFT were investigated for 3 months by Bellert et al. (1998).
Growth and N uptake were not modified by the treatments. N accumulated in the aerial biomass in proportion to the dry matter. Total N concentration of the foliage was relatively constant and richer than that of vascular organs and
fruits. A model is proposed to link total N concentration to dry matter accumulation.
In field trials on a red ferrallitic soil in northern Havana in 1994-95, tomato cv.
Campbel1-28 plants were fertilized with 0, 60, 120, 180 or 240 kg N/ha, starting 38 days after sowing was conducted by Adjanohoun et al. (1996).
Although increasing rates of applied N had no effect on average fruit weight, they significantly increased fruit numbers although application of 240 kg N/ha was excessive and significantly reduced yield compared with 120 or 180 kg N/ha (the highest yield, obtained with 180 kg N/ha, was 38 t/ha), A mathematical expression describing the curve of yield response is presented, and from it the optimum application rate was determined to be 158 kg N/ha, giving a fruit yield of 38.9 t/ha,
Hohjo et al. (1995) The tomato cv. Momotaro was grown using the nutrient film technique (NFT) in 1/2- and 3/4- to full-strength Enshi shoho balanced feed. In the first experiment, nutrient solutions were adjusted to contain N03N : NH4N ratios of 10:0, 9:1 and 8:2. Shoot and root FW were increased by an increasing proportion of NH4N with both strengths of solution, whereas Ca and Mg uptake were decreased by an increasing proportion of NH4N only with the higher solution strength. Total yield was reduced by increasing the proportion of NH4N, particularly with the higher strength of solution, a combination that also caused a marked increase in the incidence of blossom-end rot (BER). In the second experiment, N03N : NH4N ratios of 10:0 and 8:2 and Ca concentrations of 2, 4 and 6 meq/litre were used. The higher proportion of NH4N significantly increased shoot and root FW, incidence of BER and leaf contents of N, P and K, whilst decreasing the leaf content of Ca. Increasing the Ca content of the medium caused an increase in early yield and leaf Ca content, and a decrease in BER and leaf Mg content. The combination of 8: 2 N03N : NH4N and the lowest Ca concentration reduced total yield and leaf Ca content and significantly increased BER.
Trpevski et al. (1992) carried out in trials with 3 N was applied at 0, 40, 80 or 120 kg/ha to soil manure with 40 t FYM/ha in early spring. The 2 higher N rates increased the yield of San Pjer but reduced the yield of the other 2 cultivars. The effects of treatments on fruit N, dry matter, organic acid and vitamin C contents were generally not significant.
An experiment were conducted by Kooner and Randhawa (1990) at Punjab Agricultural University, Ludhiana to study the interaction of rates and sources of N with cultivars on the yield and processing quality of tomatoes in winter and spring seasons. Four rates of N (50, 100, 150 and 200 kg/ha) were applied as 2 sources, calcium ammonium nitrate (CAN) and urea, in a randomized, split plot design. PC produced significantly higher yields (222.7 kg/ha) than PK (208.9 kg/ha) in the spring planting while in the winter planting OS (163.9 kg/ha) and CS (113.9 kg/ha) were the best. Yields increased linearly with increasing N rate up to 150 kg/ha and CAN was the best source of N. TSS, juice percentage, ascorbic acid content and titratable acidity increased with increasing N up to 150 kg/ha.
In a study on the effect of nitrogen fertilization and plant intensification, Midan et al. (1985) observed that increasing nitrogen rates linearly increased the number of fruits per plant. However, medium and higher nitrogen rates gave best total yields. With different nitrogen rates, three times of application improved fruit per plant weight and total yield. Patil and Bojappa (1984) conducted an experiment to study the effects of cultivars and graded levels of nitrogen and phosphorus on certain quality attributes of tomato. The experiment consisted of the cultivars Pusa Ruby, Sious and Sweet-72. The plant received nitrogen at 70, 110 and 150 kg/ha and phosphorous (P) at 44 or 61.6 kg/ha with basal dressing of potassium (K) at 49.8 kglha and FYM at 25 t/ha. The highest fruit content of total sugars and next highest dry matter content were in sweet-72 while juice percentage was highest in pusa Ruby.
Rising nitrogen rates increased fruit total increased fruit total sugars and juice
percentage but decreased the dry matter content. Phosphorous had no appreciable effect as any of the indices studied.
Belichki (1984) reported that nitrogen was the most important nutrient. Flower and fruit numbers per plant were increased by nitrogen up to 240 kg/ha and fruit size was greatest 120 kg/ha. Staneve (1983) conducted an experiment to investigate the effect of nitrogen supply on photosynthesis, leaf area and total dry matter in tomato and found that photosynthesis was inhabited by N deficiency. Leaf development and dry matter accumulation were greatest at 10meq/L N and declined at higher concentrations.
2.2 Effect of GA3on the growth and yield of tomato
Shittu and Adeleke (1999) investigated the effects of foliar application of GA3 (0, 10, 250 or 500 ppm) on growth and development of tomatoes cv, 158-3 grown on pots. Plant height and number of leaves were significantly enhanced by GA3 treatment. Plants treated With GA3 with 250 ppm were the tallest plant the highest number of leaves.
Tomar and Ramgiry (1997) studied that tomato plant treated with GA3 showed significantly greater number of branches plant-1than untreated controls.
Gabal et al. (1990) found that 100 ppm of GA3 was more effective treatment in increasing leaf number plant-1compared to control.
Sanyal et al.(1995) studied that the effects of plant growth regulators (IAA or NAA at 15, 25 or 50 ppm or GA3 at 50, 75 or 100 ppm) and methods of plant growth regulator application on the quality of tomato fruits. Plant growth regulators had profound effects on fruit length, weight and sugar : acid ratio.
The effects of presoaking seeds and foliar application of plant growth regulators were more profound than presoaking alone.
Hathout et al.(1993) found that application of 10 ppm IAA as foliar sprays or to the growing media of tomato plants had a stimulatory effect on plant growth, development and fruit which was accompanied by increases in endogenous auxin, gibberellins and cytokinin contents. However, IAA at 80 ppm had an
inhibitory effect on plant growth and development, which was accompanied by increase in the level and activity of indigenous inhibitors and by low levels of auxms, cytokines and gibberellins.
EI- Habbasha et al.(1999) carried out a field experiment with tomato cv. castel rock over two growing seasons (1993-94). The effects of GA3 and 4-CPA on fruit yield and quality were investigated. Many of the treatments significantly increased fruit set percentage and total fruit yield, but also the percentages of puffy and parthenocarpic fruits compared to the controls.
Gulnaz et al.(1999) reported that seeds of wheat treated with to 10 ppm of GA3 resulted in 36-43% increase in dry weight at 13.11 dSm-1. Gurdev and Saxena (1991) observed that the growth regulators (GA3 at 10-5M) increased total dry matter. Application of 10-5 M GA3 on mustard at 40 or 60 days after sowing significantly increased total dry matter (Khan et al. 1998).
Total dry matter of a crop is the output of net photosynthesis Patel and Saxena (1994) reported that presoaking of seed of gram in varying concentrations of GA3showed the best results on dry weights. Application of GA3 at 50 and 100 ppm in french bean increased leaf number over control (Gabal et al. 1990). The increased leaf number could intercept most of the incident radiation and result in higher dry matter production in faba bean (Takano et. al (1995).
Gain in dry matter per unit assimilatory area per unit time is the NAR. It was established that NAR become higher during vegetative stage and then decline rapidly as season progressed (Kollar et al., 1970) possibly due to mutual leaf shading and increase of old leaves which could have lower photosynthetic efficiency (Pandey and Singh. 1978). The NAR was positively correlated with CGR (Majumder et al., 1980).
Relative growth rate is the increase in plant weight per unit plant weight per unit of time represents the efficiency of the plant as a producer of new material.
i.e. efficiency index of dry weight production (Hunt, 1978). It was positively correlated with biomass production in field pea (Pandy et al, 1983).
The rate of increase of dry matter per unit time per unit land area is the CGR.
CGR increased with LAI (Goldshworthy, 1984). Crop growth rate is positively correlated with LAI (Khan, 1981) and net assimilation rate (Bhardwaj et. al.
1987).
Leaf area index measures leafiness and photosynthetic surface area of a crop and it depends on the leaf growth number of leaf, plant density and leaf senescence (Khan, 1981).
Lilov and Donchev (1984) observed that by the application of GA3 at 20, 40 or 100 mg/L the yields were reduced compared with the non-treated control.
Leonard et al. (1983) reported that inflorescence development in tomato plants grown under low light regimes was promoted by GA3 application directly on the inflorescence.
Onofegharn (1981) carried out an experiment with tomato and sprayed GA3 at 25- 1000 ppm. He observed that GA3 promoted flower primordia production and the number of primordia produced or the panern of primordia production over time.
Saleh and Abdul (1980) performed an experiment with GA3 (25 or 50 ppm) applied 3 times in June or early July. They reponed that GA3 stimulated plant growth. The substance reduced the total number of flowers plant -1 but increased the total yield compared with the control. GA3 also improved fruit quality.
Chern et al. (1983) presented that one month old transplanted tomato plants were sprayed with 1, 10 or 100 ppm GA3 and observed that GA3 at 100 ppm increased leaf area, plant height and stem fresh and dry weight but 10 ppm inhibited growth.
Wu et al. (1983) sprayed one-month old transplanted tomato plants with GA3at 1, 10 or 100 ppm and reported that GA3 100 ppm increased plant height and leaf area.
Briant (1974) sprayed GA3on the growth of leaves of young tomato plants and observed that total leaf weight and area were increased by GA3.
Bora and Selman (1969) working with tomato demonstrated that four foliar sprays of GA3(0, 5, 50 or 500 ppm) applied at 7, 17, 22, 27 or 370 increased the leaf area, weight and height of tomato plants. The best treatment was 5 ppm GA3at 220C.
Jansen (1970) reported that tomato plants treated with GA3 neither increased the yield nor accelerated fruit ripening. He also mentioned that increasing concentration of GA3 reduced both the number and size of fruits.
Mehta and Malhi (1970) reported that GA3 application at 25 ppm improved the yield of tomato. GA3produced earlier fruit setting and maturity.
Hossain (1974) investigated the effect of GA3 along with 4-CPA on the production of tomato. He found that GA3 applied with 50, 100 and 200 ppm produced an increased fruit set. However, GA3 treatment induced small size fruit production A gradual increase in the yield plant -1 was obtained with higher concentration of GA3.
Sawhney and Greyson (1972) reported that application of GA3 non flowering plants of tomato induced multilocular, multicarpellary ovaries which were larger at anthesis than control upon pollination produced fruits which were significantly larger with higher fresh weight.
Adlakha and Verma (1964) observed that when the first four clusters of tomato plants were sprayed three times at unspecified intervals with GA3at 50 and 100 ppm, the fruit setting increased by 5% with higher concentration.
Kaushik et al. (1974) in an experiment applied GA3 at 1, 10 or 100 mg/L on tomato plants at two leaf stage and then at weekly interval until 5 leaf stage.
They reported that GA3 increased the number and weight of fruits plant-1at the highest concentration.
Chowdhury and Faruque (1972) reported that the percentage of seedless fruit increased with the increase in GA3 concentration from 50 ppm to 100 ppm.
However the fruit weight was found to decrease by GA3.
Gustafson (1960) sprayed tomato flower and flower buds of the first three clusters with GA3 (35 and 70 ppm) and found that GA3 improved fruit set but reduced fruit weight of tomato.
Rapport (1960) noted that GA3 had no significant effect on fruit weight and size either at cool (110C) or warm (23°C) night temperatures; but it strikingly reduced fruit size at an optimum temperature (170C).
CHAPTER III
MATERIALS AND METHODS
The details of the materials and methods of this research work were described in this chapter as well as on experimental materials, site, climate and weather, experimental design, layout, materials used for experiment, raising of seedling, treatments, land preparation, manuring and fertilizing, transplantation of seedlings, intercultural operations, harvesting, collection of data and statistical analysis which are given below:
3.1 Experimental site
The experiment was conducted at the Horticulture farm of Sher-e-Bangla Agricultural University, Dhaka. The location of the site was 23o74/ N latitude and 90o 35/longitude with an elevation of 8.2 meter from sea level.
3.2 Experimental period
The experiment was carried out during the Rabi season from November 2012 to March 2013. Seedlings were sown on 05 November, 2012 and were harvested upto 25 March, 2013.
3.3 Soil type
The experimental site was situated in the subtropical zone. The soil of the experimental site lies in agro-ecological regions of “Madhupur Tract” (AEZ NO. 28). Its top soil is clay loam in texture and olive grey with common fine to medium distinct dark yellowish brown mottles. The pH 4.47 to 5.63 and organic carbon contents is 0.82 (Appendix-I).
3.4 Weather
The monthly mean of daily maximum, minimum and average temperature, relative humidity, monthly total rainfall and sunshine hours received at the experimental site during the period of the study have been collected from Bangladesh Meteorological Department, Agargaon, Dhaka (Appendix-II)
3.5 Materials used for experiment
The tomato, variety BARI Tomato-14 was used for the experiment. Seeds were collected from Bangladesh Agricultural Research Institute, Joydevpur, Gazipur.
3.6 Raising of seedling
Tomato seedlings were raised in two seed beds of 2m X 1m size. The soil was well prepared and converted into loose friable condition in obtaining good tilth.
All weeds, stubbles and dead roots were removed. Twenty grams of seeds were sown in each seedbed. The seeds were sown in the seedbed on 15 October, 2012. Seeds were then covered with finished light soil and shading was provided by bamboo mat (chatai) to protect young seedlings from scorching sunshine and rainfall. Light watering, weeding and mulching were done as and when necessary to provide seedlings with a good condition for growth.
3. 7 Treatments
The two factor experiment consisted of four levels of nitrogen (Factor A) and three levels of Gibberellic acid (Factor B). The factors were as follows:
Factor A: levels of Nitrogen Factor B: levels of GA3
N0 = 0 kg/ha G0 = 0 ppm
N1 = 200 kg/ha G1 = 50 ppm
N2 = 225 kg/ha G2 = 70 ppm
N3 = 250 kg/ha
There were all together 12 treatments combination used in each block were as follows: N0G0 ,N0G1, N0G2 , N1G0 , N1G1, N1G2, N2G0 , N2G1 , N2G2 , N3G0, N3G1, N3G2
3.8 Experimental design and layout
Field layout was done after final land preparation. The experiment was laid out in a Randomized Complete Block Design (RCBD) with three replications. The whole plot was divided into three blocks each containing twelve (12) plots of 2m x 1.8m size, giving 36 unit plots. The space was kept 1 m between the blocks and 0.5m between the plots were kept. The distance between row to row and plant to plant was 60 cm and 40 cm, respectively. The layout of the experiment is shown in Figure 1.
10 m
Fig. 1: Layout of the experimental plot
10 m 15m
W
N
S
1.8m 1m 1m E
N3G0 m
N0G0
N0G2
N0G2 N2G0
N3G2
N0G2 N2G1
N1G1 N3G2
N3G1
N1G2
N2G2 N3G2
N2G2
N0G0 N0G1
N0G1 N2G2
N1G2
N1G1
N0G0 N3G0
N2G0
N1G0 N3G1
N2G0 N2G1
N1G0
N1G0
N3G1 N2G1
N1G1 N3G0
N1G2
1m 1m
N0G1
Plot size: 2m × 1.8 m Plot spacing: 50 cm Spacing Between replication : 1.0m
Factor A: Nitrogen (N) N0= 0 kg N ha-1 N1= 200 kg N ha-1 N2= 225 kg N ha-1 N3= 250 kg N ha-1
Factor B: Gibberillic acid (GA3) G0= 0 ppm GA3 G1= 50 ppm GA3 G2= 70 ppm GA3
29.1m 0.5 m
3.9 Land preparation
The experimental field was thoroughly ploughed and cross ploughed and cleaned prior to seed sowing and application of fertilizers and manure were done in the field. The experimental field was prepared by thorough ploughing followed by laddering to have a good tilth. Finally the land was properly leveled before transplanting. Then plots were prepared as per the design.
3. 10 Application of manure and fertilizers
The sources of N, P2O5, K20 as urea, TSP and MP were applied, respectively.
The entire amounts of TSP and MP were applied during the final land preparation. Urea was applied in three equal installments at 20, 30 and 40 days after seedling transplanting. Well-rotten cowdung 20 t/ha also applied during final land.
Table1. Fertilizer and manure applied for the experimental field preparation. Manure and fertilizers were used as recommended by BARI (2005).
Manure / Fertilizers
Rate/ha Application (%)
Basal 20 DAT 30 DAT 40 DAT
Cow dung 20 ton 100 - - -
Urea As treatment - 33.33 33.33 33.33
TSP 200 kg 100 - - -
MP 175 kg 100 - - -
3.11 Preparation and application of GA3
The stock solution of 1000 ppm of GA3 with small amount of ethanol to dilute and then mixed in 1 litre of water turn as per requirement of 50 ppm and 70 ppm solution of GA3. 50 and 70 ml of stock solution were mixed with 1 litre of water. Application of GA3 at 15 day interval were done at 20, 35 and 50 days after transplanting.
3.12 Transplanting of seedlings
Healthy and uniform 20 days old seedlings were uprooted separately from the seed bed and were transplanted in the experimental plots in the afternoon of 05 November, 2012 maintaining a spacing of 60 cm x 40 cm between the rows and plants respectively. This allowed an accommodation of 15 plants in each plot. The seedbed was watered before uprooting the seedlings from the seedbed so as to minimize damage of the roots. The seedlings were watered after transplanting. Shading was provided using banana leaf sheath for three days to protect the seedling from the hot sun and removed after seedlings were established. Seedlings were also planted around the border area of the experimental plots for gap filling.
3.13 Gap filling
Gap filling was done as and when needed.
3.14 Intercultural operation
After transplanting of seedlings, various intercultural operations such as irrigation, weeding, staking and top dressing etc. were accomplished for better growth and development of the tomato seedlings.
3.14.1 Irrigation and drainage
Over-head irrigation was provided with a watering cane to the plots once immediately after transplanting seedlings in every alternate day in the evening up to seedling establishment. Further irrigation was provided when needed.
Excess water was effectively drained out at the time of heavy rain.
3.14.2 Staking
When the plants were well established, staking was given to each plant by Dhaincha (Sesbania sp.) sticks to keep them erect. Within a few days of staking, as the plants grew up, the plants were pruned as per the treatments.
3.14.3 Weeding
Weeding was done to keep the plots clean and easy aeration of soil which ultimately ensured better growth and development. The newly emerged weeds were uprooted carefully. Mulching for breaking the crust of the soil was done when needed.
3.14.4 Top dressing
After basal dose, the remaining doses of urea were used as top-dressed in 3 equal installments at 15, 30 and 45 DAT. The fertilizers were applied on both sides of plant rows and mixed well with the soil. Earthening up operation was done immediately after top-dressing with nitrogen fertilizer.
3.14.5 Control of pest and disease
Malathion 57 EC was applied @ 2 ml/L against the insect pests like cut worm, leaf hopper fruit borer and others. The insecticide application was made fortnightly for a week after transplanting to a week before first harvesting.
Furadan 10 G was also applied during final land preparation as soil insecticide.
During foggy weather precautionary measured against disease infection of tomato was taken by spraying Dithane M-45 fortnightly @ 2 g/L, at the early vegetative stage. Ridomil gold was also applied @ 2 g/L against blight disease of tomato.
3.15 Harvesting
Fruits were harvested at 3 day intervals during early ripe stage when they attained slightly red color. Harvesting was started from 26 February, 2012 and was continued up to 25 March, 2013.
3.16 Collection of data
Five plants were selected randomly from each unit plot for data collection in such a way that the border effect could be avoided at the highest precision.
Data on the following parameters were recorded from the sample plants during the course of experiment.
3.16.1 Plant height
Plant height was measured from the sample plants in centimeter from the ground level to the tip of the longest stem and means value was calculated.
Plant height was recorded 20, 30, 40, 50 and 60 days after planting to observe the growth rate.
3.16.2 Number of leaves
Number of leaves was measured from the sample plants in centimeter from the ground level to the tip of the longest stem and mean value was calculated.
Number of leaves was recorded from 20, 30, 40, 50 and 60 days of planting to observe the growth rate of the plants.
3.16.3 Number of flower clusters per plant
The number of flower clusters was counted from the sample plants periodically and the average number of flower clusters produced per plant was calculated.
3.16.4 Number of flowers per cluster
The number of flowers per cluster was calculated as follows:
Total number of flowers in sample plant Number of flower per cluster = ---
Total number of flowers clusters in sample plants
3.16.5 Number of fruit in clusters per plant
The number of fruit clusters was recorded from the five sample plants, and the average number of fruit clusters produced per plant was recorded.
3.16.6 Fruit Diameter
The length of fruit was measured with a slide calipers from the neck of the fruit to the bottom of 20 selected marketable fruits from each plot and their average was calculated in centimeter. Diameter or fruit was measured at the middle portion of 20 selected marketable fruits from each plot with a slide calipers and their average was calculated in centimeter.
3.16.7 % Dry matter content in leaves
After harvesting, randomly selected 100 g plant leaf sample previously sliced into very thin pieces were put into envelop and placed in oven maintained at 60°C for 72 hours. The sample was then transferred into desiccators and allowed to cool down at room temperature. The final weight of the sample was taken. The dry matter contents of leaf were computed by the following formula:
Dry weight of leaf (g)
% Dry matter content of leaf = --- x 100 Fresh weight of leaf (g)
3.16.8 % Dry matter content in fruit
After harvesting, randomly selected 100 g fruit sample previously sliced into very thin pieces were put into envelop and placed in oven maintained at 60°C for 72 hours. The sample was then transferred into desiccators and allowed to cool down at room temperature. The final weight of the sample was taken. The dry matter contents of fruit were computed by simple calculation from the weight recorded by the following formula:
Dry weight of fruit (g)
% Dry matter content of fruit = --- x 100 Fresh weight of fruit (g)
3.16.9 Fruit yield per plant
A pan scale balance was used to take the weight or fruits per plot. It was measured by totaling of fruit yield from each unit plot during the period from first to final harvest and was recorded in kilogram.
3.16.10 Fruit yield per hectare
It was measured by the following formula:
Fruit yield per plot (kg) x 10000m2 Fruit Yield per hectare (ton) = ---
Area of plot in square meter (m2) x l 000kg 3.17 Analysis of data
The data in respect of growth, yield contributing characters and yield were statistically analyzed to find out the statistical significance. The means for all the treatments were calculated and the analysis of variance for all the characters was performed by F test. The significance of the difference among the means was evaluated byDuncan’s Multiple Range Test (DMRT) according to Gomez and Gomez, (1984) for interpretation of the results at 5% and 1% level of probability.
3.18 Economic analysis
The cost of production was analyzed in order to find out the most economic treatment of nitrogen and GA3. All input cost included the cost for lease of land and interests on running capital in computing the cost of production. The interests were calculated @ 13% in simple interest rate. The market price of tomato was considered for estimating the cost and return. Analysis were done according to the procedure determining by Alam et al., (1989). The benefit cost ratio (BCR) was calculated as follows:
Gross return per hectare (Tk.) Benefit cost ratio (BCR) = ---
Total cost of production per hectare (Tk.)
CHAPTER IV
RESULTS AND DISCUSSION
This chapter comprises the presentation and discussion of the results obtained from the effect of nitrogen and GA3 on the growth and yield of tomato. The effects due to different levels of nitrogen and GA3 and their interaction on the growth, yield contributing attributes and yield have been presented in Tables 2 to 3 and Figures 2 to 5. The results of each parameter studied in the experiment have been presented and discussed under the following headings.
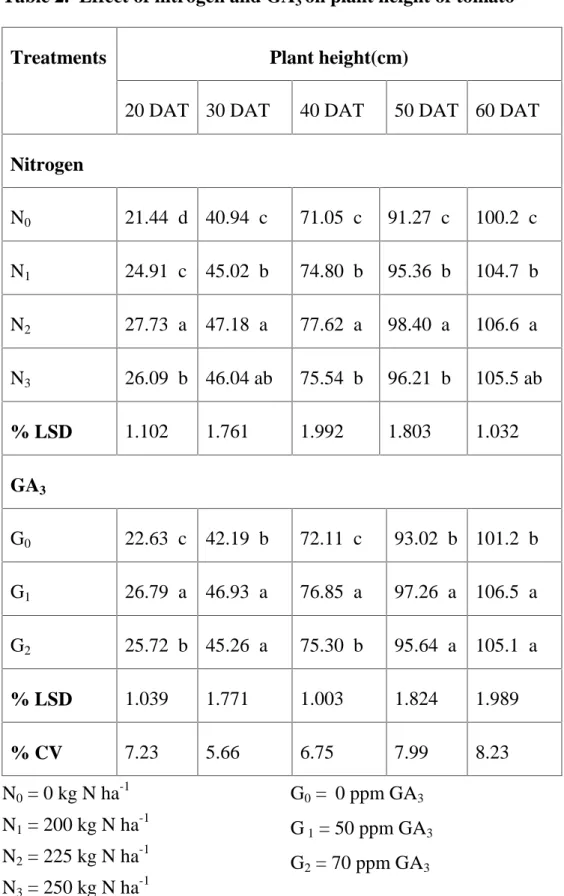
4.1 Plant height
Plant height of tomato varied significantly due to the application of different levels of nitrogen at 20, 30, 40, 50, and 60 DAT (Appendix III). At 20 DAT the longest (27.73 cm) plant was recorded from N2 (225 kg/ha), while the shortest (21.44 cm) plant was recorded from N0 (0 kg N/ha). The longest (47.18 cm) plant was recorded from N2 and the shortest (40.94 cm) plant was recorded from N0 at 30 OAT. At 40 DAT the longest (77.62 cm) plant was recorded from N2, while the shortest (71.05 cm) plant was recorded from N0. The longest (98.40 cm) plant was recorded from N2, while the shortest (91.27 cm) from N0 at 50 DAT. At 60 DAT the longest (106.6 cm) plant was recorded from N2, while the shortest (100.2 cm) plant was recorded from N0 (Table 2). Probably all micro and macro nutrients for 225 kg N/ha ensured the favorable condition for growth of tomato plant and the ultimate results is the tallest plant whereas above this level of nitrogen hinder the growth and plant height decreases.
Melton and Dufault (1991) found that plant height of tomato was increased as highest level of nitrogen. Similar results were reported by Chung et al. (1992).
Plant height of tomato varied significantly due to the application of different level of GA3 at 20, 30, 40, 50, and 60 DAT. At 20 DAT (Appendix III) the longest (26.79 cm) plant was recorded from G1 (50 ppm GA3), while the shortest (22.63 cm) plant was recorded from G0 (0 ppm GA3). The longest (46.93 cm) plant was recorded from G2 and the shortest (42.19 cm) plant was recorded from G0 at 30 DAT. At 40 DAT the longest (76.85 cm) plant was recorded from G1, while the shortest (72.11 cm) plant was recorded from G0. The longest (97.26 cm) plant was recorded from G1, while the shortest (93.02 cm) from G0at 50 DAT. At 60 DAT the longest (106.5 cm) plant was recorded from G1, while the shortest (101.2 cm) plant was recorded from G0 (Table 2).
Shittu and Adeleke (1999) reported similar findings.
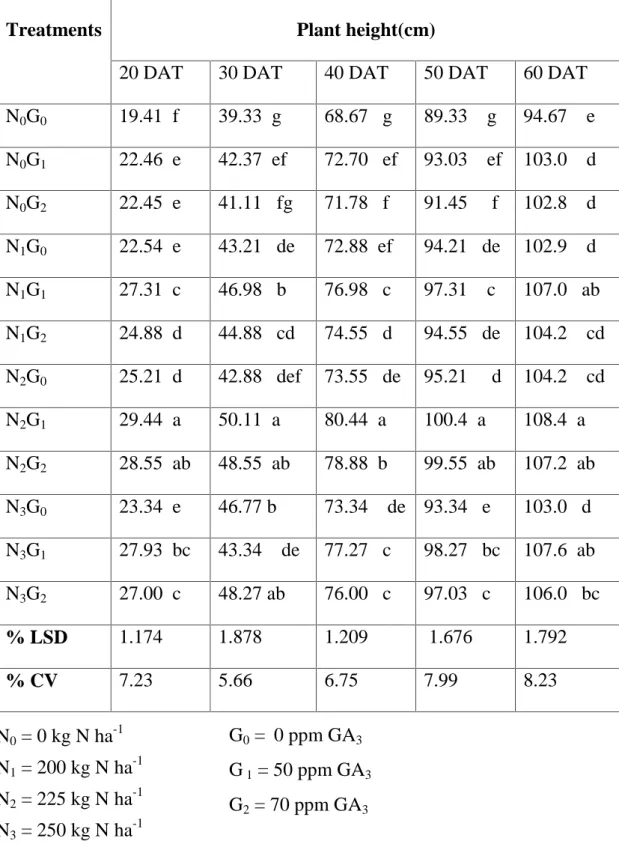
Due to combined effect of nitrogen and GA3 showed statistically significant variation on plant height at 20, 30, 40, 50 and 60 DAT (Appendix III). At 20 DAT the longest (29.44 cm) plant was recorded from N2G1 (225 kg N/ha x 50 ppm GA3) and the shortest (19.41 cm) plant was recorded from N0G0 (0 kg N/ha x 0 ppm GA3). The tallest plant (50.11 cm) was recorded from N2G1 (225 kg N/ha x 50 ppm GA3) and the shortest (39.33 cm) was recorded from N0G0(0 kg N/ha x 0 ppm GA3) at 30 DAT. At 40, 50 and 60 DAT the similar trends of results was found on plant height due combined effect of nitrogen and GA3 (Table 3).
Table 2. Effect of nitrogen and GA3on plant height of tomato
Treatments Plant height(cm)
20 DAT 30 DAT 40 DAT 50 DAT 60 DAT
Nitrogen
N0 21.44 d 40.94 c 71.05 c 91.27 c 100.2 c N1 24.91 c 45.02 b 74.80 b 95.36 b 104.7 b N2 27.73 a 47.18 a 77.62 a 98.40 a 106.6 a N3 26.09 b 46.04 ab 75.54 b 96.21 b 105.5 ab
% LSD 1.102 1.761 1.992 1.803 1.032
GA3
G0 22.63 c 42.19 b 72.11 c 93.02 b 101.2 b G1 26.79 a 46.93 a 76.85 a 97.26 a 106.5 a G2 25.72 b 45.26 a 75.30 b 95.64 a 105.1 a
% LSD 1.039 1.771 1.003 1.824 1.989
% CV 7.23 5.66 6.75 7.99 8.23
G0= 0 ppm GA3 G1= 50 ppm GA3 G2= 70 ppm GA3 N0= 0 kg N ha-1
N1= 200 kg N ha-1 N2= 225 kg N ha-1 N3= 250 kg N ha-1
In a column having similar letter (s) are statistically identical and those having dissimilar letter (s) differ significantly as per 0.05 level of probability