EFFECT OF PHOSPHORUS DOSE AND POTASSIUM SOURCES ON YIELD AND EXPORT QUALITY OF POTATO
SUJAN CHANDRA ROY
DEPARTMENT OF AGRONOMY
SHER-E-BANGLA AGRICULTURAL UNIVERSITY DHAKA-1207
DECEMBER, 2020
EFFECT OF PHOSPHORUS DOSE AND POTASSIUM SOURCES ON YIELD AND EXPORT QUALITY OF POTATO
BY
SUJAN CHANDRA ROY REGISTRATION NO.: 18-09114
A Thesis
Submitted to the Faculty of Agriculture Sher-e-Bangla Agricultural University, Dhaka
in partial fulfilment of the requirements for the degree
of
MASTER OF SCIENCE (MS) IN
AGRONOMY
SEMESTER: JULY-DECEMBER, 2020
Approved by:
________________________________ _________________________________
Prof. Dr. Tuhin Suvra Roy Supervisor
Dr. Bimal Chandra Kundu CSO, TCRC, BARI, Gazipur
Co-Supervisor
____________________________
Prof. Dr. Tuhin Suvra Roy Chairman
Examination Committee
CERTIFICATE
This is to certify that the thesis entitled “Effect of Phosphorus Dose and Potassium Sources on Yield and Export Quality of Potato” submitted to the Faculty of Agriculture, Sher-e-Bangla Agricultural University, Dhaka, in partial fulfillment of the requirements for the degree of Master of Science (MS) in Agronomy, embodies the results of a piece of bona fide research work carried out by Sujan Chandra Roy, Reg. No. 18-09114 under my supervision and guidance. No part of this thesis has been submitted for any other degree or diploma.
I, further, certify that such help or source of information as has been availed of during the course of this investigation has duly been acknowledged.
Dated: (Prof. Dr. Tuhin Suvra Roy)
Dhaka, Bangladesh Supervisor
Department of Agronomy Sher-e-Bangla Agricultural University
Dhaka-1207
DEPARTMENT OF AGRONOMY
Sher-e-Bangla Agricultural University Sher-e-Bangla Nagar, Dhaka-1207
i
ACKNOWLEDGEMENTS
The author is thankful to ALMIGHTY GOD who bestowed upon him. His blessings and gave him the knowledge, strength, and ability to accomplish this huge task with an objective to serve humanity around the world.
The author likes to express his heartfelt respect, gratitude and profound indebtedness to his respectable Supervisor Professor Dr. Tuhin Suvra Roy, Department of Agronomy, Sher-e-Bangla Agricultural University (SAU), Dhaka, Bangladesh for his scholastic guidance, support, encouragement, valuable suggestions and constructive criticisms throughout the study period and gratuitous labor in conducting and successfully completing the research work and writing the manuscript.
The author also extends his appreciation profound regards and cordial thanks to his Co- supervisor Dr. Bimal Chandra Kundu, Chief Scientific officer, BSPC, BARI, Debigonj, Panchagarh, Bangladesh who gave motivation, useful suggestions, and critical comments those helped him to improve his work.
Finally read his work and gave him useful suggestions on the last draft of the thesis.
Cordial thanks to Professor Dr. Tuhin Suvra Roy, Chairman, Department of Agronomy, Sher-e-Bangla Agricultural University, Dhaka for his continuous cooperation during the research work. Special appreciation and warmest gratitude are extended to his esteemed teachers Prof. Dr. Parimal Kanti Biswas, Prof. Dr. Md. Fazlul Karim, Assistant Prof. Rajesh Chakrabarty and all other teachers, Department of Agronomy, Sher-e-Bangla Agricultural University, Dhaka who provided creative suggestions, guidance and constant inspiration from the beginning to the completion of the research work. Their contribution, love and affection would persist in his memory for countless days.
The author would like to thank all of her friends and well-wishers who always inspired him during his research specially Biplob Kumar Roy, Bristi Basak, Md. Samiuzzaman, Naiem imtiaz, Sonjita Rani Roy, Ashok kumar Roy and Sharmin Akhter who helped him with their valuable suggestions and directions during the preparation of this thesis paper.
The author expresses his sincere appreciation to his beloved Parents, Sibling, Friends, relatives and well wishers for their inspiration, moral support, help and encouragement throughout the study period.
The study was supported by PBRG ID-20, PIU-BARC, NATP-2 .
The author also expresses his special thanks to Section Officer, Lab. Assistants and other office staff of the Department of Agronomy, Sher-e-Bangla Agricultural University, Dhaka for their extended and heartiest helps during the research work.
The Author December, 2020
ii LIST OF ACRONYMS Acronyms Full word
Agril. Agricultural
BARI Bangladesh Agricultural Research Institute
BBS Bangladesh Bureau of Statistics
Bull. Bulletin
cm Centimeter
CV Coefficient of Variation
DAS Days After Storage
Env. Environment
et al. And others (et alibi)
FAO Food and Agriculture organization
g Gram
i.e. Id est, in other words
J. Journal
pH Hydrogen ion concentration
LSD Least Significance Difference
MSI Membrane Stability Index
MT Matric Ton
N Nitrogen
NS Non-Significant
% Percent
Pharmacol Pharmacology
Photosynth Photosynthesis
Physiol Physiology
PS Potassium Silicate
Regul Regulation
Res Research
ROS Reactive Oxygen Species
RWC Relative Water Content
SAU Sher-e- Bangla Agricultural University
Sci Science
Sp. gravity Specific gravity
TCRC Tuber Crop Research Centre
TSP Triple Superphosphate
TSS Total Soluble Solid
viz. videlicet (L.), Namely
iii
TABLE OF CONTENTS
CHAPTER TITLE Page
No.
ACKNOWLEDGEMENTS i
ACRONYMS ii
TABLE OF CONTENTS iii
LIST OF TABLES v
LIST OF FIGURES vii
LIST OF APPENDICES ix
LIST OF PLATES x
ABSTRACT xi
I. INTRODUCTION 01
II. REVIEW OF LITERATURE 04
2.1 Effect of phosphorus dose on growth and yield of potato 04 2.2 Effect of potassium sources on growth and yield of potato 07
III. MATERIALS AND METHODS 12
3.1 Site description 12
3.1.1 Geographical location 12
3.1.2 Agro-ecological region 12
3.1.3 Climate 12
3.1.4 Soil characteristics 13
3.2 Details of the experimental treatment and design 13
3.2.1 Treatments 13
3.2.2 Experimental design 13
3.3 Crop / Planting material 14
3.4 Growing of crops 14
3.4.1 Preparation of the main field 14
3.4.2 Application of manure and fertilizer 14
3.4.3 Planting of potato tubers 14
3.4.4 Intercultural operation 15
3.4.4.1 Weeding and mulching 15
iv
TABLE OF CONTENTS (CONT’D)
CHAPTER TITLE Page
No.
3.4.4.2 Earthing-up 15
3.4.4.3 Pests and diseases control 15
3.4.4.4 Haulm cutting 16
3.5 Harvesting 16
3.6 Data collection 16
3.7 Statistical analysis 21
IV RESULTS AND DISCUSSION 22
4.1 Days to 80% emergence 22
4.2 Plant vigor 22
4.3 No. of leaves plant-1 23
4.4 Crop stand at 30 DAP 26
4.5 Number of stem plant-1 at 80 DAP 27
4.6 Plant height (cm) 27
4.7 Tuber number hill-1 32
4.8 Average weight of tuber (g) 32
4.9 Yield of potato (tha-1) 34
4.10 yield of table potato >20 g (tha-1) 37
4.11 Category of different tubers to different uses (tha-1) 38
4.12 Dry matter contents in potato tubers 42
4.13 Specific gravity in potato tubers 42
4.14 Content of total soluble solid in potato tubers –TSS (Brix) 45
4.15 Firmness 45
4.16 Skin color of tubers 48
4.17 Flesh color of tubers 51
4.18 Starch contents (%) 54
4.19 Reducing sugar content (mgg-1FW) 54
4.20 Non-reducing sugar content (mgg-1FW) 55
4.21 Antioxidant content (Troloxµ Mol 100 g-1 FW) 57
4.22 Polyphenol content (GA mg 100 g-1 FW) 58
4.23 Correlation coefficient (r) and coefficient of determinant (R2) for different quality parameters 62
V SUMMARY AND CONCLUSIONS 64
REFERENCES 72
APPENDICES 79
v
LIST OF TABLES
Table Title Page
no.
1 Doses and methods of application of manure and fertilizers in the potato field
14
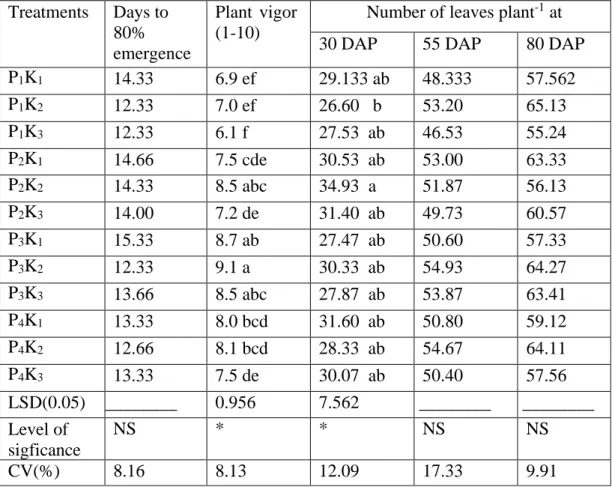
2 Effect of phosphorus dose and sources of potassium on days required for 80% emergence of seedlings, plant vigor and no. of leaves of potato at different days after planting (DAP)
25
3 Combine effect of phosphorus dose and sources of potassium on days required for 80% emergence of seedlings, plant vigor and no. of leaves of potato at different days after planting (DAP)
26
4 Effect of phosphorus dose and sources of potassium on crop stand at 30 DAP, number of stem at 80 DAP and Plant height of potato at different days after planting (DAP)
30
5 Combine effect of phosphorus dose and sources of potassium on crop stand at 30 DAP, number of stem at 80 DAP and Plant height of potato at different days after planting (DAP)
31
6 Effect of phosphorus dose and sources of potassium on number of tubers hill-1, average weight of individual tuber, yield of potato
36
7 Combine effect of phosphorus dose and sources of potassium on number of tubers hill-1 , average weight of individual tuber, yield of potato
37
8 Effect of phosphorus dose and sources of potassium on yield of table potato and category of different tubers to different uses
40 9 Combine effect of phosphorus dose and sources of potassium
on yield of table potato and category of different tubers to different uses
41
10 Effect of phosphorus dose and sources of potassium on dry matter contents, specific gravity (gm-3), content of total soluble solid (TSS) and firmness score in potato tubers
46
11 Combine effect of phosphorus dose and sources of potassium on dry matter contents, Specific gravity, content of total soluble solid (TSS) and firmness score in potato tubers
47
vi
LIST OF TABLES (CONT’D)
Table Title Page
12 Effect of phosphorus dose and sources of potassium on skin color of potato tubers
49 13 Combine effect of phosphorus dose and sources of potassium on
skin color of potato tubers
50 14 Effect of phosphorus dose and sources of potassium on flesh
color of potato tubers
52 15 Combine effect of phosphorus dose and sources of potassium on
flesh color of potato tubers
53 16 Effect of phosphorus dose and sources of potassium on some bio-
chemical parameters of potato tubers
60 17 Combine effect of phosphorus dose and sources of potassium on
some bio-chemical parameters of potato tubers
61
vii
LIST OF FIGURES
Figure Title Page
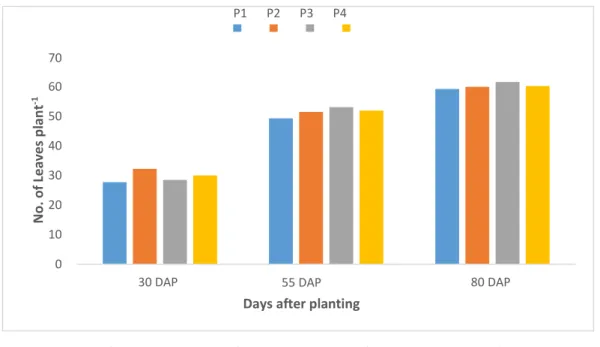
1 Effect of phosphorus dose on no. of leaves of potato at different days after planting (DAP)
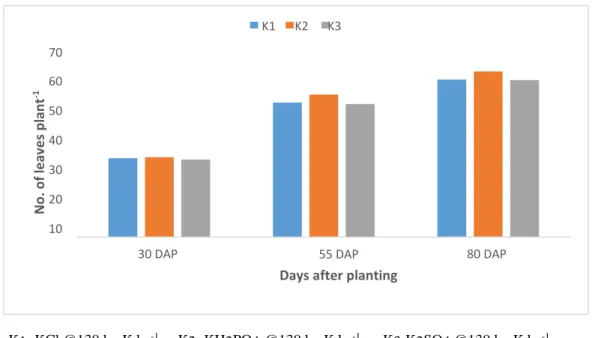
24 2 Effect of sources of potassium on no. of leaves of potato at
different days after planting (DAP)
24 3 Effect of phosphorus dose on plant height of potato at different
days after planting (DAP)
28 4 Effect of source of potassium on plant height of potato at different
days after planting (DAP)
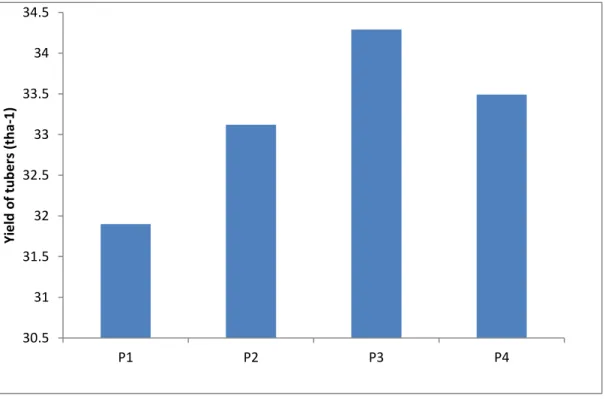
29 5 Effect of phosphorus dose on number of tubers hill-1 33 6 Effect of sources of potassium on number of tubers hill-1 33 7 Effect of phosphorus dose on yield of potato (tha-1) 34 8 Effect of sources of potassium on yield of potato (tha-1) 35 9 Effect of phosphorus dose on dry matter contents 43 10 Effect of sources of potassium on dry matter contents 43 11 Effect of phosphorus dose on specific gravity (gm-3) 44 12 Effect of sources of potassium on specific gravity (gm-3) 44 13 Effect of phosphorus dose on starch (%) of potato tuber 55 14 Effect of sources of potassium on Starch (%) of potato tuber 56 15 Effect of phosphorus dose on reducing sugar (mgg-1FW) of potato
tuber
56 16 Effect of sources of potassium on reducing sugar (mgg-1FW) of
potato tuber
57 17 Effect of phosphorus dose on polyphenol (GA mg 100 g-1 FW) of
potato tuber
59
viii
LIST OF FIGURE (CONT’D)
18 Effect of sources of potassium on Polyphenol (GA mg 100 g-1 FW) of potato tuber
59 19 Correlation coefficient (r) and coefficient of determinant (R2) for
different quality parameters a. Relation between specific gravity and dry matter content of potato tuber, b. Relation between non- reducing sugar content and starch of potato tuber
63
20 Correlation coefficient (r) and coefficient of determinant (R2) for different quality parameters c. Relation between starch and dry matter content of potato tuber, d. Relation between starch and total soluble solid of potato tuber
63
21 Correlation coefficient (r) and coefficient of determinant (R2) for different quality parameters. e. Relation between reducing sugar content and starch of potato tuber, f. Relation between non- reducing sugar content and reducing sugar content of potato tuber
63
ix
LIST OF APPENDICES
Appendix Title Page
I The Map of the experimental site 79
II Layout of the Experiment 80
III Monthly record of air temperature, relative humidity, rainfall and sunshine hour of the experimental site during the period from November 2018 to February 2019
81
IV Analysis of variance of the data on days required for 80%
emergence of seedlings, plant vigor and No. of leaves of potato at different days after planting (DAP)
81
V Analysis of variance of the data on crop Stand at 30 DAP, number of stem at 80 DAP and Plant height of potato at different days after planting (DAP)
82
VI Analysis of variance of the data on number of tubers hill-1, average weight of individual tuber, yield of potato
82 VII Analysis of variance of the data on yield of table potato and
category of different tubers to different uses
83 VIII Analysis of variance of the data on dry matter contents,
specific gravity, content of total soluble solid (TSS) and firmness score in potato tubers
83
IX Analysis of variance of the data on skin color of potato tubers
84 X Analysis of variance of the data on flesh color of potato
tubers
84 XI Analysis of variance of the data on some bio-chemical
parameters of potato tubers
85
x PLATES
Plates Title Page no.
1 Overview of the whole experiment 86
2 Land preparation 86
3 Sowing of potato tubers 86
4 Investigation disease infection with supervisor 87
5 Data collection in field 87
6 Bagging and carrying of potato tuber to store house 87
7 Potatoes from different combination 88
8 Chemical analysis in lab 88
xi
EFFECT OF PHOSPHORUS DOSE AND POTASSIUM SOURCES ON YIELD AND EXPORT QUALITY OF POTATO
SUJAN CHANDRA ROY ABSTRACT
The experiment was conducted in the experimental field of Sher-e-Bangla Agricultural University, Sher-e-Bangla Nagar, Dhaka from the period of November, 2018 to February, 2019 to assess the effect of phosphorus dose and potassium sources on yield of processing and export quality of potato. The potato variety BARI Alu-28 (Courage) was used as test crop for this experiment. The experiment consisted of two factors: Factor A: Phosphorus dose (4 dose) as- P1 = 200 kgha-1 TSP @ 41.84 kg P ha-1 ; P2 = 220 kgha-1 TSP @ 46.03 kg P ha-1, P3
= 240 kgha-1 TSP@ 50.21 kg P ha-1 and P4 = 260 kgha-1 TSP @ 54.39 kg P ha-1, and potassium sources (3); K1 = KCl (250 kg ha-1 KCl @130 kg K ha-1), K2 = KH2PO4 (452.19 kgha-1 KH2PO4 @130 kg K ha-1) and K3 = K2SO4 (288.6 kgha-1 K2SO4 @130 kg K ha-1). The two factorial experiment was laid out in split-plot design with three replications. Data were recorded on different yield attributes, yield and quality of potato tuber. For different dose of phosphorus, number of tuber per hill, average tuber weight, yield, chips potato (45-75), french fry (>75), TSS, firmness, Reducing sugar, non-reducing sugar content, increased with increasing phosphorus dose and negative relation was observed increase of canned potato (20- 45), dry matter content, specific gravity, starch, anti-oxidant and polyphenol content. In case of different sources of potassium, the highest yield of potato tubers (34.30 t ha-1 ) from K2, but dry matter content (21.10%), specific gravity (1.0808 gcm-3), firmness (46.80), starch (15.985%), anti-oxidant (567.87 Trolox µ Mol 100 g-1 FW) and polyphenol (85.243 GA mg 100 g-1 FW) was recorded from K3, whereas the lowest was found from K2. Due to combined effect of different dose of phosphorus and different sources of potassium, the highest yield of potato tubers (35.35 tha-1 ) from P3k2, but dry matter content (22.85%), specific gravity (1.0998 gcm-3), starch (17.936%), anti-oxidant (630.12 Trolox µ Mol 100 g-1 FW) and polyphenol (92.994 GA mg 100 g-1 FW) were found from P1K3, whereas the lowest dry matter and specific gravity contentwere recorded from P1K2 treatment combination. Among potassium sources, inspite of KH2PO4 producing highest yield of potato, KCl and K2SO4 as a source of potassium and 50.21 kg P ha-1 produced good processing quality potato. However, considering economic condition of Bangladesh and availability, KCl would be used as a source of potassium for producing processing quality of potato without sacrificing yield.
CHAPTER I INTRODUCTION
Potato (Solanum tuberosum L.) belongs to the family Solanaceae is the fourth largest world food crop after rice, wheat, and maize (Ahmed, et. al., 2017; Chakraborty et.
al., 2010; Haas et. al., 2009). The large per capita consumption can be easily justified because they are rich in carbohydrates, minerals but also contain a large amount of high quality of proteins, vitamin C and minerals (Brown, 2005). Potato is one of the major vegetable crops cultivated throughout the southern Mediterranean, with Spain and Italy being the main producers, with 2.0 and 1.3 million tons of annual tuber production, respectively (FAOSTAT, 2018). In Bangladesh, the total acreage, production and yield of potato is 0.48 million hectares, 0.974 crore MT and 20.41 t ha-1 respectively and the yield of potato is comparatively low in comparison with the other major potato producing countries viz., USA (47.15 t ha-1 ) and France (54.19 t ha-1 ) (FAOSTAT, 2018). Potato (Solanum tuberosum L.) is one of the most important vegetables in Egypt which gained a considerable importance as an export to European markets (Eleiwa et. al., 2012). Potato is a short-cycle crop and present high production capacity, it is highly influenced by the application of different nutrients to the soil (Luz et. al., 2013). It has been usually applied high rates of phosphate fertilizers in the cultivation, aimed at achieving high levels of tuber yield and larger tuber (Luz et. al., 2013). Phosphorus has various effects on tuber quality, such as tuber size and percentage of dry matter (indicated by specific gravity) of the tuber (Freeman et. al., 1998 and Rosen et. al., 2014). Phosphorus is the 2nd limiting nutrient after nitrogen. It is one of the key nutrient and sways the early crop development and tuber initiation, tuber size, tuber specific gravity. (Dyson and Watson, 1971). Phosphorus promotes rapid canopy development, root cell division, tuber set, and starch synthesis. Adequate P is essential for optimizing tuber yield, solids content, nutritional quality and resistance to some diseases (Rosen et. al., 2014). Potato is highly responsive to soil-applied nutrients, especially to phosphorus (P), due to its short cycle and high yield potential. Phosphorus is essential for plants, mainly for the metabolic processes related to energy uptake, and therefore limiting for potato development. Therefore, there is a need plant growth is delayed at low-P levels already in initial stages; besides, number and length of roots and stolon are reduced as well as tuber yield (Fontes, 1997) . Phosphorus nutritional status affects
the absorption of other nutrients and, consequently, influence crop nutrition and production. The plant requirement of magnesium (Mg) can be related to the P levels in nutrient solution (Vichiato et. al., 2009). Phosphorus also interacts positively with nitrogen (N) uptake and plant growth (Fageria, 2001), and P deficiency reduces the uptake of both nitrate (Araújo & Machado, 2006) and ammonium. The application of high P levels increases the severity of zinc (Zn) deficiency in soils with low Zn levels (Fageria, 2001). Physico-chemical characteristics and the nutritional composition of potato tubers may vary depending on various factors, such as cultivar, availability of nutrients in the soil, fertilization process, plant maturity, climate, etc. (Evangelista et. al., 2011; Feltran et. al., 2004; Fernandes et. al., 2010;
Klein et. al., 1980; Lachman et. al., 2005; Quadros et. al., 2009; Rosen et. al., 2014).
According to Klein et. al. (1980), P fertilization increases the concentrations of ascorbic acid, nitrogen (N), and protein in tubers. In addition to increasing the specific gravity of tubers, P fertilization can also change the texture, color, and flavor of cooked tubers (Sheard & Johnston, 1958). However, there is little research evaluating the effect of P on the nutritional composition of potato tubers (Rosen et.
al., 2014).
Potatoes are short-lived, high yields and comprehensive yields. The balanced use of nutrients is essential for sustainable crop productivity. In many potato producing areas, nitrogen fertilizers (N) and phosphorus (P) are used, while the application of potassium (K), which leads to a serious reduction in the potassium state in the soil from potato growing areas (Pervez et. al., 2013). Potato cultivars have different strategies for dealing with potassium (K) deficiency in soil, and their response to different forms and rates of K fertilization may vary because of differences in soil K availability (Yakimenko and Naumova, 2018). A number of research has been devoted to studying the effect of type, rates and forms of fertilizers on potato tuber yields and quality (Davenport and Bentley, 2001; Ewais et al., 2010; Zorb et. al., 2014). Potassium influences both quantity and quality of potatoes (Karam et al., 2011; Lakshmi et. al., 2012) through various mechanisms such as enzyme activation, stomatal conductance, photosynthesis, protein synthesis, and transport of sugars and starch (Werij et. al., 2007). Various sources of K salts are used for plants nutrition such as potassium chloride (KCl), potassium sulfate (K2SO4), mono potassium phosphate (KH2PO4), potassium nitrate (KNO3) and potassium silicate (K2O.4SiO2) (Magen, 2004). Among them potassium silicate (K2O.4SiO2) caused
very good results to improve the growth and yield of plants (Salim et. al., 2011;
Rytel et. al., 2013; Salim, 2014). The quality of potato tubers and their chemical composition are influenced by many factors - genetics, soil fertility, weather conditions and applied nutrients (Rytel et. al., 2013). Potassium deficiency is observed the plants are short, leaves become pale-green and later in the vegetation at leaves ends and tops they become necrotic (Kerin and Berova, 2008; Kumar and Sharma, 2013). Potassium application resulted in higher leaf area, increased plant height, prolonged bulking duration, enhanced tuber size, and a higher proportion of medium and large size grades and higher yields (Trehan et. al., 2001). Potassium also affects dry matter percentage, increases ascorbic acid content, decreases reducing sugars, phenol contents, and enzymatic degradation (Chen et. al., 2004;
Werij et. al., 2007). Many potato producers for fry industry changed from the use of potassium chloride to potassium sulfate, as there is a concept that the use of this source improves tuber quality (Silva et. al., 2018). With this background and situation the present study was conducted for fulfilling the following objectives:
• To study the effect of level of phosphorus and/ or sources of potassium on yield and export quality of potato.
CHAPTER II
REVIEW OF LITERATURE
Potato is a crop of major significance in human nutrition, ranking 4rth in food production, after wheat, maize, and rice. This crops demand high investment in fertilizers, and depending on price and growing season, it can account for more than 30% of total cost of crop production. Therefore, there is a need to develop fertilizer management techniques for potato, increasing the efficiency of fertilizer use. Organic and inorganic fertilizer management is the important factor that greatly affects the growth and yield of potato. Among different Organic and inorganic fertilizers, Phosphorus Dose and Potassium Sources play an important role for the yield and quality of potato. However, very limited research work have been conducted on the performance of potato in response to Phosphorus Dose and potassium source in various part of the world including Bangladesh and the work so far done in Bangladesh is not adequate and conclusive. However, some of the important and informative works conducted at home and abroad in this aspect reviewed in this chapter under the following headings:
1.1 Effect of Phosphorus Dose on growth and yield of potato
Dharmendra Gaur et. al. (2017) conducted this experiment during Rabi season, to evaluate the effect of different phosphorus levels on growth attributes, physiological parameter and grading of tuber in potato crop (Solanum tuberosum L.). The experiment consisted of 10 treatments with four replications. The results revealed that both farmers practice and application of 120 Kg P2O5/ha through fertilizer produced significantly higher dry matter/plant, tuber dry matter/plant, AGR and RGR and both these treatments were statistically at par to each other. On the other hand 100% P2O5 through FYM recorded significantly higher number of leaves/plant whereas application of 100% P2O5 through FYM recorded minimum number and weight of crack tuber as compared to other treatments. Control treatment recorded significantly higher root length and root shoot: ratio, tuber number and tuber yield under < 25 g while application of 120 kg P2O5/ha through fertilizer was higher in case of total number of tuber (per plot), number of tuber and yield of tuber under 20-50 and 50-75 g. However, number and yield of tuber under <75 g was highest in farmers practice. However, quadratic equation line (Y = 21.748 + 5.489 X –0.587X2) for inorganic doses of
phosphorus resulted in, 116.93 and 63.42 kg P2O5/ha were the optimum physical and economical levels, respectively for getting higher yield of tuber. Therefore, it is concluded that application of 120 and 60 Kg P2O5/ha through fertilizer was the best dose of phosphorus for achieving higher optimum physical and economical productivity, respectively.
Fernades et.al.(2015) conducted this experiment to evaluate the effect of P fertilization on the quality and nutritional composition of marketable tubers of potato cultivars.
Experiments in soils with low, medium and high P availability were conducted in a randomized block design, with four replications. Treatments consisted of a 2×5 factorial arrangement of two potato cultivars (Agata and Mondial) and five P2 O5 rates (0, 125, 250, 500, and 1,000 kg ha–1). Phosphorus fertilization increased the contents of P and starch, the size and yield of marketable tubers, with more expressive response to higher P rates in the soils with low and medium P availability. The Mondial cultivar had the highest yield, due to a greater tuber weight and greater increases in this characteristic in response to P fertilization. The Mondial cultivar produced tubers with firmer pulp, with higher dry matter percentage and higher contents of Ca, Cu, and Zn than Agata. In the soil with low P availability, P fertilization reduced Zn content, but, in general, had little influence on the nutritional composition of potato tubers.
Qadri et. al.(2015) conducted this study to evaluate the Phosphorous and Foliar Applied Nitrogen Improved Productivity and Quality of Potato. Experiment was comprised of four different treatments of phosphorus (DAP, 46% P) and nitrogen (urea, 46% N) including a control. Treatments were T0 (DAP 160 + Urea 300 kg/acre), T1 (DAP 160 + Urea 5 kg/acre), T2 (DAP 100 + Urea 6 kg/acre) and T3 (DAP 120 + Urea 8 kg/acre). DAP fertilizer was given as basal dressing at the time of sowing. Foliar applications of nitrogenous fertilizer (urea) were given after 30 of sowing with one week interval in five split doses. Results indicated that T3 remained better regarding productivity and quality of potato. The overall fertilizer efficacy regarding yield and quality was: T3 ˃ T2 ˃ T1 ˃ T0. However, Vitamin C was found maximum in T0.
Yohana et. al. (2011) conducted an experiment to evaluate the Effects of phosphorus and potassium levels on the yield of the tuber variety Criolla Colombia in the department of Cundinamarca. The design used a completely randomized block with three replications and a 4 x 4 factorial structure, where the first factor corresponds to
phosphorus (0, 50, 100 and 150 kg ha-1 P2O5), and the second, potassium (0, 50, 100 and 150 kg K2O ha-1). The variables evaluated were specific gravity and tuber yield in the categories: first (PT1), second (PT2), third (PT3) and total (PTT). In Zipaquirá, there were differences in the phosphorus factor for the yield variables PT1, PT2 and PTT, while in the town of Cogua, the only difference for this factor was found in the variable PTT. In these variables, the levels of 50, 100 and 150 kg ha-1 of P2O5 produced higher yields that were equal and above that of the 0 kg ha-1 P2O5 level. In the potassium factor, differences were found only for the yield variable PT3 in the town of Cogua. The specific gravity did not respond to the P or K factors evaluated.
Rosen et.al.(2008) conducted an experiment on Potato Yield and Tuber Set as Affected by Phosphorus Fertilization .Nine fertilizer treatments compared banded P rates of 0, 37, 42, and 74 kg P ha−1 , the P sources mono-ammonium phosphate (MAP) and di- ammonium phosphate (DAP), P banded at planting vs. split applications at planting and emergence, and starter N rates of 38 and 66 kg N ha−1 . Phosphorus fertilizer application increased total tuber yield and yield of undersized tubers (tubers less than 85 g), but decreased the proportion of large-sized tubers (greater than 285 g). Due to the increases in small, unmarketable tubers, P fertilizer application did not have a significant effect on marketable tuber yield (tubers greater than 85 g). The total number of tubers per plant and the number of undersized tubers were also higher, and the number of large tubers was lower, when P was applied compared with the zero P control. Both the number and yield of undersized tubers increased as P application rate increased. Petiole P concentrations were generally consistent with the rate of P applied, but they varied by year in magnitude and their pattern through the season. Petiole P was positively correlated with the number of tubers per plant, but only correlated for 1 year with differences in total yield. Phosphorus application increased total P uptake due primarily to an increase in tuber P concentration
Parveen et. al.(2007) conducted a field study on the optimizing phosphorus requirement of chipsona varieties for west-central plains of india at CPRI Campus, Modipuram during 2000-2002 indicated that stem number, plant height, leaf number, processing grade (> 45 mm) as well as total tuber number of potato cvs. Kufri Chipsona-1 and Kufri Chipsona2 increased with the application of phosphorus upto 80 kg P2 O5 ha-1. Processing quality parameters like specific gravity, tuber dry matter and chip colour at harvest and after five-month storage remained
unchanged by P. Highest tuber yield (386.6 q/ha), maximum net returns (Rs. 59,503) and the highest benefit cost ratio (2.43) were recorded at 80 kg P2 O5 ha-1.
1.2 Effect of potassium sources on growth and yield of potato.
Singh et. al. (2020) conducted an experiment to study on influence of potassium on the productivity and quality of potato. Potassium nutrition plays an important role in increasing the potato yield, either due to the formation of large tubers or the increase in the number of tubers per plant. Among the integrated nutrient management in potatoes, farmyard manure promotes the absorption and availability of potassium for potato plants. Potassium protects against frost and drought stress in plants and decreases the incidence of diseases or pests. Potassium availability also decreases the concentration of reducing sugar and improves the colour and quality of potato chips. Potassium sulfate improves potato quality better than sources of potassium chloride.
Silva et al. (2018) conducted an experiment to evaluate the effect of these two potassium sources on yield, specific gravity and chip color of potato chipping cultivars on a Dystrophic Red Latosol, in Canoinhas, Brazil. Treatments consisted of two potato cultivars, BRSIPR Bel and Atlantic, and two sources of potassium, chloride and sulfate, applied in the furrow at the planting time, in rates based on soil analysis. 100 days after planting each sub-plot was evaluated for yield, specific gravity and chip color and observed that there was no significant effect of potassium source on yield components, specific gravity and chip color of BRSIPR Bel and Atlantic.
Mello et al. (2018) conducted an experiment to evaluate PH (Polyhalite is a hydrated sulfate evaporite mineral containing potassium) as a fertilizer for potato production in the weathered tropical soils in Brazil with either muriate of potash (MOP), sulfate of potash (SOP), or PH as the K source; with kieserite and gypsum added to the SOP to make a synthetic PH with similar composition; P either as single super phosphate (SSP) for the MOP blend or mono ammonium phosphate (MAP) for the PH and SOP blends;
and N as urea adjusted for the N in MAP. All were applied at four application rates of 62, 125, 187, and 249 kg K ha-1 and a control was also included consisting of N and P as urea and MAP but no K, Ca, Mg, or S. Findings revealed that the potato yields increased linearly with increasing K application rate from 22.4 t ha-1 for the control to the highest yield of 29.2 t ha-1 and were higher for PH and SOP than MOP (28.8, 29.2, and 25.3 t ha-1 , respectively). Polyhalite blend increased dry matter and starch at the
higher application rates compared with MOP and SOP at Tapira and increased potato 8 hardness and crunchiness at the optimum 62 kg K ha-1 application rate at Casa Branca.
Yield response was similar for PH and SOP but quality differences between these two fertilizer blends were observed even though they were similar in composition.
Yakimenko and Naumova (2018) conducted a study was performed to evaluate the effect of K fertilization rates (0, 30, 60, 90, 120 and 150 kg K ha-1 ) on tuber yield and quality (dry matter, starch, sugar and ascorbic acid content, taste) of two potato cultivars (Roco and Rosara) grown in the micro plot field experiment on Luvisol in the forest- steppe zone in southern West Siberia, Russia. The tuber yield of both potato cultivars increased with increase in K application rate up to 2.1 and 2.9 kg m-2 for Roco and Rosara, respectively. Sugar content, averaging 3.5%, was mostly determined by cultivar; however, in both cultivars it tended to decrease with increasing K application rate. The application of K fertilizer in the form of sulphate as compared to chloride increased dry matter content from 22.4 to 23.8% and ascorbic acid content from 13.2 to 14.6 mg 100 g-1 fresh mass. Potassium application rate did not affect Roco tubers’
taste, while improving Rosara tubers’ taste under moderate application rates. The results underscore the importance to adjust fertilizer recommendations concerning potassium application rates and source on the basis of biological requirements and intended utilization of individual potato cultivars.
Mohan et. al. (2017) conducted this field experiment at KVK Kandali, UAS, Bengaluru to study the effect of different rates and sources of potassium on growth, yield and quality of potato. Results revealed that highest growth parameters like plant height (49.0), number of branches (2.83), and total dry matter production (6366.04 kg ha-1 ) recorded with application of 75:75:175 kg ha-1 NPK with K as Bio K + Sulphur (S). Significantly lower growth parameters like plant height (31.67), number of branches (1.99), and total dry matter production (2063.02 kg ha-1 ) recorded in control.
Number of tuber and tuber 7 weight per plant were significantly higher due to application of 75:75:175 kg ha-1 NPK with K as Bio K + S (4.80 and 560.67) and was on par with 75:75:175 kg ha-1 NPK with K as SOP + Sulphur (4.6 and 545.67).
Maximum tuber yield was recorded with 75:75:175 kg ha-1 N P K with K as Bio-K+ S (31.15t ha-1 ) and significantly lower tuber yield recorded in absolute control (11.0).
Significantly highest protein (8.50%) and starch (79.27%) content were recorded in treatment 75:75:175 kg ha-1 NPK with K as Bio K + S. Total N, P, K content in haulm
(1.35, 0.27 and 2.87) and tuber (1.34,0.43 and 1.75) was significantly higher due to application of 75:75:175 kg ha-1 NPK with K as Bio-K + S and was on par with application of 75:75:175 kg ha-1 NPK with K as SOP+S. As regard to micronutrients, significantly higher Fe, Mn, Zn Cu and B content in haulm (277.63, 152.41, 44.54, 32.85 and 9.82) and tuber (147.06, 53.6, 12.37, 26.65 and 16.53) was recorded due to application of 75:75:175 kg ha-1 NPK with K as Bio K + S. B:C ratio of 4.74 was recorded with the application of (75:75:175 kg ha-1 NPK) K as Bio K + Sulphur is found to be more profitable compared to other treatments in potato cultivation.
Neshev and Manolov (2016) carried out a field experiment included two fertilizer rates- 100 and 200 kg K2O ha-1 supplied as K2SO4 or KCl. Increased content of nitrogen in roots at variants fertilized with KCl was observed 3.01% for KCl (100) and 3.13% for KCl (200). Potassium fertilization have no effect on seedling emergence but increased K content in roots compared to control. The N content in aboveground biomass was the lowest for KCl (100) (4.13%) and for KCl (200) (3.84%). The applied potassium fertilizers increased K content in aboveground biomass compared to control. The high KCl rate at variant KCl (200) increased K content in aboveground biomass up to 5.16%. The fertilization with K2SO4 led to slight decrease of N content in the tubers compared to control (2.32%), but he KCl increased tuber N content from 2.60% at variant KCl (100) to 2.89% at KCl (200). The K content in tubers was not considerably influenced by the fertilization but an exception was observed for variant KCl (200) where it (2.70%) exceeded the one at the other variants.
Salim et. al. (2014) conducted two field experiments to study the effect of foliar spray with potassium nitrate, potassium silicate, potassium chloride and mono potassium phosphate at the rates 1000 ppm and 2000 ppm on growth, yield parameters and some biochemical constituents of potato plant. Two samples were taken after 65 days from sowing and at harvest. At the 1st sample date, plant length, shoot fresh weight, shoot dry weight, total chlorophyll reading, total nitrogen and proteins, P, K, Mg, Fe, Mn and Zn concentrations (in potato leaves) 6 were determined. At the 2nd sample date (harvesting stage), tubers number per plant, tubers weight/plant, yield/plant and yield/fadden were recorded. The higher rate of potassium silicate and potassium nitrate were more effective than the rest treatments on enhancing the vegetative growth parameters and yield components. In general, all potassium treatments have strongly
stimulating effect on mineral nutrients (N, P, K, Mg, Zn, Mn and Fe) and protein concentration of potato leaves in both seasons.
Gunadi (2009) conducted an experiment to determine the response of potato to potassium (K) fertilizer sources and application methods in Andisols of West Java was conducted at a farmer’s field in the highland area of Pangalengan, West Java. The treatments consisted of two K fertilizer sources (potassium chloride-KCl and potassium sulphate-K2SO4), two K rates (150 and 250 kg K2O ha -1 ), and three application methods (single, split, and split combined with foliar application). In the single application treatment, K was applied at planting, while in the split application treatment the K was applied half rate at planting and the rest at 6 weeks after planting (WAP). In the split combined with foliar application treatment, the K fertilizer was applied half rate at planting, a quarter rate at 6 WAP and another quarter rate by foliar spraying at 7, 8 and 9 WAP. The results showed that plant height was not significantly affected by the treatment. However, the sources and application methods of K fertilizer affected canopy cover, crop cover weeks (CCW), tuber dry weight (DW), and total plant DW at 10 WAP. Potatoes supplied with K2SO4 either in split or split combined with foliar application had significantly higher percent canopy cover, CCW, tuber DW, and total plant DW than those supplied with K fertilizer in single application. Potatoes supplied with K2SO4 had a higher tuber yield compared to those fertilized with KCl, especially under split or split combined with foliar application. To attain the same level of tuber yield as in the split combined with foliar application method, the rate of K2SO4 should be increased from 150 to 250 kg K2O ha-1 when using single application. It is therefore suggested that K2SO4 for potatoes should be used in split application combined with foliar application.
Manolov et. al. (2005) conducted and studied the influence of potassium fertilizer source (K2SO4 and KCl) on potato yield and quality under pot experimental conditions at the Agricultural University, Mendeleev, Bulgaria. Experiments included increasing rates of the potassium fertilizers providing 200, 400 and 600 mg kg-1 soil K2O and K2SO4 and KCl were the sources. Data indicated no statistical differences in potato yield as a result of potassium fertilizer sources. In contrast, all studied quality parameters with the except for reducing sugars were influenced by potassium sources.
Increasing rates of KCl decreased most severely dry matter, starch and vitamin C contents in potato tubers
which were diminished with 15%, 46% and 50% by potassium 600 treatment, respectively when compared to control.
CHAPTER III
MATERIALS AND METHODS
The experiment was conducted during the period from November 2018 to February 2019 to study the mollifying effect of Phosphorus Dose and Potassium Source on potato tuber. The materials and methods describe a short description of the experimental site, climate condition of the storage room, experimental materials, experimental treatments and design, methods of the study, data collection procedure and procedure of data analysis. The detailed materials and methods that were used to conduct the study is presented below under the following heading:
3.1 Site Description
3.1.1 Geographical location
The experimental area was situated at 23077ˊ N latitude and 90033ˊ E longitude at an altitude of 8.6 meter above the sea level (Anon., 2004).
3.1.2 Agro-Ecological Region
The experimental site belongs to the Agro-ecological zone of “Modhupur Tract”, AEZ- 28 (Anon., 1988). This was a region of complex relief and soils developed over the Modhupur clay, where floodplain sediments buried the dissected edges of the Modhupur Tract leaving small hillocks of red soils as “islands” surrounded by floodplain (Anon., 1988). Appendix I represents the map of the experimental site.
3.13 Climate
Experimental site was located in the subtropical monsoon climatic zone, set aparted by winter during the months from November to February (Rabi season). Plenty of sunshine and moderately low temperature prevails during experimental period, which is suitable for potato growing in Bangladesh. Appendix III represents monthly record 11 of air temperature, relative humidity, railfall and sunshine hour from November'18 to February'19.
3.1.4 Soil characteristics
The soil of the experimental location belongs to the Tejgaon series under the Agro ecological Zone, Madhupur Tract (AEZ-28) and the General Soil Type is Deep Red Brown Terrace Soils (FAO, 1988). In texture, the top soil was Silty Clay, olive-gray with common fine to medium distinct dark yellowish brown mottles.
The experimental site having available irrigation and drainage facilities and situated above flood level. The soil was composed of 26% sand, 43% silt and 31% clay particles and having a texture of sandy loam with organic matter 1.15%.
3.2 Details of the experimental treatment and design 3.2.1 Treatments
The experiment consisted of 2 factors:
Factor A: Doses of Phosphorus (4) 1. P1: 41.84 kg P ha-1 @200 kgha-1 TSP 2. P2: 46.03 kg P ha-1 @220 kg kgha-1 TSP 3. P3: 50.21 kg P ha-1@240 kgha-1 TSP 4. P4: 54.39 kg P ha-1 @260 kgha-1 TSP Factor B: Potassium Sources (3)
1. K1: KCl (250 kg KCl ha-1 @130 kg K ha-1)
2. K2: KH2PO4 (452.19 kg KH2PO4 ha-1 @130 kg K ha-1) 3. K3: K2SO4 (288.6 kg K2SO4 ha-1 @130 kg K ha-1)
There were 12 treatment combinations: viz., P1K1, P1K2, P1K3, P2K1, P2K2, P2K3, P3K1, P3K2, P3K3, P4K1, P4K2, P4K3
3.2.2 Experimental design
The two factorial experiment was laid out in split-plot design with three replications.
The total area was 300 m2 with length 24 m and width 11.33 m. The four doses of Phosphorus were assigned in the main plot and three sources of potassium in the sub- plot. There were 36 unit plots with the size of 2.6 m × 1.2 m. The distance between two blocks and two plots were 1 m and 0.8 m, respectively. The layout of the experiment has been shown in Appendix II.
3.3 Crop / Planting material
The planting materials comprised the certified seed tubers of BARI alu-29 (Courages) varieties of potato.
3.4 Growing of crops
3.4.1 Preparation of the main field
The experimental plot was opened in the 15th November 2019 with a power tiller and left exposed to the sun for a week. Subsequently cross ploughing was done five times followed by laddering to make the land suitable for planting of tubers with eliminated all weeds, stubbles and residues. The soil was treated with insecticides (Cinocarb 3G
@ 4 kgha-1) at the time of final land preparation to protect young plants from the attack of insects such as cutworm and mole cricket.
3.4.2 Application of manure and fertilizer
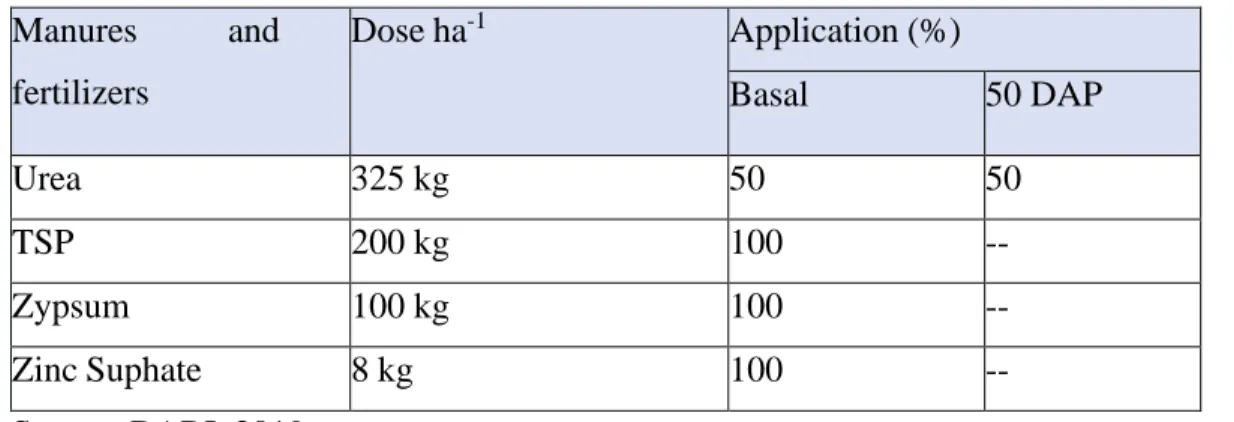
Manures and fertilizers were applied to the experimental plot considering the recommended fertilizer doses of potato and presented in Table 1.
Table 1. Doses and methods of application of manure and fertilizers in the potato field
Source: BARI, 2019
All fertilizers and half urea were applied during final land preparation. Rest amount of urea was applied during 2nd earthing up at 50 DAP. Potassium fertilizer was applied as per treatment and 250, 452.19 and 288.6 kg KCl, KH2PO4 and K2SO4 , respectively was applied for 130 kg K ha-1 .
3.4.3 Planting of potato tubers
The seed tubers were planted at a depth of 5 cm in the experimental plots at 15th November, 2019 with maintaining a distance of 50 cm × 25 cm. The soil along the rows of seed tubers were ridged up immediately after planting.
Manures and fertilizers
Dose ha-1 Application (%)
Basal 50 DAP
Urea 325 kg 50 50
TSP 200 kg 100 --
Zypsum 100 kg 100 --
Zinc Suphate 8 kg 100 --
3.4.4 Intercultural operations
When the seedlings started to emerge in the beds mulch materials were clean-up for easy growth and development of potato seedlings. The crop was always kept under careful observation. After emergence of potato seedlings, various intercultural operations were accomplished for better growth and development.
3.4.4.1 Weeding and mulching
Weeding was done at 30 and 50 DAP (days after planting) to remove the unwanted weeds and mulching was done to conserve soil moisture. Manual weeding was done as and when necessary to keep the plots free from weeds. The soil was mulched by breaking the crust of the soil for easy aeration and to conserve soil moisture as and when needed. Mulching also helped to disturb the emergence of Bathua plants (Chenopodium album) and other weeds. These two operations were done carefully without hampering the luxurious crop health.
3.4.4.2 Earthing-up
Two times earthing up was done at 30 and 50 DAP. The soil along the rows of seed tubers were ridged up immediately after planting. The earthing which was preceded by top dressing of the remaining half of urea and also it was treated as a final earthing-up.
3.4.4.3 Irrigation
Pre emergence irrigation was done seven days after planting of potato tubers as because moisture was not optimum for germination before emergence, light irrigation was done for even emergence of seed tuber. After emergence, four times irrigation was given throughout the growing period.
3.4.4.4 Pests and diseases control
Except cutworm, no other insects were found harmful for potato in growing season.
To protect the soil borne insects Furadan 5G was applied @10kg ha-1 during the final land preparation. Dithane M-45 was applied @ 2 g L-1 at 10 days interval as a preventive measure against late blight (Phytophthora infestans) of potato. This plant growing time was very cold so Dithane M 45 and Rovral 50 WP were applied alternatively at 3 days interval.
3.4.4.5 Haulm cutting
When the potato plants attained maturity the upper portion of the plants were cut down and tubers were kept under the soil for 07 days for skin hardening of potato. This haulm cutting was done at 5th February, 2020.
3.5 Harvesting
The maturity of the tuber crops was determined by the appearance of the yellowish color of the leaves, falling of the stems on the ground and finally drying of leaves.
Harvesting was done at 12th February 2020. The tubers from each plot were harvested manually.
3.6 Data collection
Five plants were randomly selected from the middle rows of each unit plot for avoiding border effect and tagged with a sample card, which was done in plot wise for data recording. Data were collected in respect of the following parameters to estimate the plant growth; yield attributes, yields and quality of potato tubers as affected by different treatments that were used in this experiment. Data on plant height, number of leaves plant-1 , number of stems plant-1 were collected at 30, 45, 60, 75 DAP and at harvest and recorded accordingly. All other yield contributing characters, yield parameters were recorded during harvest and after harvest as per suitability. Quality parameters of potato tubers was estimated in laboratory condition following the standard procedures of estimation as per different quality measures.
3.6.1 Growth, yield parameters and yield of potato
3.6.1.1 Days required for 1 st emergence
Each plot of the experiment was kept under close observation from 10 DAPs to count days required for 1 st emergence of potato seedlings. Total number of days from the date of planting to the visible emergence was counted and recorded accordingly.
3.6.1.2 Days required for 80% emergence
Each plot of the experiment was kept under close observation to count days required for planting to 80% emergence of potato seedlings. Total number of days from planting to 80% emergence was recorded.
3.6.1.3 Days required for planting to harvest
Each plot of the experiment was kept under close observation to count days required for planting to maturity of potato plants. Total number of days from the date of planting to the harvesting was recorded.
3.6.1.4 Plant height
Plant height was measured from sample plants in centimeter from the ground level to the tip of the longest leaf and mean value was calculated. Plant height was also recorded at 15 days interval starting from 30 DAP upto 75 DAP and also at harvest to observe the growth rate of the potato plants.
3.6.1.5 Number of leaves plant-1
The total number of leaves plant-1 was counted from each selected potato plants. Data were recorded as the average of 5 plants selected at random from the inner rows of each plot at 15 days interval starting from 30 DAP upto 75 DAP and also at harvest.
3.6.1.6 Number of stems plant-1
The total number of stems plant-1 was counted from each selected plants. Data were recorded as the average of 5 plants selected at random from the inner rows of each plot at 15 days interval from 30 DAP to 75 DAP and also at harvest.
3.6.1.7 SPAD value of leaf
The SPAD value of leaves was measured at stolen initiation stage at 30 DAP by placing the Spadometer in middle point of any five leaves of each 5 previously tagged plants from in each plot and then the percentage showed by the Spadometer was observed and recorded.
3.6.1.8 Number of tubers hill-1
Total number of potato tubers hill-1 was recorded as the average of 5 plants selected at random from each unit plot at harvest. The total number of tubers were recorded by counting the entire potato hill-1 .
3.6.1.9 Weight of tubers hill-1
Five earlier tagged hills from middle row was selected from each unit plot, and the yield of potato tubers obtained from the hills was collected and weighted and recorded according with expressed in g hill-1.
3.6.1.10 Average weight of individual tuber
Average weight of individual tubers were estimated by dividing the weight of tubers hill -1 with the number of tubers hill-1 as the average of 5 plants selected at random from each unit plot at harvest.
3.6.1.11 Yield of tubers hectare-1
Tubers yield per hectare of potato was calculated by converting the weight of individual tubers yield from a plot and converted yield of tubers into hectare and was expressed in t ha-1 .
3.6.1.12 Seed Potato
The harvested potato tubers from 5 plants of each unit plot were graded as seed potato (28-55 mm) and expressed in percentage.
3.6.1.13 Non-seed potato
The harvested potato tubers from 5 plants of each unit plot were graded as non-seed potato (55 mm) and expressed in percentage.
3.6.2 Quality of potato
3.6.2.1 Grading of potato tubers
The harvested potato tubers from 1 m2 area of each unit plot were graded in to four size grades (55 mm) and expressed in percentage.
3.6.2.2. Category of potato tubers for different uses
The harvested potato tubers from 1 m2 area of each unit plot were classified for different purposive uses i.e. Canned (25-35 mm), Chips (>45 mm) and French fry (>75 mm), potato and expressed in percentage.
3.6.2.3 Firmness score in potato tubers
Firmness score was estimated by using pressure gauge. For the estimation of firmness firstly the potato tubers was divided into two then created pressure using pressure gauge and recorded the reading from pressure gauge.
3.6.2.4 Estimation of Total Soluble Solids (TSS) in potato tubers
Total Soluble Solids (TSS) of harvested tubers was determined after harvest in a drop of potato juice by using Hand Sugar Refractometer "ERMA" Japan, Range: 0-32%
according to (AOAC, 1990) and recorded as obrix from direct reading of the instrument.
3.6.2.5 Dry matter content of potato tubers
At first selected tubers were collected, cut into pieces and was dried under sunshine for a 3 days and then dried in an oven at 700C for 72 hours. The sample was then transferred into desiccators and allowed to cool down at room temperature. The final weight of the sample was taken. The dry matter contents in potato tubers were computed by simple calculation from the weight recorded using the following formula:
Dry matter content in stem (%) =Dry weight of potato tubers
Fresh weight of potato tubers× 100
3.6.2.6 Estimation of specific gravity of potato tubers
Specific gravity of potato tubers was measured by using the following formula (Gould, 1995). Five tubers were taken from each plot after harvest of treatment and then the means were taken.
Specific Gravity =Wa
Ww100
Where,
Wa= Weight of tuber (g) in air and
Ww= Weight of tubers (g) in fresh water at 40C
3.6.2.7 Estimation of starch content of potato tubers
Starch content of potato tubers was determined after harvest by Somogyi-Nelson method (Nelson, 1944). Phosphate buffer solution was prepared through diluted 0.74g NaH2PO4∙2H2O and 0.09 g Na2HPO4.12H2O into 100 ml Distilled water. Added 0.1 g Enzyme (Amyloglucosidase) and mixed well. Kept at 200C for the preservation. The residue remained after extraction for sugar was washed for several times with water to ensure that there was no more soluble sugar in the residues. After that using tap water and mark up to 250 ml beaker. Stirred well on a magnetic stirrer. Then 0.5 mL solution was taken from the beaker during stirring into 3 test tubes. Boil the test tubes for 10 min at 1000C. Add 1 ml Amyloglucosidase solution, mix well, and heat at 50-600C for 2 hours in hot water. After cooling, add 0.5 ml Copper solution, mix well, heat at 1000C for 10 min., cool in tap water, add 0.5 ml Nelson solution, mix well, add 7 ml distilled water, mix well (Final volume = 9.5 ml), and measure the absorbance at 660 nm (Abs) Starch content was calculated using the glucose standard curve.
3.6.2.8 Estimation of vitamin C (ascorbic acid) content in potato tubers
Quantitative determination of ascorbic acid content of potato tubers from different treatment was estimated (AOAC, 1990) at Bangladesh Council of Scientific and Industrial Research (BCSIR), Dhaka. The applied method was as follows:
Reagents
i) Metaphosphoric acid solution (3% HPO3): Prepared by dissolving pellets of HPO3 in glass distilled water.
ii) Standard ascorbic acid solution: 100 mg of ascorbic acid was weighted, dissolved and made up to 100 ml with 3% HPO3 and diluted to 0.1 mg/ml (10 ml HPO3 of 1 mg/ml) immediately before use.
iii) Dye solution: Fifty milligram of 2, 6-Dichlorophenol indophenol was dissolved in approximately 150 ml of hot glass distilled water containing 42 mg of sodium bicarbonate. The mixture was cooled, diluted with distilled water upto 200 ml, stored in a refrigerator and standardizes every day before use.
Procedure
Five (5) grams of fresh potato tuber sample was crushed in a mortar and mixed well with 3% HPO3 upto 100 ml in a volumetric flask. It was
filtered with whatman filter paper 40. Then 5 ml aliquot of HPO3 extract of the sample was taken and titrated with dye solution.
3.6.2.9 Estimation of sugar content of potato tubers
For the analysis of sugar content like reducing sugar glucose potato flesh was extracted. For each extraction, 1 g fresh sample of chopped potato was taken from uniform tuber samples and smashed well in a motor. Sugar was extracted using 5 ml of 80% ethanol heat at 800C for 30 min using a dry block heat bath and the extracts was centrifuged at 5000 rpm for 10 min and decanted the supernatant. 8 mL 80% EtOH, was added and it was repeated 4 and 5 times in total. All the supernatants were mixed well and the final volume was made up to 25 mL using 80% EtOH. The residue is used for sugar analysis. Reducing sugar was estimated by the photometric adaptation of the Somogyi method (Nelson, 1944) with some modification. Copper solution and Nelson reagent and standard glucose solution (0.5 ml) were used. 3 mL sample solution was put into a small glass container. Then it was completely dried up on an electric heater, 3 mL distilled water was added and then mixed well. Then 0.5 ml solution was taken from that, two times and was put in different test tubes. In one test tube, 0.5 ml Copper solution was added and was boiled (1000C) for 10 min. After boiling, immediately the test tube was cooled in tap water. 0.5 mL Nelson reagent in the test tube was added, and mixed them well. After 20 min, 8 mL distilled water was added and mixed well (Total volume = 9.5 ml). After that the absorbance at 660 nm (Abs1) was measured and the reducing sugar content was calculated.
3.7 Statistical analysis
The data obtained for different characters were statistically analyzed to find out effect and the significance of the difference for Phosphorus dose and Potassium Sources on yield, yield contributing characters and quality of potato. The mean values of all the recorded parameters were evaluated and analysis of variance was performed by the ‘F’
(variance ratio) test using MSTAT-C software. The significance of the difference among the treatment and treatment combinations of means under the experiment was estimated by Duncan’s Multiple Range Test (DMRT) at 5% level of probability (Gomez and Gomez, 1984).