A Decision Support System of Choosing Groups (Science/ Business Studies/
Humanities) for Secondary School Students in Bangladesh By
Rifat Hasan ID: 161-15-6938 Md. Khairul Alam Ovy
ID: 161-15-6979 And
Ifrat Zahan Nishi ID: 161-15-6710
This Report Presented in Partial Fulfillment of the Requirements for the Degree of Bachelor of Science in Computer Science and Engineering
Supervised By Md. Azizul Hakim
Lecturer Department of CSE Daffodil International University
Co-Supervised By Md. Abdus Sattar Assistant Professor Department of CSE Daffodil International University
DAFFODIL INTERNATIONAL UNIVERSITY
DHAKA, BANGLADESHDECEMBER, 2019
ii
© Daffodil International University
iii
© Daffodil International University
iv
© Daffodil International University
ACKNOWLEDGEMENT
At first, we thanks to Almighty Allah for His kindness without which we wouldn’t be able to complete this project. We needed to strive to take care of business yet we are thankful to some other individuals, without the assistance of whom this venture couldn't be for what it's worth. We attempted our best lastly this exploration based task is finished.
We really greatful to our Supervisor Md. Azizul Hakim, Lecturer and Co-Supervisor Md. Abdus Sattar, Assistant Professor, Department of CSE Daffodil International University, Dhaka. Deep Knowledge & keen interest of our supervisor and in the field of
“Machine learning and Data mining” helped us to carry out this project. This entire time he has uphold us, enlivened us and demonstrated us to the correct way. His endless patience, scholarly guidance, continual encouragement, constant and energetic supervision, constructive criticism, valuable advice, reading many inferior draft and correcting them at all stage have made it possible to complete this project.
We also are grateful to those managements and teachers who have let us and helped us to collect the necessary data to conduct this project. Without those data, it was impossible to continue our research correctly. We additionally need to our offer our most profound thanks to noteworthy Professor and Head of CSE department, Prof. Dr. Syed Akhter Hossain.
Finally, we must acknowledge with due respect the constant support and belief of our Parents.
v
© Daffodil International University
ABSTRACT
As education is the only way to turn a person into human resource, every country tries to give her citizens proper scope of bringing out their inner ability by offering the appropriate education. According to the education system of Bangladesh, an 8th grade completing student has to choose a group (science, commerce, humanity) for further studies. This group will be his/her initial highway for higher education. But it is a matter of sorrow that, in Bangladesh this crucial event is done by some rumors and some traditional old school ways, which are mostly wrong and destructive. From the perspective of this country, the only way of choosing those groups is previous result. Of course, result is one of the most important attribute, but it should not be the only thing. Again in this country, Science is thought to be superior than other groups. That’s why, parents have the tendency to impose this group to their children without knowing their ability and interest and leads them towards an uncertain future. Therefore, the aim of this paper is to build a model of group selection by analyzing some random attributes of higher level students who have already gone through this event of selecting groups with the help of data mining and some machine learning algorithms, so that a newly 9th grade student could have the proper direction of selecting a group which is best for him/her.
vi
© Daffodil International University
TABLE OF CONTENTS
CONTENTS PAGE
Declaration iii
Acknowledgements iv
Abstract v
CHAPTER CHAPTER 1: INTRODUCTION 1-5
1.1 Introduction 11.2 Motivation 2
1.3 Rationale of the Study 3
1.4 Research Questions 3
1.5 Expected Outcome 4
1.6 Layout of the Report 5
CHAPTER 2: BACKGROUND STUDY 6-10
2.1 Introduction 62.2 Related Works 7
2.3 Research Paper Summary 8
2.4 Challenges 10
CHAPTER 3: RESEARCH METHODOLOGY 11-25
3.1 Introduction 113.2 Overview of Machine Learning (ML) 11
3.3 Data Collection and Preprocessing Procedures 12
vii
© Daffodil International University
3.3.1 Data Collection 12
3.3.2 Data Preprocessing 14
3.3.3 Attributes 15
3.4 Research Subject and Instrumentation 17
3.4.1 Naïve Bayes Classifier 18
3.4.2 Decision Tree 19
3.4.3 Random Forest 21
3.5 Statistical Analysis 22
3.6 Proposed Model 24
CHAPTER 4: EXPERIMENTAL RESULTS AND DISSCUSSION 26-31
4.1 Introduction 264.2 Experimental Results 26
4.3 Descriptive Analysis 28
CHAPTER 5: LIMITATIONS, FUTURE WORK & CONCUSION 32
5.1 Limitations 325.2 Future Work 32
5.3 Conclusion 32
REFERENCES 33-34
viii
© Daffodil International University
LIST OF TABLES
TABLES PAGE NO
Table 2.3.1: Research paper summary 9
Table 3.3.2.1: Group wise number of instances after preprocessing 15
Table 3.3.3.1: Description of the attributes. 16
Table 3.5.1: Classification Accuracy of Different ML Algorithms 23 Table 4.2.1: Training and Testing Instances on Different Evaluations. 26 Table 4.2.2: Performance Analysis Parameters Algorithms on 10-Fold
Cross Validation
27
Table 4.2.3: Performance Analysis Parameters Algorithms on Percentage Split
27 Table 4.2.4: Performance Analysis Parameters Algorithms on
Independent Testing
28
ix
© Daffodil International University
LIST OF FIGURES
FIGURES PAGE NO
Figure 3.2.1: Overview of Machine Learning (ML) 11
Figure 3.3.1.1: Data Collection form 12
Figure 3.3.1.2: Percentage view of training dataset 13
Figure 3.3.1.3: Percentage view of testing data 14
Figure 3.3.3.1: Training dataset 17
Figure 3.4.2.1: Structure diagram of a decision tree 20 Figure 3.4.3.1: Decision making using random forest. 21
Figure 3.6.1: Proposed Model Structure 25
Figure 4.2.1: accuracy comparison of same methods in different evaluation processes.
30
1
© Daffodil International University
CHAPTER 1 INTRODUCTION
1.1 IntroductionBecause of the high speed of civilization, the world is developing day by day. A competition is going on between the countries on the matter of development. In this strong competition, instead of proving themselves in various sectors in front of the whole world, where is the place of the country called Bangladesh! After these many years of the birth of Bangladesh, it wouldn’t be so much wrong, if said that, the nation is still considering
“becoming part” of the competition of development of world civilization as their success.
Undoubtedly by modern education system and its implementation, the nation not only can keep running on this competition, but also could become a self-reliant nation.
In this era of transcendent civilization, people are so much concern about their children’s future. But making strong base of prosperous future, proper education is the only way. And affirming this “proper education” is the duty of parents, society, country. In Bangladeshi education system, an 8th grade completing student have to take may be the most important decision of his/her student life, that which field he/she should take for further studies.
He/She has to choose a group from Science, Arts and humanities. But because of some wrong ways and the tendency of imposing things of our society, this crucial event of a student turns into a disaster. Instead of giving attention on a student’s capabilities, merit and desires, the attention is unfortunately given on the last one year’s result.
According to the Ministry of Education, Bangladesh, the numbers of passed students in SSC and HSC in 2019 are 1811179 and 900931 respectively [1]. The numbers are even more than total number of population of many developed countries. However, the country is still could not overcome the lack of expert manpower in the work fields. Every year, thousands of students completing their higher studies, but most of them could not contribute their country. “Improper education” is certainly responsible for this along with
2
© Daffodil International University
some other points which are not relevant to this paper. And this problem will remain until a connection is built between student’s education and their capability and desires.
In selecting groups for s student, three points should be in concern, ability, interest and academic result. This cannot be denied that, the types of study and workload are pretty much different between mentioned three groups. By knowing a student’s previous performance and ability, it is possible to get an idea of choosing the best group for the student. Again the personal interest of a student must be given importance, because only the connection of a person’s merit and interest can reveal the best of him/her.
The main goal of this paper is aiding students in selecting groups (Science, Commerce, Humanities) where they could reveal their talent after completing 8th grade by knowing their ability, interest and performance.
1.2 Motivation
Bangladesh is a small country with the area of only 147,570 square kilometers. But it has a huge population of over 160 million. The only way of turning this population problem into human resource is to place people on accurate playing field according to their potentiality.
Undoubtedly, the state has taken many initiatives to deliver education to each doorstep. As a result, the adult literacy rate of Bangladesh has been increased more than 26% over last 10 years (2007-2017). According to UNESCO, Bangladesh has an adult literacy rate of 72.89%, while male literacy rate is 75.7% and for female is 70.09% [2]. Bangladesh is dealing with this illiteracy problem successfully. But a new problem is rising parallelly, which is unemployment. Bangladesh is fulfilling peoples’ right of education, but she can’t get skilled manpower from this educated population. Lack of potentiality wise proper education can be amnestied for this problem. If it is possible to assign these people to their proper field of education, this problem could be solved. Accurate group selection on the secondary education level could be a way of this solution. To find out the influencing
3
© Daffodil International University
factors in selecting groups in secondary level, we came up with a plan to build a model using data science and some machine learning algorithms.
For predictive models, some machine learning algorithms work very well through the developments over last few years. In this paper, we have tried these algorithms on some real life data to make a model as much accurate as possible.
1.3 Rationale of the study
Over the past two decades, Machine learning (ML) has become one of the mainstays of information technology and with that, a rather central, albeit usually hidden, part of our life [3]. Machine learning is a part of artificial intelligence (AI) where the term refers to the ability of the systems to independently find the solutions to problems by recognizing the patterns in a specific amount of data. A computer learns from previously done mistakes by analyzing data again and again and become expert on that task that was previously considered too much complex. The development of this system to analyze students’ data has provided better understanding on how some attributes of the day to day life can define a person’s potentiality and interest.
Decision making models are now often constructed using machine learning algorithms for many computer systems that ease our day to day life. In this paper, we will discuss how machine learning algorithms can become crucial part of taking decisions on group selection for secondary level students of Bangladesh, by analyzing some real life data and finding appropriate patterns on those data.
1.4 Research Questions
Does it identify the exact influencing factors of deciding a perfect group for a newly secondary school student from his daily life style?
Which algorithms can make mostly accurate model for this type of decision making?
4
© Daffodil International University
In Bangladesh, people still use some stereotype procedures for this type of decision making, where evaluating only last examination or performance is one of those so called ways. Here, personal interest, opinion or ability of students have no value. In this revolutionary era of technology, we hand over our kids’ future to some old school rumors, which is not fair. For that reason, we have constructed a framework, that considers some attributes of a student’s daily life and gives a best possible decision about in which group (Science, Business Studies, Humanities) a student should go. But for that, a student has to supply information on those attributes 100% honestly without any kind of psychological manipulation. After some research, we have come to know that, there are no such kind of framework for choosing field of education on the perspective of Bangladesh. So we have chosen this topic to for our exploration theme and furthermore taken attempt to make a decent enough framework for deciding study fields for students.
1.5 Expected Outcome
Our decision making system helps to generate best possible result on given data according to our dataset. The success of this model depends on the perspective of training and testing data. To evaluate the model, we will have applied three types of evaluation process. Firstly, we apply cross validation. In the second type of evaluation, the dataset will be divided and 70% of data will be used as training data and the remaining 30% will be used for testing.
Finally, we will use full dataset as the training set and supply some independently collected data as the testing data. As not much work has done previously on this field, we don’t expect very much high level of accuracy. We apply various machine learning strategy on this dataset. Then we will take that algorithm as our final strategy, which one returns pretty much decent accuracy on all of those three type of evaluation.
5
© Daffodil International University 1.6 Layout of the Report
Chapter 1 has the introduction of this paper along with motivation for the research, rationale of the study, research questions and expected outcome.
Chapter 2 has the background analysis and the paper related previous works and also the summary of the analysis with problems and challenges.
Chapter 3 has the explanation of the research methodology about how the research has done with the procedural analysis.
Chapter 4 has the discussion on the experimental results.
Chapter 5 has the summery, conclusion, recommendations and implications for future study.
6
© Daffodil International University
CHAPTER 2
BACKGROUND STUDY
2.1 IntroductionIn Bangladesh, the literacy rate has jumped from 19.7 percent to 72.9 percent over past 38 years which is a great example for many other regions of this world. After the independence of this country in 1971, the total education system has been reformed several times by many western models. After every five years (almost) a new government is formed with its new policy. Leaders come with their new concepts and curriculums including different initiatives in education sector. But at the end of the day, amount of amount of skilled literate persons remains very poor.
In the country’s system, the secondary education level is one of the most valuable and precious time for students because in this time, they determine their ambitions and formulate their dreams. They have to choose their future field of study in this phase (Science/ Business Studies/ Humanities). But this is very much difficult for them to choose the appropriate group in that premature age. That’s why the job is done by some kind of management like family or school. Nobody wants to know what the students wants or how much capable they are. The decision is taken considering the result of just one examination which definitely cannot reflect their ambitions or potentialities clearly. As a result, at the middle of their education, many of them just got distracted from the line due to some factors which have not been considered before and for that, the country is producing so called literates without skills more and more. This is a major drawback in this country’s education system.
In this chapter, the discussion will be done about some similar decision making or prediction making systems and research papers. It was not easy to make the system at all.
Many challenges have to be faced in every step. In this part, that challenges will also be discussed.
7
© Daffodil International University 2.2 Related Works
We could not find any similar works that have been done in this exact sector from the perspective of Bangladesh. It seems like this topic has been neglected all the times and not given proper importance. However, we have found some similar decision or prediction making systems that have inspired and guided us to conduct this research. Those few research works are described shortly below.
Prediction Students Interest on Different Majors in STEM Filed:
This research is conducted in united states by two researches Eric Lichtenberger from Southern Illinois University, Edwardsville and Casey George-Jackson from University of Illinois [4]. The goal was predicting high school students’ interest in majoring in a STEM field after postsecondary period. STEM means the work field of science, technology, engineering and mathematics. the authors have conducted this research on the basis of identifying three main themes; motivation and interest of the students, their academic qualification, and educational context. Because these three themes appeared to be very influential on students’ participation and success in STEM fields. The authors have used a big dataset having about 27000 samples. Data were collected from state’s board of higher education and ACT. The dataset has about 30 attributes under internal, family and school context. The authors have used logistic regression to make the predictions which returned a good result.
Students’ Performance Prediction:
The research was conducted by Amjad Abu Saa from Ajman University of Science and Technology, UAE. The goal of this research was to predict students’ performance in higher education and find a way to build a quantitative model which can classify and predict students’ performance on the basis on relevant personal and social factors [5]. Author used a dataset including 270 instances and 21 attributes initially. The sources of the data were different colleges in Ajman University of Science and Technology. For the research, four different decision trees including C4.5, ID3, CART, CHAID and Naïve Bayes algorithms
8
© Daffodil International University
are used. The author has found the accuracy from 33-36% in different algorithms which is not so much good result. But the research process of this researcher inspired us. So we reviewed this paper.
Systematic Review of Predicting Students’ performance:
Mukesh Kumar and Yass Khudheir Salal, these two authors have done this research. This is a comparative research where authors have compared some research processed on performance prediction and extracted the common things from them [6]. Researchers have reviewed 47 papers to make this paper. They have found, in about all the researches, researchers have used 7 common attributes for the prediction that are described in [6].
Among all the used algorithms, decision tree has the maximum accuracy of 98.86%, when the neural network has 98.00%, SVM has 98.00%, Naïve Bayes has 91.57% and K-nearest algorithm has 83% of accuracy.
Study of Influencing Factors of Academic Performance of Students:
The study was performed by V. Ramesh, P. Thenmozhi and K. Ramar. The goal of the study was finding association between the different factors that influence the performance and compare different classification algorithms for classifying students [7]. To do this research a dataset of 464 instances has been used. The data were collected from different colleges that includes personal, social economical, psychological and school, college related information. After preprocessing, 23 attributes were selected. Naïve Bayes, MLP, SMO, J48, REPTREE, Random Tree and Decision Table were used that have the accuracy of 51-69% which were acceptable.
2.3 Research Paper Summary
Table 2.3.1 shows the summary of the research papers that have been described in previous section.
9
© Daffodil International University Table 2.3.1: Research paper summary
SL.
No.
Authors’
Name
Workings Used Methods Outcomes Publishing Year
1 Eric
Lichtenberger, Casey George-
Jackson
Predicting high students’
interest on majors of STEM field.
Logistic Regression
Found that demographics
played significant role on these
interest
2013
2 Amjad Abu Saa
Performance Prediction of
Students
C4.5, ID3, CART, CHAID and Naïve Bayes
33-36 % accuracy found
2016
3 Mukesh
Kumar, Yass Khudheir Salal
Comparing different methods used
for performance
prediction
Decision Tree, Neural Network, SVM, Naïve
Bayes, K nearest
83-98%
accuracy found commonly
2019
4 V. Ramesh, P.
Thenmozhi and K. Ramar
Finding influencing
factors on performance
of students
Naïve Bayes, MLP, SMO, J48,REPTREE,
Random Tree, Decision Table
51-69%
accuracy found
2012
10
© Daffodil International University 2.4 Challenges
Our main challenge to collect real data as there is no available dataset or database on this topic in Bangladesh. First we decided to collect data by online, but could not get that much response. So we had to collect data personally. We had to collect permissions from the respective educational institutions and then had to go several classrooms of these institutions to collect data from the students.
After that, we had to deal with the mission data. After solving this problem, we separated the standard data that are suitable for our research. We preprocessed the data and finalize the datasets.
Then we had to study different machine learning algorithms so that we could analyze the best result for the research. We had to get used to with the Weka environment so that we could use it to analyze data and interpret the results.
By facing all these challenges, we have finally completed our research.
11
© Daffodil International University
CHAPTER 3
RESEARCH METHODOLOGY
3.1 IntroductionIn this section, whole process of this research will be described including the overview of the used algorithms, obtaining process of data and their evaluation techniques.
3.2 Overview of Machine Learning (ML)
Machine learning usually refers to the changes in systems that perform tasks associated with artificial intelligence (AI) which involve data analysis, prediction, forecasting, knowledge discovering etc.
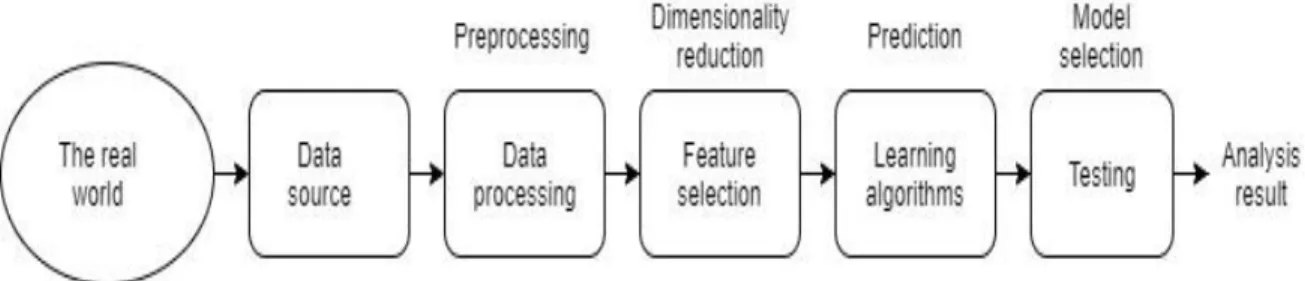
The main goal of machine learning algorithms is constructing mathematical models from given data. By analyzing sample data, machine learning process can make a better decision with better accuracy. There are mainly two types of data that are needed for machine learning process. They are training data and testing data. Training data are used to make the model. More precisely, training data are used to adjust the parameters of the mode. Test data are used for final evaluation that the model goes through after the training phase. The performance and the accuracy are determined by using these test data. The flowchart of machine learning process is shown in figure 3.2.1.
Figure 3.2.1: Overview of Machine Learning (ML)
12
© Daffodil International University
3.3 Data Collection and Preprocessing Procedures 3.3.1 Data Collection
To make expected model, data were needed from those students who have already passed through the secondary and higher secondary education level. Because from those students, it is possible to know after choosing groups in secondary level, whether they were compatible with their groups or not. For this model, information of those students were needed, who are considered to be suitable with their respective group. But initially, data from all types had been collected as it is impossible to filter data at initial stage.
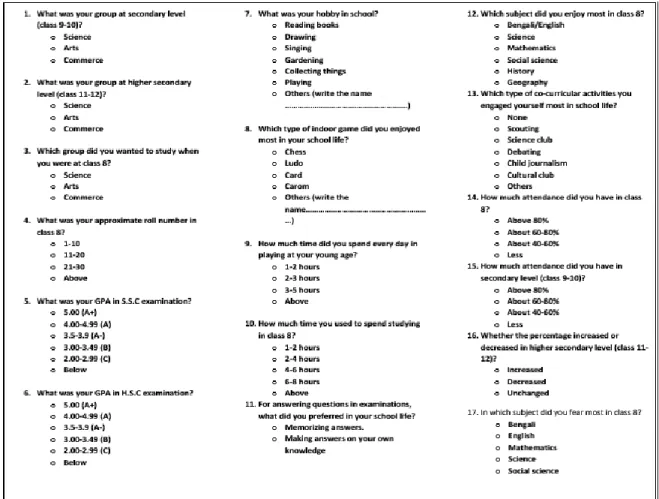
Figure 3.3.1.1 shows the data collection form that has used in this information collecting process
Figure 3.3.1.1: Data Collection form
13
© Daffodil International University
Data for this project were collected from three educational institutions. For training dataset, collection process had performed at “Daffodil International University, Sobhanbag, Dhaka” and “New Model Degree College, Sukrabad, Dhaka”. For testing purpose, data had been collected from “Chandpur Government College, Chandpur”.
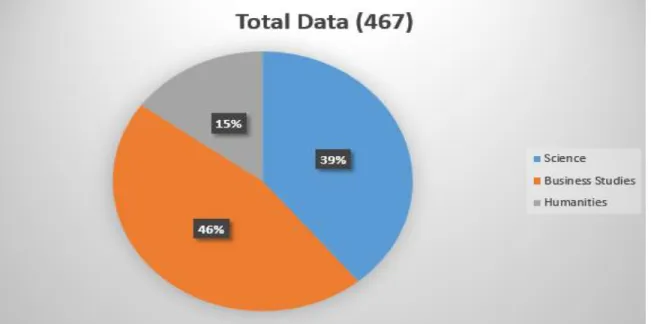
The training dataset initially had 467 instances in total. Amongst them, 183 were from science background, 214 were from business studies background and 70 were from humanities background.
Figure 3.3.1.2 shows the amount of the data of different groups in percentage.
Figure 3.3.1.2: Percentage view of training dataset
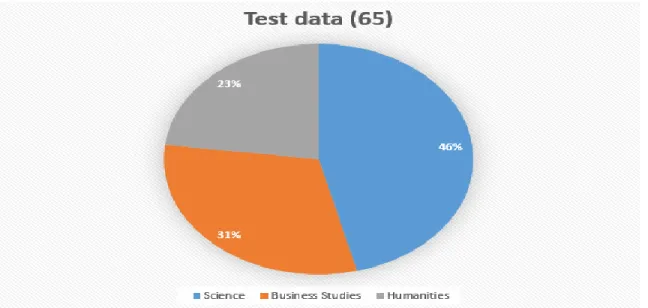
In collected testing data, there are total 65 instances where 30 from science background, 20 from commerce background and 15 from humanities background. Figure 3.3.1.3 is the percentage view of total test data
14
© Daffodil International University
Figure 3.3.1.3: Percentage view of testing data
3.3.2 Data Preprocessing
Today’s real world data are highly susceptible to noisy, missing, inconsistent data due to their huge sizes and their likely origin from multiple, heterogeneous sources [8]. Low quality data leads to low quality mining results.
Data preprocessing is a technique of data mining where real world raw data are transformed into understandable standard form. As mentioned earlier, to construct the expected model, data from those students would be needed who can be considered as standard students to their respective groups according to their later performance. For this, the data of those students were eliminated who had changed their groups in higher secondary level or who could not get at least grade ‘A-’ in both S.S.C and H.S.C examination. Changes in the attendance percentage in secondary and higher secondary level have also been analyzed.
But it has found that, changes in attendance have not that much influence on students’
performance although attendance in class 8 has a little bit influence on defining students’
capacity of attentiveness.
There were also very few missing values in some instances. Though the amount is very little, these still create some problems during data mining processes. The problem of the missing values has been handled by using “Most Frequent”. Most Frequent is a method in
15
© Daffodil International University
which the missing value on a certain attribute is replaced by the most frequent value of the available cases [9]. This method is easy to use and useful when a standard form of dataset is needed.
After performing above procedures, the amount of instances on both training and testing datasets have been reduced where training dataset has 319 instances and test dataset has 45 instances.
Before using these data to build model, some unnecessary attributes had to be removed.
Information on some attribute were taken during data collection period because they were needed to determine standard and nonstandard instances. After separating instances, those attributes were no longer useful. That’s why they were removed from final training and testing datasets.
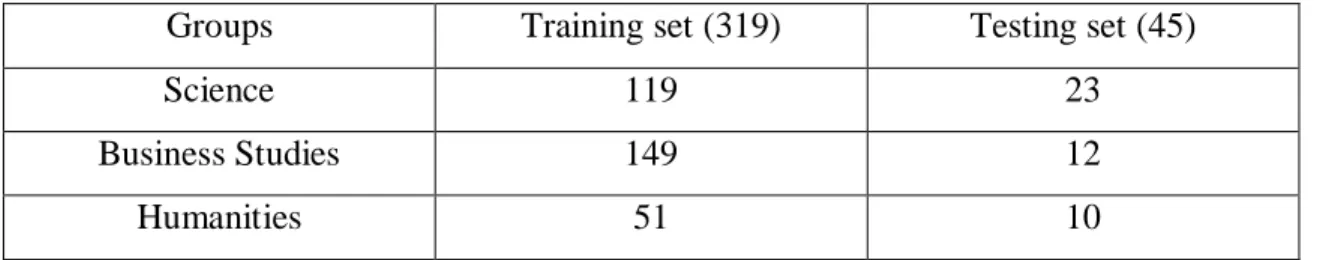
Table 3.3.2.1 shows the amount of instances on both training and testing datasets according to groups.
Table 3.3.2.1: Group wise number of instances after preprocessing
Groups Training set (319) Testing set (45)
Science 119 23
Business Studies 149 12
Humanities 51 10
3.3.3 Attributes
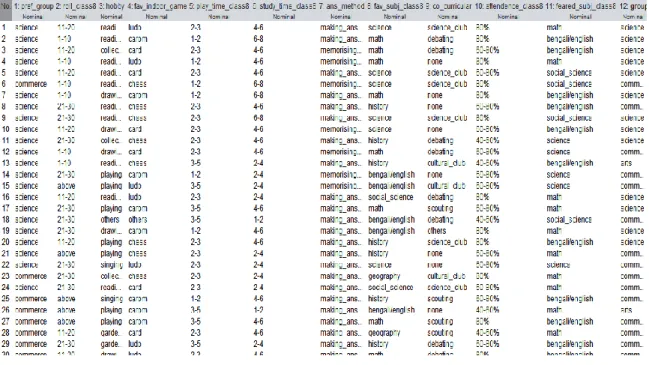
Both of the obtained datasets contain 12 attributes. The goal of collecting those attributes was to find any kind of pattern in their lifestyle that identify their potentiality, interest and capacity and in which group they have done well with those qualifications, so that a system could understand, for which type of attributes a student should take a specific group. The names of the attributes are used in short forms which are described clearly in table 3.3.3.1
16
© Daffodil International University Table 3.3.3.1: Description of the attributes.
SL No.
Name of the attributes Description
1 pref_group The group that the student wanted to study in
2 roll_class8 Roll number in class 8
3 hobby Hobby that the student often do in school life 4 fav-indoor_game Favorite indoor game during school life 5 play_time_class8 How much time the student used to spend playing
when he/she was in class 8
6 study_time_class8 How much time the student used to spend studying when he/she was in class 8
7 ans_mathod Whether he/she preferred to answer question in exam by memorizing answers or by writing on his
own knowledge. This was for understanding a student’s thinking or memorizing capability.
8 fav_subj_class8 The subject in which the student was fluent in class 8
9 co_curricular Which type of co-curricular activities the student engage himself most in school life
10 attendance_class8 How much attendance did the student has in class 8 11 feared_subj_class8 The subject that the student feared most in class 8 12 group The group that the student finally studied. This is
the class attribute in both datasets.
The data were collected in a manner that all the data of the attributes could be in nominal form. Figure 3.3.3.1 shows a portion of the original dataset.
17
© Daffodil International University
Figure 3.3.3.1: Training dataset
3.4 Research Subject and instrumentation
Machine learning, a key building blocks of AI, has been a part of the technical world since the 1950s, when earliest programmers asked computers to make sense of large sets of data [10]. By the help of quantifiable strategies, AI algorithms enable computers to analyze data automatically. Now a machine can find the precedence of data and make decisions without the help of express coding, which is the most interesting part. Even data from different regions can be compared easily.
There are some particular processes of AI for implementation. Some are more suitable for numeric data and some are suitable for nominal or categorical. Some are called supervised and some are called unsupervised. The datasets used on the model of this paper are nominal datasets. After trying an amount of algorithms, some supervised algorithms are selected to use according to their performance on the datasets.
The data analysis tool used in this model is Weka 3.8.3 which is pretty good in analyzing and easy to use and interpret. Some short descriptions of the algorithms used are given underneath.
18
© Daffodil International University 3.4.1 Naïve Bayes Classifier
The Naïve Bayes is a heavily simplified Bayesian probability model [11]. The naïve Bayes classifier operates on a strong independent assumption [11]. Here all attributes are independent on the basis of probability. That means the probability of one attribute does not affect others’ probabilities. For example, a playing item may be considered as tennis ball if it is bright green, round in shape and about 10cm of diameter. Naïve Bayes classifier considers that each of those features contribute independently to the probability that the item is a tennis ball and also there are no correlations between color, shape and size features.
The classifier was first introduced into the text retrieval community in the early 1960s [12].
Naïve Bayes works on the principles of Bayesian theorem. The Bayesian theorem can be written here as,
𝑃(𝑦|𝑋) =𝑃(𝑋|𝑦)𝑃(𝑦)
𝑃(𝑋) … … … … . . (1)
In the theorem, y is the class variable or class attribute and X variable represents he features or remaining attributes. Here X is given as,
𝑋 = (𝑥1, 𝑥2, 𝑥3, … . . 𝑥𝑛) … … … … . (2)
x1, x2, x3… can be defined as different features. By giving these features to the actual equation, the Bayesian equation is,
𝑃(𝑦|𝑥1,𝑥2, … 𝑥𝑛) = 𝑃(𝑥1|𝑦)𝑃(𝑥2|𝑦) … 𝑃(𝑥𝑛|𝑦)𝑃(𝑦)
𝑃(𝑥1)𝑃(𝑥2) … 𝑃(𝑥𝑛) … … . . (3)
19
© Daffodil International University
For all entries, the denominator is static and can be removed. So a proportionality can be introduced to the Bayesian theorem,
𝑃(𝑦|𝑥1,𝑥2, … 𝑥𝑛) ∝ 𝑃(𝑦) ∏𝑛 𝑃(𝑥𝑖|𝑦) … … … … (4)
𝑖=1
From this proportionality, y can be identified where class variable has only two outcomes.
But some cases could have the class variable (y) which is multivariate. Therefore, it is needed to find the maximum of probability of y.
𝑦 = 𝑎𝑟𝑔𝑚𝑎𝑥𝑦𝑃(𝑦) ∏𝑛 𝑃(𝑥𝑖|𝑦) … … … . . (5)
𝑖=1
From the above equation, anyone can find the class (y) with the highest probability.
Naïve Bayes algorithms are mainly used in spam filtering, decision giving systems etc. By preprocessing data appropriately, Naïve Bayes has strong competitors of more advanced methods including Support Vector Machines (SVM) [13].
3.4.2 Decision Tree
The decision tree is one of the classification techniques which is done by the splitting criteria [14]. It is a supervised classifier and one of the most powerful tool that can be used for nominal or numeric data for classification. In machine learning, decision tree is a representation of tree structured form of data. It classifies the data starting from the root of the tree that has no incoming edges and ends at a leaf node that has no outgoing edges.
Decision tree is constructed by root node, leaf nodes, decision nodes, edges. Figure 3.4.2.1 is the structure diagram of a standard decision tree.
20
© Daffodil International University
Figure 3.4.2.1: Structure diagram of a decision tree
Three basic algorithms are widely used for decision tree that are ID3, C4.5, CART [15].
C4.5 is one of the decision tree algorithms generated by Quinlan [16]. It is the expanded version of principles of Iterative Dichotomiser 3 (ID3) where it can replace irrelevant branches with leaf nodes. C4.5 is based on the information gain ratio that is evaluated by entropy [10].
The pseudocode for building decision tree is, i. Check the above cases [17].
ii. For each attribute a, find the normalized information gain ratio from splitting on a [17].
iii. Let a_best be the attribute with highest normalized information gain [17].
iv. Create a decision node that splits on a_best [17].
v. Recur on the sub lists obtained by splitting on a_best, and add those nodes as children on one [17].
21
© Daffodil International University
For the research purpose of this paper, J48 machine learning algorithm is used among decision trees which is a java implementation of C4.5 in Weka.
3.4.3 Random Forest
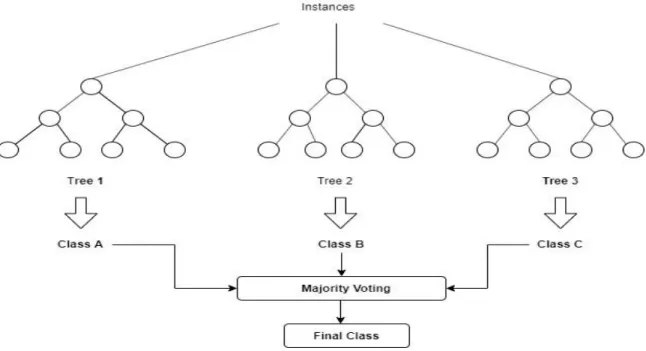
Random forest is a supervised type of algorithm which builds multiple trees and combines them to get better accuracy. Classification and regression both can be done by using this algorithm. In this process, multiple decision trees are created by randomly selected data samples. Then predictions or decisions are taken from each tree. Random forest provides the decision or prediction by a majority vote over the individual trees’ prediction [18].
Figure 3.4.3.1 shows the decision making process random forest.
Figure 3.4.3.1: Decision making using random forest.
Suppose a person A decided to ask his friends about their experience on going different restaurants. A asked them to give him a suggestion about which restaurant will be best for
22
© Daffodil International University
dinner. Each of the friends recommended him a restaurant. Now A has a list of recommendations. After that, he asked his friends to vote for a restaurant from the list of recommendations. After voting, the restaurant with the highest number of votes will be selected as the final decision. That’s how the random forest works.
Random forest can also be used in determining the rank of importance of the attributes in a dataset. The technique is described briefly in Leo Breiman’s original paper on random forest algorithm in [19]. Random decision forests correct for decision trees’ habit of overfitting to their training set [20].
3.5 Statistical Analysis
At the primary stage of the research, the training dataset that has about 319 standard instances have been evaluated applying various algorithms using Weka data mining tool.
There are three evaluation techniques that have been followed in this research.
K-Fold Cross Validation: Cross validation is also known as rotation estimation. In K-fold cross validation, the whole dataset is partitioned randomly into K equal sized subsets.
Among those equally partitioned subsets, a single subset is selected for testing the model as the test set. The remaining K-1 subsets are combined to build the model as training set.
The process of cross validation is then repeatedly done K times, in such a way that each subset is used exactly once as the test set. The average of the K times results is used as the final result of estimation.
Percentage Split: This process is similar to the K-fold cross validation, except that the dataset here is evaluated once. In this process, the instances of the dataset are divided into two parts. One part is used as training dataset to build the model and the remaining part is used to measure the performance as test set.
Using Independent Test Set: This is more practical method of evaluation than other two processes. In this process, the whole dataset is used to build model as training set. To
23
© Daffodil International University
measure the performance and accuracy of the built model, independent real world data are supplied as test dataset.
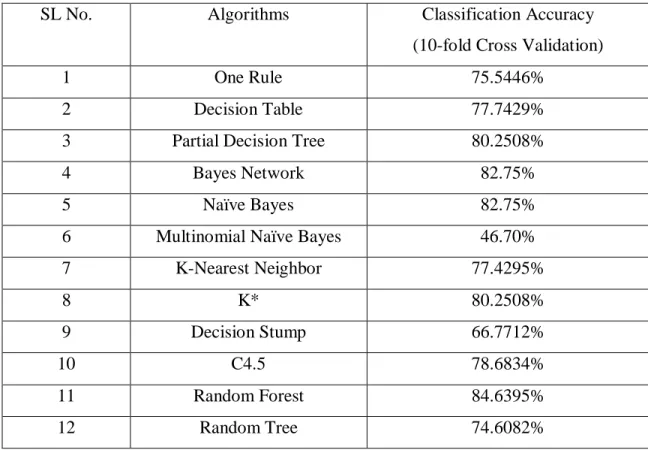
Initially cross validation with 10 folds is used to analyze the evaluation of the model after applying various learning algorithms. The accuracy of those evaluation is shown in table 3.5.1.
Table 3.5.1: Classification Accuracy of Different ML Algorithms
Some algorithms have done well in cross validation, but could not do well in other evaluation processes. Again some algorithms are not that much suitable for nominal datasets like the ones used in this research. Considering all the situations, three algorithms have been selected for further research as they are suitable for nominal data and have done well in all the three evaluation processes. The selected algorithms are Naïve Bayes algorithm, C4.5 (J48) and Random Forest algorithm.
SL No. Algorithms Classification Accuracy
(10-fold Cross Validation)
1 One Rule 75.5446%
2 Decision Table 77.7429%
3 Partial Decision Tree 80.2508%
4 Bayes Network 82.75%
5 Naïve Bayes 82.75%
6 Multinomial Naïve Bayes 46.70%
7 K-Nearest Neighbor 77.4295%
8 K* 80.2508%
9 Decision Stump 66.7712%
10 C4.5 78.6834%
11 Random Forest 84.6395%
12 Random Tree 74.6082%
24
© Daffodil International University 3.6 Proposed Model:
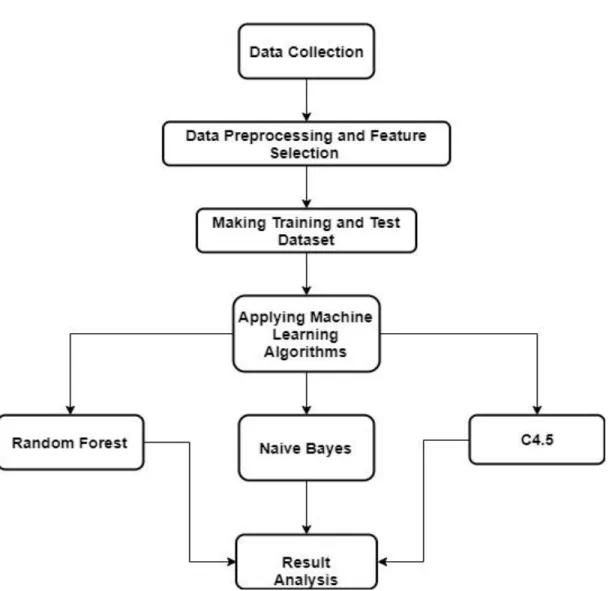
After analyzing performance of various algorithms, three machine learning algorithms are selected which are Naïve Bayes, C4.5 Decision Tree and finally Random Forest. Weka is a well-known data mining tool. As weka is fully implemented in java programming language, it is platform independent and has a large collection of machine learning algorithms. Weka 3.8.3 software is use here for the research purpose which is currently the latest version. The proposed system intends to improve the old school group selection system using selected three algorithms. So the model should analyze the performance and other important parameters of the system. The proposed model of this work is described below,
Collect actual raw survey data from some educational institutions of Bangladesh.
Process the raw data and select important features.
Develop a model to make decisions on group selection (Science/ Business Studies/
Humanities) of the secondary education level by using minimum features.
Analyze the performance of the model on different machine learning algorithms to get comparatively better decision making ability and lower error rate.
Analyze the importance of different features on this decision making model.
Validate the decision making ability of the model using some new real word data from different source.
Figure 3.6.1 shows the structure of the proposed model.
25
© Daffodil International University
Figure 3.6.1: Proposed Model Structure
26
© Daffodil International University
CHAPTER 4
EXPERIMENTAL RESULTS AND DISCUSSION
4.1 IntroductionDatasets are evaluated by the selected three machine learning (ML) algorithms. Different parameters of the results are analyzed. In this chapter, the parameters of the different estimations will be discussed briefly.
4.2 Experimental Results
In this study, datasets have been used that have 12 important attributes. Though initially data of 17 attributes were collected, 5 of them have been discarded during preprocessing.
After collecting data, there were 467 instances as the training data and 65 instances as the testing data that were collected from different source. As the research needed only the standard instances that can be considered as about perfect with the respective group (Science/ Business Studies/ Humanities), during preprocessing stage of analysis, 148 instances were discarded from the training data and 20 instances were discarded from the independent testing data.
On the evaluation step, 10 folds have been used for the cross validation. In percentage split, 70% data of the original dataset are used for training purpose where remaining 30% are used for testing purpose. For the third evaluation, the original dataset is used as the training set and for testing, some more data from a different source are collected. Table 4.2.1 shows the amount of instances that are used for training and testing on different evaluations.
Table 4.2.1: Training and Testing Instances on Different Evaluations.
Evaluation Techniques Training Instances Testing instances
10-Fold Cross Validation 287 32
Percentage Split 223 96
Using Independent Test set 319 45
27
© Daffodil International University
After applying three algorithms on the datasets, all the accuracy of the classification has been recorded. It has found that the accuracy of the classification on cross validation using random forest is almost 85% and the algorithm performs relatively better than other two, Naïve Bayes (83%) and C4.5 (79%). Random forest has also done well in other two evaluation processes. Table 4.2.2, table 4.2.3, table 4.2.4 show different parameters of the results on different evaluations using all three algorithms.
Table 4.2.2: Performance Analysis Parameters Algorithms on 10-Fold Cross Validation
Techniques/
Methods
Classification Accuracy (%)
Precision (%)
Recall (%)
F-Measure (%)
FP Rate (%)
Naïve Bayes 82.76 82.5 82.8 82.5 11.2
C4.5 78.9 78.9 78.7 78.7 12.3
Random Forest 84.9 84.9 84.6 84.3 10.7
Table 4.2.3: Performance Analysis Parameters Algorithms on Percentage Split
Techniques/
Methods
Classification Accuracy (%)
Precision (%)
Recall (%)
F-Measure (%)
FP Rate (%)
Naïve Bayes 77.08 78.3 77.1 76.4 14.6
C4.5 76.04 77.1 76.0 75.5 17.4
Random Forest 78.13 80.0 78.1 77.3 14.3
28
© Daffodil International University
Table 4.2.4: Performance Analysis Parameters Algorithms on Independent Testing
Techniques/
Methods
Classification Accuracy (%)
Precision (%)
Recall (%)
F-Measure (%)
FP Rate (%)
Naïve Bayes 73.33 74.2 73.3 73.4 15.3
C4.5 77.78 77.9 77.8 77.5 11.0
Random Forest 75.56 76.8 75.6 75.5 11.8
In above three tables, classification accuracy, precision, recall, F score measure and false positive rate in different evaluation processes are shown that are needed to analyze the performance of a model.
4.3 Descriptive Analysis:
After applying algorithms, confusion matrices were found which were used to calculate the performance parameters (Precision, Recall, F-measures). Each row of the confusion matrix represents the instances in a predicted class while each column represents the actual class (or vice versa) [21]. Four terms are related to this matrix.
True Positive (TP): When the observation and the prediction both are positive, it is true positive. Suppose the system predicted a student’s group as science and that student’s group is actually science, then it is true positive often denoted as TP.
True Negative (TN): When the observation is negative and the prediction is also negative then it is true negative. Suppose the system predicted a student’s group as not science and the student’s group actually is not science, then it is true negative often denoted as TN.
False Positive (FP): When the actual condition is negative but the prediction is positive then it is false positive. Suppose a student’s group is not science, but the system predicted him as a science student, in that case it is false positive often denoted as FP.
29
© Daffodil International University
False Negative (FN): When the actual condition is positive but the prediction is negative then it is false negative. Suppose a student’s group is science, but the system predicted that he is not a science student, in that case it is false negative often denoted as FN.
By using these terms, some performance parameters can be determined.
Classification Accuracy: It is the rate of correctly identified instances to the total number of instances. The formula for getting accuracy is,
𝐴𝑐𝑐𝑢𝑟𝑎𝑐𝑦 = 𝑇𝑃 + 𝑇𝑁 𝑇𝑃 + 𝑇𝑁 + 𝐹𝑃 + 𝐹𝑁
Accuracy can more simply be calculated as,
𝐴𝑐𝑐𝑢𝑟𝑎𝑐𝑦 = 𝐶𝑜𝑟𝑟𝑒𝑐𝑡 𝐶𝑙𝑎𝑠𝑠𝑖𝑓𝑖𝑐𝑎𝑡𝑖𝑜𝑛
𝑇𝑜𝑡𝑎𝑙 𝐶𝑙𝑎𝑠𝑠𝑖𝑓𝑖𝑐𝑎𝑡𝑖𝑜𝑛 × 100%
Precision: Precision denotes the proportion of predicted positive cases that are correctly real positives [22]. It is the number of relevant items found among all the relevant items.
High precision means the model has found more relevant results than the irrelevant. The formula for getting precision is,
𝑃𝑟𝑒𝑐𝑖𝑠𝑖𝑜𝑛 = 𝑇𝑃 𝑇𝑃 + 𝐹𝑃
Recall: Recall is the proportion of real positive cases that are correctly predicted positive [22]. It is the amount of retrieved relevant items over the total amount of that relevant items. Formula for this parameter is,
𝑅𝑒𝑐𝑎𝑙𝑙 = 𝑇𝑃 𝑇𝑃 + 𝐹𝑁
F-Measure: F-measure or F-score or F1 score is the measure of accuracy of the test. It can provide a more realistic measurement of the performance of test with the help of precision and recall. The formula to calculate this is,
𝐹 − 𝑚𝑒𝑎𝑠𝑢𝑟𝑒 = 2 × 𝑃𝑟𝑒𝑐𝑖𝑠𝑖𝑜𝑛 × 𝑅𝑒𝑐𝑎𝑙𝑙 𝑃𝑟𝑒𝑐𝑖𝑠𝑖𝑜𝑛 + 𝑅𝑒𝑐𝑎𝑙𝑙
30
© Daffodil International University
By using these formulas, performance of the model can be calculated and analyzed.
Now, Figure 4.3.1 shows the classification accuracy comparison of same methods in different evaluation processes.
Figure 4.2.1: accuracy comparison of same methods in different evaluation processes.
From the above figure, it is pretty much clear that the classification accuracies of three methods are very close to each other. For all the types of evaluations, Random Forest algorithm has returned pretty decent and acceptable results. Naïve Bayed is also good, but could not do well in independent testing (73.33%). So applying Naïve Bayes is not encouraged while other two options are valid. But the interesting fact is, the accuracy results of C4.5 is very much close to each other (78.68%, 76.04%, 77.78%) in all the three
31
© Daffodil International University
evaluations and it has performed better than other algorithms in independent testing. That means, it will classify instances slightly better than others in real situations.
So, from the above discussion, it can be said that, Random Forest, C4.5 Decision Tree, and Naïve Bayes, these three algorithms are pretty much compatible with the datasets used in this research. Although they have some fluctuations over classification accuracy in different evaluations, the performances are acceptable.
32
© Daffodil International University
CHAPTER 5
LIMITATIONS, FUTURE WORK & CONCLUSION
5.1 LimitationsIn this research, there are some limitations that could make some differences,
In this research, datasets contain 532 instances in total. A large dataset may upgrade the performance or may behave slightly different.
Data are collected from only three sources.
Impacts of family and society on the students are not considered.
5.2 Future Work
After all the computational and analytical complexities, our long term goal is to prepare a software application that will make decisions based on a repository database on Bangladeshi students and work as an auxiliary of decision makers to choose right group for a student.
5.3 Conclusion
The aim of this research was to make the group (Science/ Business Studies/ Humanities) selection process of a student in early secondary level of education more logical using technology, information and machine learning techniques. As the type of the dataset that has been used in this research was not available yet, data were collected through some constructed survey questionnaires. Unnecessary instances were discarded from the dataset.
Minimum number of features are finalized by discarding some features that have not much impact on decision making. By applying some compatible machine learning algorithms, the final model has been constructed. Overall, maximum efforts have been given to make this research as good as possible.
33
© Daffodil International University REFERENCES
[1] WEB BASED RESULT PUBLICATION SYSTEM FOR EDUCATION BOARDS, available at
<<https://eboardresults.com/app/>>, last accessed on 26-10-2019 at 10:50 AM.
[2] Bangladesh–Literacy rate, available at <<https://countryeconomy.com/demography/literacy- rate/bangladesh>>, last accessed on 26-10-2019 at 12.15 PM.
[3] Alex Smola, S.V.N. Vishwanathan, Introduction to Machine Learning, 1st Edition, Cambridge University Press, 2008, pp. 03.
[4] E. Lichtenberger, C. G. Jackson, “Predicting High School Student’ Interest in Majoring in a STEM Field: Insight into High School Students’ Postsecondary Plans”, Journal of Career and Technical Education, vol. 8(1), pp. 19-38, Winter 2013.
[5] A. A. Saa, “Education Data Mining & Students’ Performance Prediction”, International Journal of Advanced Computer Science and Applications, vol. 7(5), pp. 212-220, 2016.
[6] M. Kumar, Y. K. Salal, “systematic Review of Predicting Students’ Performance in Academics”, International Journal of Engineering and Advanced Technology, vol. 8(3), pp. 54-61, February 2019.
[7] V. Ramesh, P. Thenmozhi and K. Ramar, “Study of influencing factors of academic performance of students: A data mining approach”, International Journal of Scientific & Engineering Research, vol. 3(7), July 2012.
[8] Jiawei Han, Micheline Kamber, Jian Pei, Data Mining Concepts and Techniques, 3rd Edition, Morgan Kaufmann Publishers, 2012, pp. 83.
[9] Single imputation methods, available at << https://www.iriseekhout.com/missing-data/missing- data-methods/imputation-methods/>>, last accessed on 28-10-2019 at 7:50 PM.
[10] Machine learning and artificial intelligence in a brave new world, available at <<
https://www.sas.com/id_id/insights/articles/analytics/machine-learning-and-artificial-intelligence- in-a-brave-new-world.html?>>, last accessed on 29-10-19 at 10:50 AM.
[11] Wafa' S. Al-Sharafat, Reyadh Naoum, “Development of Genetic-based Machine Learning for Network Intrusion Detection”, World Academy of Science Engineering and Technology 55, 2009.
[12] Maron, M. E., "Automatic Indexing: An Experimental Inquiry", Journal of the ACM, vol. 8 (3), pp.
404–417, 1961.
[13] Jason D. M. Rennie, Lawrence Shih, Jaime Teevan, David R. Karger, “Tackling the Poor Assumptions of Naïve Bayes Text Classifiers”, International Conference of Machine Learning, pp.
01, 2003.
[14] S. Sharma, J. Agarwal, Sanjeev Sharma, “Classification Through Machine Learning Technique:
C4.5 Algorithm based on Various Entropies”, International Journal of Computer Applications, vol.
82, pp. 20-22, November 2013.
34
© Daffodil International University
[15] P. Horton, K. Nakai, “A probabilistic classification system for predicting the cellular localization sites of proteins”, International Conference on Intelligent Systems for Molecular Biology, vol. 4, pp. 109-115, June 1996.
[16] J. R. Quinlan, C4. 5: programs for machine learning, 1st Edition, Morgan Kaufmann Publishers, 1993.
[17] S. B. Kotsiantis, “Supervised Machine Learning: A Review of Classification Techniques”, Informatica, vol. 31, pp. 249-268, 2007.
[18] Shai Shalev-Shwartz, Shai Ben-David, Understanding Machine Learning, Cambridge University Press, New York, NY 10013-2473, 2014.
[19] L. Breiman, “Random Forests”, Machine Learning, vol. 45, pp. 5-32, 2011.
[20] T. Hastie, R. Tibshirani, J. Friedman, The Elements of Statistical Learning, 2nd Edition, Springer, 2008, pp. 587-588.
[21] Confusion matrix, available at <<https://en.wikipedia.org/wiki/Confusion_matrix>>, last accessed on 31-10-19 at 12:45 AM.
[22] David M W Powers, “Evaluation: From Precision, Recall and F-Factor to ROC, Informedness, Markedness & Correlatuon”, Journal of Machine Learning Technologies. Vol. 2(1), pp. 38, 2011.
35
© Daffodil International University
36
© Daffodil International University
37
© Daffodil International University
38
© Daffodil International University