Page | i
Traffic Fatality Prediction Using Machine Learning Algorithms: Performance
Analysis and Comparison Study
by
Md. Jahangir Alam ID: CSE1902017018
Nur Jahan Akter ID: CSE1903018027
Mossa Shaila Mony Akter Srabony ID: CSE1903018088
Abdul Aziz ID: CSE1903018028
Nafiz Ahmed Ronak ID: CSE1903018133
Supervised by Ahmed Shafkat
Lecturer
Submitted in partial fulfillment of the requirements for the degree of Bachelor of Science in Computer Science and Engineering
DEPARTMENT OF COMPUTER SCIENCE AND ENGINEERING SONARGAON UNIVERSITY (SU)
September 2023
Page | ii
APPROVAL
The thesis titled “Traffic Fatality Prediction Using Machine Learning Algorithms:
Performance Analysis and Comparison Study” submitted by Md. Jahangir Alam (CSE1902017018), Nur Jahan Akter (CSE1903018027), Mossa Shaila Mony Akter Srabony (CSE1903018088), Abdul Aziz (CSE1903018028) and Nafiz Ahmed Ronak (CSE1903018133) to the Department of Computer Science and Engineering, Sonargaon University (SU), has been accepted as satisfactory for the partial fulfillment of the requirements for the degree of Bachelor of Science in Computer Science and Engineering and approved as to its style and contents.
Board of Examiners
--- Ahmed Shafkat
Lecturer,
Department of Computer Science and Engineering Sonargaon University (SU)
Supervisor
--- (Examiner Name and Signature)
Department of Computer Science and Engineering Sonargaon University (SU)
Examiner 1
--- (Examiner Name and Signature)
Department of Computer Science and Engineering Sonargaon University (SU)
Examiner 2
--- (Examiner Name and Signature)
Department of Computer Science and Engineering Sonargaon University (SU)
Examiner 3
Page | iii
DECLARATION
We, hereby, declare that the work presented in this report is the outcome of the investigation performed by us under the supervision of Ahmed Shafkat, Lecturer, Department of Computer Science and Engineering, Sonargaon University, Dhaka, Bangladesh. We reaffirm that no part of this thesis has been or is being submitted elsewhere for the award of any degree or diploma.
Countersigned
--- (Ahmed Shafkat)
Supervisor
Signature
--- Md. Jahangir Alam ID: CSE1902017018
--- Nur Jahan Akter ID: CSE1903018027
---
Mossa Shaila Mony Akter Srabony ID: CSE1903018088
--- Abdul Aziz ID: CSE1903018028
--- Nafiz Ahmed Ronak ID: CSE1903018133
Page | iv
ABSTRACT
Many nations are concerned about the high number of traffic fatalities, which has led to a search for efficient prevention methods. This study addresses road fatalities brought on by drunk driving incidents. The study uses machine learning algorithms to detect and comprehend patterns related to fatalities brought on by drunk driving. The study builds prediction models that can help with early detection and policy development using a number of variables, including crash features, demographic information, and historical trends. This models are formulated by various machine learning techniques. Supervised machine learning algorithms, such as Random Forests (RF), Decision Tree (DT), Naïve Bayes (NB), Logistic Regression (LR), Support Vector Machine (SVM) are implemented on traffic fatalities dataset. The findings of this study indicate that the RF model can be a promising tool for predicting of death by drunk driving. RF algorithm has shown better performance with 100% accuracy than DT with 95%, NB with 74%, LR with 94% and SVM with 67% accuracy.
Page | v
ACKNOWLEDGMENT
At the very beginning, we would like to express my deepest gratitude to the Almighty Allah for giving us the ability and the strength to finish the task successfully within the schedule time.
We are auspicious that we had the kind association as well as supervision of Ahmed Shafkat, Lecturer, Department of Computer Science and Engineering, Sonargaon University whose hearted and valuable support with best concern and direction acted as necessary recourse to carry out our project.
We would like to convey our special gratitude to Brig. Gen. (Retd) Prof. Habibur Rahman Kamal, Dean, Faculty of Science and Engineering for his kind concern and precious suggestions.
We are also thankful to all our teachers during our whole education, for exposing us to the beauty of learning.
Finally, our deepest gratitude and love to my parents for their support, encouragement, and endless love.
Page | vi
TABLE OF CONTENTS
APPROVAL... ii
DECLARATION………...……….. iii
ABSTRACT ………..……... iv
ACKNOWLEDGEMENT ……….………... v
TABLE OF CONTENTS ………….………... vi-vii LIST OF TABLE………….………... viii
LIST OF FIGURES ………….………... ix
CHAPTER 1 1 – 4 INTRODUCTION 1.1 Introduction………..………... 1-2 1.2 Motivation………..………... 2
1.2 Objectives………...………... 3
1.3 Contribution………...………....... 3
1.4 Problem……….………... 3
1.5 Outline……….……... 4
CHAPTER 2 5 – 7 Overview of Machine Learning Techniques 2.1 Machine Learning and Data Mining ………... 5
2.2 Decision Making Problems………... 6
2.3 Machine Learning Algorithms………... 6
2.4 Supervised Machine Learning Algorithms... 7
2.5 Training and Testing of Machine Learning Models... 7
CHAPTER 3 8-10 Literature Review 3.1 Introduction ………... 8
3.2 Related Work ……….……… 8-10 CHAPTER 4 11 – 16 Methodology 4.1 Introduction ……….………. 11-13 4.2 Dataset Preparation ...……….……… 13
4.3 Classification using FARS Dataset………... 14
4.4 Decision Tree Classification Algorithm... 14
4.5 SVM Classification Algorithm………... 14
4.6 Random Forest Classification Algorithm... 15
4.7 Naïve Bayes Classification Algorithm... 16
4.8 Logistic Regression Classification Algorithm... 16
Page | vii
CHAPTER 5 17 – 24
Implementation & Results
5.1 Implementation………... 17
5.1.1 Correlation Matrix for Dataset... 17
5.1.2 Machine Learning Algorithm Library... 18
5.1.3 Traffic Fatalities Dataset... 18
5.1.4 Plot Histogram of Age... 18
5.1.5 Plot Histogram of Speeds... 19
5.1.6 Plot Histogram of Drinking... 19
5.1.7 Plot of Fatalities by Gender... 19
5.1.8 Implementation of Naïve Bayes Algorithm... 20
5.1.9 Confusion Matrix of Naïve Bayes Algorithm... 20
5.1.10 Implementation of Logistic Regression... 20
5.1.11 Confusion Matrix of Logistic Regression Algorithm... 21
5.1.12 Implementation of Decision Tree Algorithm... 21
5.1.13 Confusion matrix of Decision Tree algorithm... 21
5.1.14 Implementation of SVM Algorithm... 22
5.1.15 Confusion Matrix of SVM Algorithm... 22
5.1.16 Implementation of Random Forest Algorithm... 22
5.1.17 Confusion Matrix of Random Forest Algorithm... 23
5.2 Results ………... 23
5.2.1 Results for Traffic Fatalities Dataset... 23
5.2.2 Decision for Fatalities Dataset... 24
CHAPTER 6 25 CONCLUSION 6.1 Conclusion ………..….... 25
6.2 Future Works……….…….. 25 REFERENCES ……….…………... 26 – 27
Page | viii
LIST OF TABLES
Table 2.1 Comparison between machine learning and data mining 5 Table 4.1 Description of attributes in the data set 13 Table 5.2.1 Results of supervised machine learning algorithms on traffic
fatalities dataset 23
Page | ix
LIST OF FIGURES
Fig.4.1 Experiment Flow 12
Fig.5.1.2 Correlation Matrix for FARS Dataset 17
Fig.5.1.2 Machine Learning Library 18
Fig.5.1.3 Traffic Fatalities Dataset 18
Fig.5.1.4 Plot Histogram of Age 18
Fig.5.1.5 Plot Histogram of Speeds 19
Fig.5.1.6 Plot Histogram of Drinking 19
Fig.5.1.7 Plot of Fatalities by Gender 19
Fig.5.1.8 Naïve Bayes Algorithm Implementation. 20
Fig.5.1.9 Confusion Matrix of Naïve Bayes Algorithm 20 Fig.5.1.10 Logistic Regression Algorithm Implementation 20 Fig.5.1.11 Confusion Matrix of Logistic Regression Algorithm 21
Fig.5.1.12 Decision Tree Algorithm Implementation 21
Fig.5.1.13 Confusion Matrix of Decision Tree Algorithm 21
Fig.5.1.14 SVM Algorithm Implementation 22
Fig.5.1.15 Confusion Matrix of SVM Algorithm 22
Fig.5.1.16 Implementation of Random Forest Algorithm 23 Fig.5.1.17 Confusion Matrix of Random Forest Algorithm 23 Fig. 5.2.1 Comparing Algorithms using Traffic Fatalities Dataset 24
Chapter 1 Introduction
1.1 Introduction
Every year as a consequence of road traffic accident greater than 1.25 million people decease on the world’s street and around 50 million people get injured. In low and middle-developing nations large amount of hospital beds are occupied by injured people because of traffic accident. If serious measures and preventive actions are not engaged, road traffic accidents are figured to be the eighth foremost reason of death in the worldwide and are expected to be the main contributor to the worldwide problem of injury and disease by 2030 [1].
Every day, about 37 people in the United States die in drunk-driving crashes — that's one person every 39 minutes. In 2021, 13,384 people died in alcohol-impaired driving traffic deaths
— a 14% increase from 2020. These deaths were all preventable. Driving after drinking is deadly. Yet it still continues to happen across the United States. If you drive while impaired, you could get arrested, or worse — be involved in a traffic crash that causes serious injury or death. About 31% of all traffic crash fatalities in the United States involve drunk drivers (with BACs of .08 g/dL or higher). In 2021, there were 13,384 people killed in these preventable crashes. In fact, on average over the 10-year period from 2012-2021, about 10,850 people died every year in drunk-driving crashes [2].
Machine learning (ML) techniques have generated huge societal impacts in a wide range of applications such as computer vision, speech processing, natural language understanding, neuroscience, health, and Internet of Things. The advent of big data era has spurred broad interests in ML. ML algorithms have never been better promised and also challenged by big data in gaining new insights into various business applications and human behaviors. On the one hand, big data provides unprecedentedly rich information for ML algorithms to extract underlying patterns and to build predictive models; on the other hand, traditional ML algorithms face critical challenges such as scalability to truly unleash the hidden value of big data. With an ever expanding universe of big data, ML has to grow and advance in order to transform big data into actionable intelligence. ML addresses the question of how to build a computer system that improves automatically through experience [3].
We used supervised machine learning algorithms including decision tree (DT), logistic regression, support vector machine (SVM), random forest (RF), and naïve bayes (NB) algorithms for analyzing their performance. These algorithms will be applied on the available experimental datasets for analysis. The supervised machine learning algorithms can be applied in several fields. For analyzing the performance of these algorithms, we need very reliable data
sets for every area where we apply it. Supervised machine learning algorithms can make predictions for newly incoming data according to the given training data sets.
Data preprocessing helps prepare raw data into the “right form” for subsequent learning steps.
The raw data is likely to be unstructured, noisy, incomplete, and inconsistent. The preprocessing step transforms such data into a form that can be used as inputs to learning through data cleaning, extraction, transformation, and fusion. The learning phase chooses learning algorithms and tunes model parameters to generate desired outputs using the preprocessed input data. Some learning methods, particularly representational learning, can also be used for data preprocessing. The evaluation follows to determine the performance of the learned models. For instance, performance evaluation of a classifier involves dataset selection, performance measuring, error-estimation, and statistical tests [3].
Machine learning is a scientific discipline which focuses on how machines learn from the given data. Machine learning is a field of artificial intelligence, that provide a system of automated learning and producing the desired outcome from the given dataset based on the previous examples from the same domain. Samuel, the father of machine learning term divided it in Supervised and Unsupervised categories [4].
In supervised learning, we have a training data, with a defined set of rules. Based on those rules, the testing data will be evaluated. The main goal of supervised machine learning is to predict a known output or target from a huge volume of the input data. Because of these predictions, the evaluation of the learning methods will be performed by classifying some metrics. Supervised machine learning techniques are very important for performing Classification, Inference or Regression analysis on a set of data. A study discussed that a supervised machine learning model is built by dividing a dataset into two parts: One set is used for building a classification model by assigning every attribute to one of the defined class labels. The other is for testing the classification model [4].
1.2 Motivation
The problem of traffic fatalities by drunk driving is not confined to the United States; it is a global concern that affects many countries. While specific statistics and approaches may vary, the overarching challenges and efforts to address them are consistent. We want to train a dataset that comes from the National Highway Traffic Safety Administration (NHTSA) initiative to gather information on fatal crashes Fatality Analysis Reporting System (FARS) and predict data using some machine learning algorithm.
1.3 Objective
To investigate different machine learning algorithms. Use the sklearn machine learning package to evaluate the performance of a few supervised machine learning algorithms, such as Decision Tree (DT), K Nearest Neighbor (KNN), Random Forest (RF), Naïve Bayes (NB) and Logistic Regression (LR).
To identify the proper label for freshly supplied input data in the test data set by using prediction.
To study the data sets for patterns, and then predict what they will reveal.
To identify issues in any of the Supervised machine learning algorithms and recommend improvements
Find the best supervised machine learning algorithm for a certain data analysis and prediction by comparing the performance of various methods.
1.4 Contribution
For the purpose of getting extensive knowledge, we have analyzed more than 25 literatures based on Performance analysis of Supervised Machine Learning Algorithm.
We analysis the performance of supervised machine learning algorithms by using drunken driving dataset from the NHTSA’s initiative to gather information on fatal crashes (FARS).
We collect information on drunk-driving people from 56 states in the United States.
Analyze the effectiveness of the K-Nearest Neighbor (KNN), Decision Tree, Random Forest, Naive Bayes, Logistic Regression, and Naive Bayes algorithms.
We can share people about drunk-driving and how much percentage people dying every year.
1.5 Problem
The problem to be solved in this research work is about the prediction of the data of drunken driving section identifying based on the number of attributes describing different aspects of how many people die by drunken driving. The Supervised machine learning techniques of Classification are applied to the sampled dataset for assigning related features and predicting the death of people by drunken driving.
1.6 Outline
In this work I discuss about Overview of Machine Learning Technique where some parts are available such as Machine learning and data mining, decision making problems, machine learning algorithms, supervised learning algorithms and training and testing datasets. Then we discuss the literature review section where introduction and related work parts are presented.
Then the methodology chapter is discussed where introduction, dataset preparation, classification of traffic fatalities by drunk-driving dataset, decision tree, random forest, logistic regression, KNN, SVM and Naïve Bayes algorithms are discussed. In chapter five we discuss about correlation matrix, confusion matrix and cross validation score for traffic fatalities by drunk-driving dataset. At last conclusion and future work parts are attached in this work.
Chapter 2
Overview of Machine Learning Techniques
2.1 Machine Learning and Data Mining
Big data is used in data mining; however, today's data is growing exponentially. Large amounts of data require a lot of management. Data mining's area of machine learning. Machine learning and data mining algorithms have certain parallels and differences. Data mining techniques are used to extract knowledge, whereas machine learning algorithms can make decisions based on previous experiences.
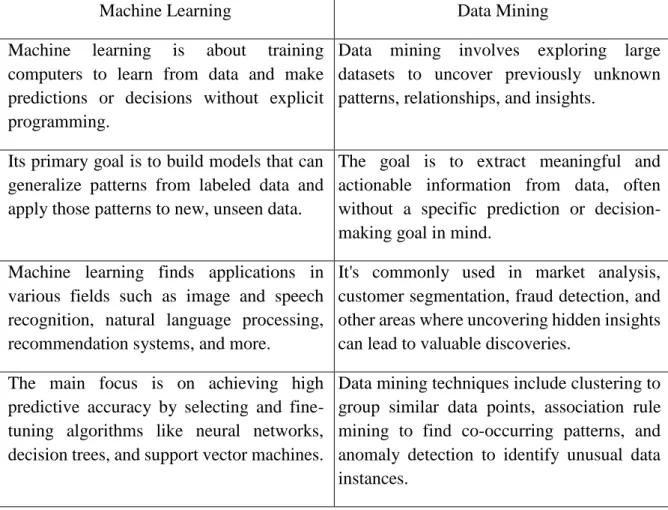
The differences between Machine Learning and Data Mining are given below:
Machine Learning Data Mining
Machine learning is about training computers to learn from data and make predictions or decisions without explicit programming.
Data mining involves exploring large datasets to uncover previously unknown patterns, relationships, and insights.
Its primary goal is to build models that can generalize patterns from labeled data and apply those patterns to new, unseen data.
The goal is to extract meaningful and actionable information from data, often without a specific prediction or decision- making goal in mind.
Machine learning finds applications in various fields such as image and speech recognition, natural language processing, recommendation systems, and more.
It's commonly used in market analysis, customer segmentation, fraud detection, and other areas where uncovering hidden insights can lead to valuable discoveries.
The main focus is on achieving high predictive accuracy by selecting and fine- tuning algorithms like neural networks, decision trees, and support vector machines.
Data mining techniques include clustering to group similar data points, association rule mining to find co-occurring patterns, and anomaly detection to identify unusual data instances.
Table 2.1: Comparison between machine learning and data mining
2.2 Decision Making Problems
There are too many reasons which creating decision-making problems. This situation can create difficulty for making proper decision. Some decision-making problems are given here,
Lack of resources
Lack of data
Missing value
Outlier value
Lack of time
Lack of reliable data
Collecting appropriate data
Risk taking ability etc.
2.3 Machine Learning Algorithms
There are four different kinds of machine learning algorithms. They are reinforcement, semi- supervised, unsupervised, and supervised. The training data in the supervised machine learning algorithm are labeled with the appropriate output. Since there is no labeled data in the unsupervised machine learning algorithm, we must identify any hidden patterns. Combining supervised and unsupervised learning is semi-supervised machine learning. For making decisions, some known information is provided here. To maximize decision-making, intelligent agents are used in the environment using reinforcement machine learning techniques. Utilizing artificial intelligence in this way is called reinforcement learning.
2.4 Supervised Machine Learning Algorithms
Supervised Machine Learning algorithms need external input datasets. The input dataset is divided into two sets training and testing dataset. It trains the model for classifying the input dataset and new data is fed to the model for testing the accuracy of the model. Testing dataset can test the training model as well as upcoming new data. Accuracy testing by confusion matrix which is numerous performance testing and we can apply hyper parameter tuning for optimization. Supervised machine learning algorithms are used for decision making and here predefined dataset are needed. Some supervised machine learning algorithms are:
Decision Tree
Random Forest
Naïve Bayes Algorithm
Linear Regression
Logistic Regression
K – Nearest Neighbor
Support Vector Machine
2.5 Training and Testing of Machine Learning Models
For finding the testing and training dataset where 80% data is for training, 20% data is for testing. Training dataset is a subset of the actual dataset which is used to train the model.
Testing dataset is a subset of a actual dataset which is used to test the model and test the new upcoming data.
Chapter 3
Literature Review
3.1 Introduction
On traffic fatalities, a lot of work is being done. Many accidents and fatalities are caused by drunk driving every day. Machine learning algorithms employ statistical and probabilistic methods to predict new data as well as learn from the past and find meaningful patterns in a lot of unstructured data. Unsupervised machine learning algorithms find interesting patterns in unstructured data while supervised machine learning algorithms learn from previous experiences. Machine learning is a branch of data mining that deals with massive amounts of data.We first split the data set into two categories. Both the training dataset and the testing dataset are used to test the model on the impending fresh data. For making decisions, we employ supervised machine learning techniques including decision trees, random forests, logistic regression, naive bayes, and SVM. We divided the dataset so that 80% was used to train the model and 20% was used to test the impending new data.
3.2 Related Work
B. Kumeda, F. Zhang, F. Zhou, S. Hussain, A. Almasri and M. Assefa [1] The paper also discusses the use of data mining techniques and predictive analytics in analyzing and predicting road accidents. The dataset used in the study includes information on the total number of vehicles involved, time of the accident, road class, and various injury classes.
Evaluation metrics such as True Positive Rate, False Positive Rate, Accuracy, Recall, Precision, F-Measure, Kappa, Mean absolute error, Root mean squared error, Relative absolute error, and Root relative squared error were used to assess the performance of the classification models. Overall, the paper highlights the importance of machine learning algorithms in analyzing road traffic accident data and provides insights into the key factors influencing accident severity.
Zhou, L., Pan, S., Wang, J., & Vasilakos, A. V. [3] This paper explores the intersection of machine learning (ML) and big data, discussing the opportunities and challenges presented by this combination. The advent of big data has propelled ML to the forefront, offering richer insights and predictive capabilities. The paper introduces a framework called ML on big data (MLBiD), consisting of ML as the core component interacting with big data, users, domain knowledge, and system considerations. It delves into the phases of data preprocessing, learning, and evaluation within this framework. Challenges such as data preprocessing complexities, scalability of ML algorithms, and new evaluation metrics are discussed. The paper concludes by highlighting the potential for transformative research in this area, addressing the technical challenges posed by big data while creating real-world impacts.
R. E. AlMamlook, K. M. Kwayu, M. R. Alkasisbeh and A. A. Frefer [5] The findings of this study indicate that the RF model can be a promising tool for predicting the injury severity of traffic accidents. Traffic accidents are a daily source of death, injury, and property damage on roadways resulting in huge losses at economic and social levels. Classification methods are among the most commonly used techniques in mining traffic accidents, where the goal is building classifiers that can predict the accidents. The primary objective of this study is to achieve the accuracy and identify the factors behind Traffic Accident Severity that could be helpful to reduce accident frequency and severity in near future, thus saving many lives and wealth, as well as many other things.
Barry, V., Schumacher, A., & Sauber-Schatz, E. [8] This study investigates alcohol-impaired driving (AID) in the USA during 2014, 2016, and 2018, focusing on prevalence, demographic characteristics, and behavioral aspects. Data from the Behavioral Risk Factor Surveillance System was used, and adults were asked about driving after consuming alcohol. Results show that AID accounted for a significant portion of motor vehicle-related deaths. AID prevalence varied slightly across the years (1.7% in 2014, 2.1% in 2016, 1.7% in 2018), with estimated annual episode counts ranging from 111 million to 186 million. AID was more common among men, binge drinkers, and those not always using seatbelts. The study highlights the need for strategies to reduce AID.
Pourroostaei Ardakani, S., Liang, X., Mengistu, K. T., So, R. S., Wei, X., He, B., &
Cheshmehzangi, A. [9] Road accidents are influenced by external factors, such as weather conditions, road status, and driver skills. According to, more severe injuries were sustained in darker conditions (at night without streetlights) and dry road surface conditions. The month, season, and weather conditions were also significant factors in the analysis conducted by Wang et al. in China, showing that autumn and winter were likely to cause severe fatalities brought on by difficult weather such as rain and snow. However, Potoglou et al. show that summer and autumn seasons are more likely to result in traffic accidents from data from Italy and Europe, which are more relevant to this research because it uses data from the UK.
Shafiq, M., Tian, Z., Bashir, A. K., Jolfaei, A., & Yu, X. [11] This survey delves into the fusion of data mining and machine learning techniques as a means to accurately classify traffic patterns and contribute to the development of sustainable transportation systems.
Machine learning offers a range of methodologies to process and analyze the collected traffic data. This section introduces fundamental machine learning techniques such as decision trees, support vector machines, k-nearest neighbors, and neural networks. It discusses their suitability for traffic classification tasks and highlights their strengths and limitations in different scenarios.
Lenk, K. M., Erickson, D. J., Joshi, S., Calvert, C., Nelson, T. F., & Toomey, T. L. [12] This study addresses a critical gap in the literature by examining the association between alcohol enforcement strategies employed by sheriff and police agencies and the incidence of alcohol- impaired-driving fatal traffic crashes. By doing so, it seeks to provide actionable insights that can contribute to the ongoing efforts to reduce the toll of alcohol impaired driving on society.
Chen, Y. [14] The study utilizes a range of data sources, including traffic flow data, weather data, and crash data, to develop these prediction models. Several machine learning models, such as Support Vector Machine (SVM) and Decision Tree models, are employed as candidates for the prediction process. The findings underscore the critical role of factors such as weather conditions, time of crash, and traffic flow just prior to the crash in impacting crash occurrences in real-time.
Tevik, K., Bergh, S., Selbæk, G., Johannessen, A., & Helvik, A. S. [17] This study addresses the lack of standardized methods for assessing alcohol intake in older adults. The goal was to review how drinking patterns and alcohol consumption are defined in epidemiological studies. They found diverse definitions for 19 drinking patterns across 105 studies. Common tools included the quantity-frequency questionnaire and the Alcohol Use Disorders Identification Test. Lack of consensus hampers comparisons. Recommendations include uniform definitions and expanded QF questionnaire use.
R.Sneha,Mrs.P.Jasmine Lois Ebenezer, [19] This paper focuses on predicting traffic violations using machine learning, particularly when these violations are most likely to occur.
It also examines the contributing factors that lead to more severe consequences such as personal injury or property damage. The study utilizes a national traffic violation database to mine and analyze patterns in traffic violations. Specific times, days, and locations prone to violations are identified, which can help prevent or reduce the occurrence of such incidents.
The work acknowledges the importance of data mining and machine learning in addressing traffic safety concerns. It presents a comparison of classification algorithms including Naïve Bayes, Gradient Boosted Trees, and Deep Learning for predicting traffic violation types. The study uses a dataset containing attributes like date, description, vehicle type, and violation type for the analysis.
Bush over, B., & Morrison, C [21] The significance lies in the practicality of self-report measures to capture alcohol-impaired driving behavior among individuals. However, the authors stress the importance of considering the specific items and scales used in measurement to ensure their accuracy. Valid and reliable measures are crucial for identifying effective interventions to prevent alcohol-related accidents.
Chapter 4 Methodology
4.1 Introduction
Research methodology is the process of identifying, selecting and analyzing data and information. The empirical data for analysis is sourced from the Fatality Analysis Reporting System (FARS) of the National Highway Traffic Safety Administration. This system yields comprehensive insights into fatal traffic incidents. There have 3 data set, (i) Accident data set, (ii) Vehicle Data set, and (iii) Person Data set. For completing this research, we need to go through several steps which are: (i) Data Collection (ii) Data Preprocessing (iii) Data Cleaning (iv) Train the model (v) Evaluate the Model (vi) Make prediction [3].
I will collect an appropriate data set for experimentation and analysis using machine learning algorithms from Traffic Fatalities data set. Data Collection is the primary procedure for supervised machine learning algorithms. The next step is to clean this data. Data cleaning means removing the duplicate data, correct errors and dealing with missing values [3].
Data preprocessing is the process of modifying the data that will be used in the machine learning algorithm (e.g., by transforming, encoding, etc.) to make it easier for the computer to quickly parse it. Furthermore, it is a procedure whereby irrelevant data are eliminated or changed in order to aid in the predictive analysis process [9].
Figure 4.1: Experiment Flow [20].
After this step, divide the data set into the training and testing data sets. I will use 80% of this data set for training purposes, and the remaining 20% of this data set for testing.
Supervised machine learning algorithms take labeled data, so we need to categorize and label it. A confusion matrix can show the accuracy, precision and recall for evaluating the model [14].
DATA COLLECTION
Acquire traffic fatality datasets from the Fatality Analysis Reporting System (FARS)
DATA PRE-PROCESSING Calculate percentage of missing values
DATA CLEANING
Clean all the duplicate, error, missing values.
TRANSFORMATION
Apply five machine learning algorithm
INTERPRETATION
Interpreting and presenting the result in meaningful manner
TABLE 4.1: Description of attributes in the data set
Attribute Description
STATE Identifies the State in which the crash occurred. The codes are from the General Services Administration’s (GSA) publication of worldwide Geographic Location Codes (GLC).
AGE This data element identifies this person’s age at the time of the crash in years with respect to their last
SEX Identifies the sex of this person involved in the crash.
TRAV_SP Records the speed the vehicle was traveling prior to the occurrence of the crash as reported by the investigating officer.
DRINKING Records whether alcohol was involved for this person and reflects the judgment of law enforcement.
ALC_DET Describes the method by which the police made the determination as to whether alcohol was involved for this person
ALC_STATUS Identifies whether an alcohol test was given to this person.
ATST_TYP Identifies the type of alcohol test that was given to this person ALC_RES The alcohol test result for this person.
WEATHER Records the prevailing atmospheric conditions that existed at the time of the crash as indicated in the case material.
DAY Records the day of the month on which the crash occurred HOUR Records the hour at which the crash occurred.
MINUTE Records the minutes after the hour at which the crash occurred DRUNK_DR Records the number of drinking drivers involved in the crash.
RACE Records the race of this person from the death certificate.
FATALS Records the number of fatally injured people in the crash.
DEATHS Records the number of fatalities that occurred in this vehicle.
4.2 Dataset Preparation
To prepare an appropriate dataset perform the following tasks:
1. Checking the data quality for finding a balanced dataset.
2. Formatting data for applying supervised machine learning algorithms.
3. Reducing irrelevant data or attribute from the dataset.
4. Impute missing values by taking the mean value.
5. Deleting the outlier value.
6. Normalization.
7. Creating new features from the existing features.
8. Rescaling and discretizing data.
4.3 Classification using FARS Dataset
We have used FARS datasets. Here accident dataset consists of total 32166 instances, 52 numbers of features, Vehicle dataset consist of total 15258 instances, 102 numbers of features, person dataset consist of total 80587 instances, 62 numbers of features including id number and one class. For the prediction of death by drunk-driving, we use some feature dataset from those 3 dataset. This datasets data need to properly preprocessing for applying supervised machine learning algorithms.
4.4 Decision Tree Classification Algorithm
Decision tree method, the classification models are built in the form of trees and every leaf node symbolizes one of the key variables. The number of branches in each leaf node equals the number of probable values of the supposed key variable. Then, selected feature values are assigned to each node. Based on the value of the key variables starting from the root node to the leaf the decisions are made. The Decision Tree method does not need domain knowledge for its construction and thus it is widely used in pattern classification applications. Data sets with partial information can also be processed using this tool.
Decision Trees are a useful tool with high dimensional data and the mode of analysis is exploratory, not conclusive [7].
H (D) = − ∑k𝑖=1P (Ci|D) logk (P (Ci|D)) The equation assumes that all trees are equally split through the dataset.
4.5 SVM Classification Algorithm
Support vector machine (SVM) is a theory of machine learning law in small sample situation, and it has the very advantage in prediction, but there is no specific theory for parameter selection to depend on in the learning process for support vector machine, which seriously restrain the prediction accuracy and effect of the support vector machine (SVM) method.
The value of penalty factor c and kernel parameter α affects the prediction accuracy of SVM, and finding the optimal c and α is the priority. At present parameter is usually defined artificially based on the specific issues, and the optimal parameter combination is determined by choosing the parameters for many times and comparing with each other. Parameters that are manually set, are blind and of low efficiency, so it is needed to adopt swarm intelligence optimization algorithm to improve the parameter choosing of support vector machine (SVM). At the same time, the design and implementation of particle swarm optimization algorithm (PSO) is relatively simple. Not only the convergence speed is fast, but the parameters required to be set are less (Cao and Xu, 2007) [16].
4.6 Random Forest Classification Algorithm
Random forest (RF) is yet another promising ML tool widely for severity prediction and sensitivity analysis of crash contributing factors. Random forest (RF) rely on the concept of a classification and regression tree (CART), there by constructing a large number of probable trees consisting of different sets of independent or predictors variables to prevent over-fitting issues. A drawback with CART model is that it is very sensitive to new input data and lack generalization [6].
In general, this problem is referred to as “over-fitting”. Random forests help in reducing the over-fitting problem by constructing a large number of separate decision trees, created with various subsets of predictor variables. The basic framework of the RF utilizing decision trees is defined in three steps. 1) Generate a Nc size bootstrap sample from the overall N data to grow a tree by randomly selecting predictors X = {xi, i= 1, ....p}. 2) Using the predictor xi at different tree node n to vote for class label y in same node. The sample is further adjusted at each node, before the best predictor for the split is obtained. 3) To get the misclassification score, run the out-of-bag (OOB) data (N – Nc) down the tree, and OOBER is chosen. Whereas is the minimum out-of-bag error rate OOBEF or a large number of trees, repeating step (1–
2–3) until OOBER is achieved. Assign each observation by majority vote to a final class y through averaging over the series of trees. Moreover, the split criterion used in this method is the information gain ratio, which is can be calculated from the below equation,
Information Gain Ratio (IGR) = Information Gain(X) Split Info (X)
Where X is the randomly chosen example in the training set. Split info, defined as the information required to determine the branch to which the example or instance belongs. [6]
Random forest has an excellent ability to resist noise due to the application of randomly selecting variables and data to generate plenty of classification trees. It can process not only discrete data but also continuous data [15].
4.7 Naïve Bayes Classification Algorithm
Naive bayes classifiers are a family of simple "probabilistic classifiers" based on applying Bayes' theorem with strong (naive) independence assumptions between the features. Since the feature set contains continuous variables, the Gaussian NB was chosen [5].Naïve bayes is a classification technique that is easier to design and it’s well suited for applications containing a huge dataset. It is the most commonly-used, simple and effective machine learning classifier [1]. Naive bayes is also very effective for the highly complicated sophisticated identification or classification methods [11]. Naïve bayes can only deal with discrete attributes. Discretization translates quantitative data into qualitative data, procuring a non-overlapping division of a continuous domain. The purpose of attribute discretization is to find concise data representations as categories, which are adequate for the learning task to retain as much information in the original continuous attribute as possible. However, when coping with big data, most of existing discretization approaches will not be efficient.
To address the big data challenges, standard discretization methods have been parallelized by developing a distributed version of the entropy minimization discretizer based on minimum description length principle in big data platforms, boosting both performance and accuracy [3].
Bayes Theorem states the following:-
1.
𝑥 =
P(c
|x
)= P(x
|c
)P(c)P(x) P(x)2. P(c | x) = P(x1| c) x P(x2| c)x...x P(x𝑛| c)x P(c)
Where P( c | x) is the posterior probability of class (target) given predictor (attribute). P(c) is the prior probability of class. P(x | c) is the likelihood which is the probability of predictor given class. P(x) is the prior probability of a predictor.
4.8 Logistic Regression Classification Algorithm
Logistic regression model has been used widely for road safety research to find the best fit of model. Logistic regression is a type of supervised machine learning that uses past data to predict the expected outcome of tasks that involve binary classification. As the dependent variable of interest in the dataset is binary, logistic regression may be applied. The ability of logistic regression to manage a large number of features while still being effective in the prediction of an outcome with two possible outcomes is one of the method’s primary benefits [10].
Chapter 5
Implementation & Results
5.1 Implementation
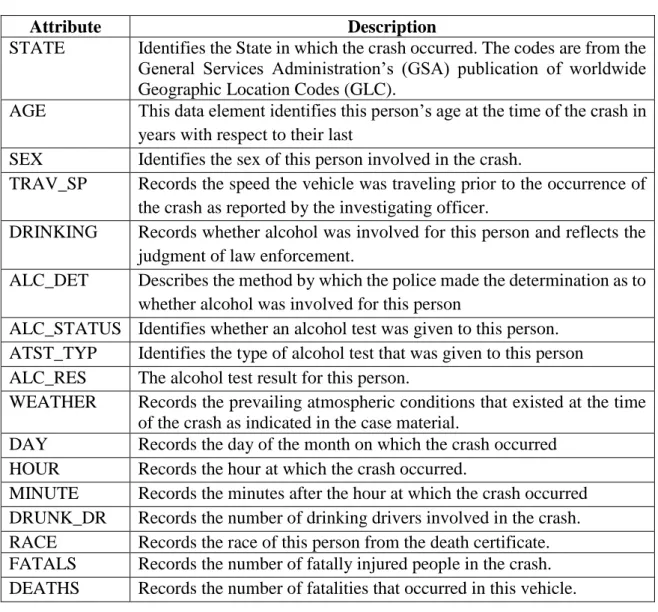
5.1.1 Correlation Matrix for Dataset
The link between the correlation scores between variables is displayed in tabular form using a correlation matrix. It generates pairs of correlation coefficient values and displays them in a matrix-like table. It is an effective method for assembling a sizable dataset as well as for identifying and displaying data trends. A correlation matrix's rows and columns display the variables. The correlation coefficient is contained in each cell of a table.
Figure 5.1.1: Correlation matrix for FARS dataset
If two variables are determined to have a positive association if the score is 1. In other words, when one variable increases, so does the other.
If the value is -1, it is said that there is a negative correlation between the two variables. To put it another way, as one variable increases, the other one decreases.
If the value is 0, there is no correlation between the two variables. This suggests that the relationships between the variables change at random.
5.1.2 Machine Learning Algorithm Library
Figure 5.1.2: Machine Learning Library
5.1.3 Traffic Fatalities Dataset
Figure 5.1.3: Traffic Fatalities Dataset
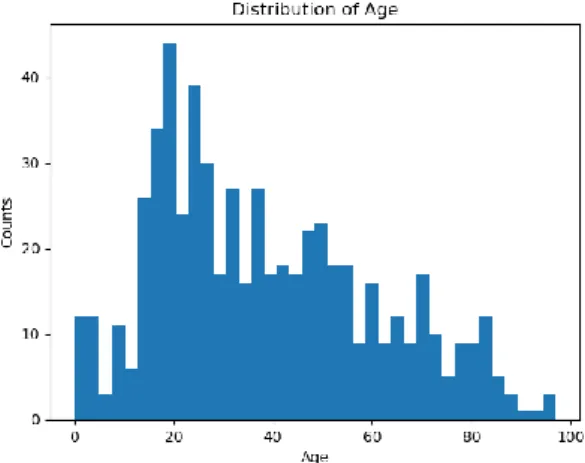
5.1.4 Plot Histogram of Age
Figure 5.1.4: Plot Histogram of Age
5.1.5 Plot Histogram of Speeds
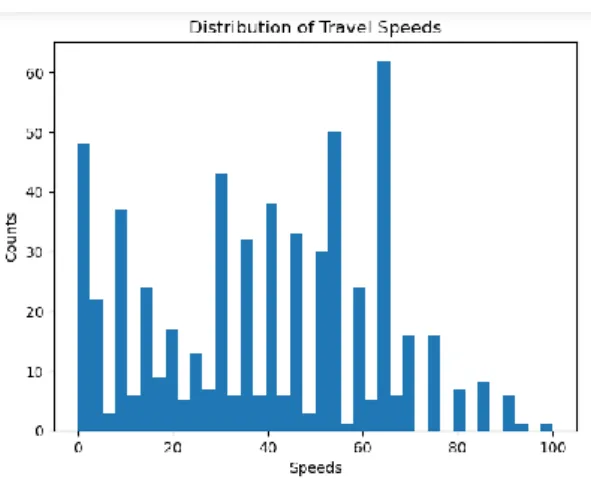
Figure 5.1.5: Plot Histogram of Speeds
5.1.6 Plot Histogram of Drinking
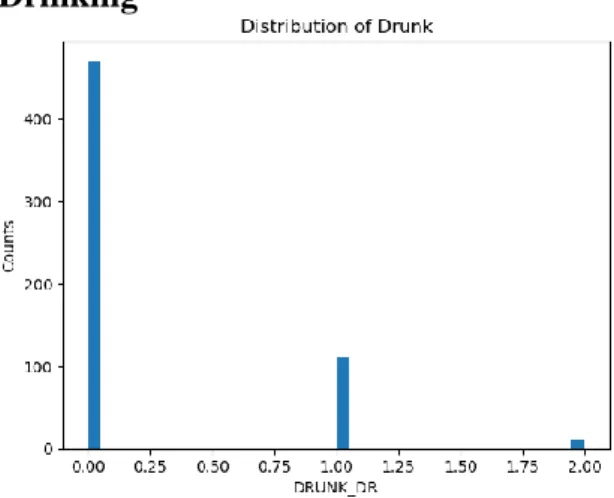
Figure 5.1.6: Plot Histogram of Drinking
5.1.7 Plot of Fatalities by Gender
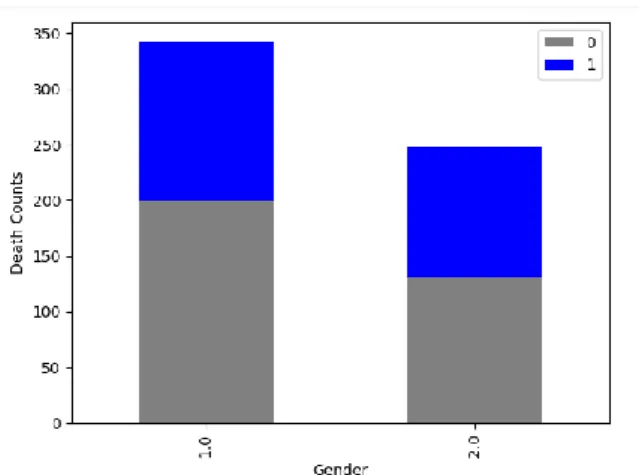
Figure 5.1.7: Plot of Fatalities by Gender
5.1.8 Implementation of Naïve Bayes Algorithm
Figure 5.1.8: Naïve Bayes Algorithm Implementation.
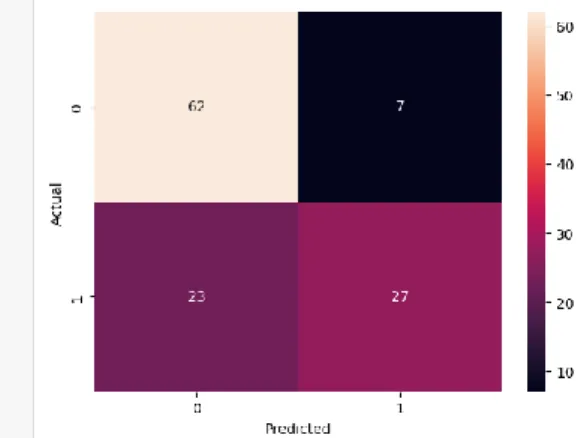
5.1.9 Confusion Matrix of Naïve Bayes Algorithm
Figure 5.1.9: Confusion Matrix of Naïve Bayes Algorithm
Here, true positive value is 62, false positive value is 7, false negative value is 23 and true negative value is 27.
5.1.10 Implementation of Logistic Regression
Figure 5.1.10: Logistic Regression Algorithm Implementation
5.1.11 Confusion Matrix of Logistic Regression Algorithm
Figure 5.1.11: Confusion Matrix of Logistic Regression Algorithm
Here, true positive value is 67, false positive value is 4, false negative value is 3 and true negative value is 45.
5.1.12 Implementation of decision tree algorithm
Figure 5.1.12: Decision Tree Algorithm Implementation 5.1.13 Confusion Matrix of Decision Tree Algorithm
Figure 5.1.13: Confusion Matrix of Decision Tree Algorithm
5.1.14 Implementation of SVM Algorithm
Figure 5.1.14: SVM Algorithm Implementation
5.1.15 Confusion Matrix of SVM Algorithm
Figure 5.1.15: Confusion matrix of SVM algorithm
Here, true positive value is 36, false positive value is 26, false negative value is 34 and true negative value is 23.
5.1.16 Implementation of random forest algorithm
Figure 5.1.16 : Random forest algorithm implementation
5.1.17 Confusion Matrix of Random Forest Algorithm
Figure 5.1.17 : Confusion Matrix of Random Forest Algorithm
Here, true positive value is 40, false positive value is 30, false negative value is 30 and true negative value is 19.
5.2 Results
5.2.1 Results for Traffic Fatalities Dataset
Performance of the supervised machine learning algorithms on traffic fatalities dataset probability percentage of death by drunk driving.
Algorithm Accuracy Precision Recall F1 score Decision Tree 0.95 0.96 0.96 0.96 Random Forest 100 0.87 0.93 0.90 Logistic Regression 0.94 0.94 0.94 0.94
Naïve Bayes 0.74 0.76 0.75 0.74
SVM 0.67 0.72 0.67 0.65
Table 5.2.1: Results of supervised machine learning algorithms on traffic fatalities dataset.
Figure 5.2.1: Comparing Algorithms using Traffic Fatalities Dataset
5.2.2 Decision for Fatalities Dataset
We applied supervised machine learning algorithms decision tree, random forest, logistic regression, naive bayes, and SVM on traffic fatalities dataset, then found the result of random forest accuracy is 100, decision tree 0.95, logistic regression 0.94, naive bayes 0.74, and SVM 0.67. The random forest algorithm works better than other four algorithms on the traffic fatalities dataset to predict death by drunk driving.
Chapter 6 Conclusion
6.1. Conclusion
The number of traffic fatalities is rising today. We must be aware of it and start taking precautions immediately. We therefore need to know how to recover it and whether we can develop technology that will predict the probability of a drunk driving fatality. In this study, various supervised machine learning classifiers are used on datasets of traffic fatalities. The dataset is ready for those algorithms to be applied after the accident factors have been scaled and fitted. We use support vector machine, decision tree, logistic regression, random forest, naive bayes, and other algorithms to predict the likelihood of drunk driving fatalities early on. On the dataset for traffic fatalities, the Random Forest algorithm performs better.
6.2 Future Work
In the future, we plan to improve the boosting mechanism by using an adaptive boosting algorithm. We will add the relevant information to the traffic database of Bangladesh. In order to increase accuracy, we will utilize a deep learning algorithm. Our focus will be on various causes of death in traffic accidents, and we will gauge the accuracy of our algorithms. We will also incorporate reinforcement machine learning techniques to create an environment that uses artificial intelligence to make better decisions.
REFERENCES
[1] B. Kumeda, F. Zhang, F. Zhou, S. Hussain, A. Almasri and M. Assefa, "Classification of Road Traffic Accident Data Using Machine Learning Algorithms," 2019 IEEE 11th International Conference on Communication Software and Networks (ICCSN), Chongqing, China, 2019, pp. 682-687, doi: 10.1109/ICCSN.2019.8905362.
[2] How alcohol affects driving ability. https://www.nhtsa.gov/risky-driving/drunk-driving [3] Zhou, L., Pan, S., Wang, J., & Vasilakos, A. V. (2017). Machine learning on big data:
Opportunities and challenges. Neurocomputing, 237, 350-361.
[4] Hussain, S. S., Riaz, R., Fatima, T., Rizvi, S. S., Riaz, F., & Kwon, S. J. (2019). A comparative study of supervised machine learning techniques for diagnosing mode of delivery in medical sciences. International Journal of Advanced Computer Science and Applications, 10(12), 120-125.
[5] R. E. AlMamlook, K. M. Kwayu, M. R. Alkasisbeh and A. A. Frefer, "Comparison of Machine Learning Algorithms for Predicting Traffic Accident Severity," 2019 IEEE Jordan International Joint Conference on Electrical Engineering and Information Technology (JEEIT), Amman, Jordan, 2019, pp. 272-276, doi:
10.1109/JEEIT.2019.8717393.
[6] Jamal, A., Zahid, M., Tauhidur Rahman, M., Al-Ahmadi, H. M., Almoshaogeh, M., Farooq, D., & Ahmad, M. (2021). Injury severity prediction of traffic crashes with ensemble machine learning techniques: A comparative study. International journal of injury control and safety promotion, 28(4), 408-427.
[7] Chand, A., Jayesh, S., & Bhasi, A. B. (2021). Road traffic accidents: An overview of data sources, analysis techniques and contributing factors. Materials Today:
Proceedings, 47, 5135-5141.
[8] Barry, V., Schumacher, A., & Sauber-Schatz, E. (2022). Alcohol-impaired driving among adults—USA, 2014–2018. Injury prevention, 28(3), 211-217.
[9] Pourroostaei Ardakani, S., Liang, X., Mengistu, K. T., So, R. S., Wei, X., He, B., &
Cheshmehzangi, A. (2023). Road Car Accident Prediction Using a Machine-Learning- Enabled Data Analysis. Sustainability, 15(7), 5939.
[10] Shah, D. V. (2023). Prediction of Accident Severity Using Machine Learning Algorithms (Doctoral dissertation, Dublin, National College of Ireland).
[11] Shafiq, M., Tian, Z., Bashir, A. K., Jolfaei, A., & Yu, X. (2020). Data mining and machine learning methods for sustainable smart cities traffic classification: A survey. Sustainable Cities and Society, 60, 102177.
[12] Lenk, K. M., Erickson, D. J., Joshi, S., Calvert, C., Nelson, T. F., & Toomey, T. L.
(2021). An examination of how alcohol enforcement strategies by sheriff and police agencies are associated with alcohol-impaired-driving fatal traffic crashes. Traffic injury prevention, 22(6), 419-424.
[13] Ditcharoen, A., Chhour, B., Traikunwaranon, T., Aphivongpanya, N., Maneerat, K., &
Ammarapala, V. (2018, May). Road traffic accidents severity factors: A review paper.
In 2018 5th International Conference on Business and Industrial Research (ICBIR) (pp.
339-343). IEEE.
[14] Chen, Y. (2021). Traffic Crash Prediction Using Machine Learning Models.
[15] Al Mamlook, R. E., Ali, A., Hasan, R. A., & Kazim, H. A. M. (2019, July). Machine learning to predict the freeway traffic accidents-based driving simulation. In 2019 IEEE National Aerospace and Electronics Conference (NAECON) (pp. 630-634). IEEE.
[16] Li, T., Yang, Y., Wang, Y., Chen, C., & Yao, J. (2016). Traffic fatalities prediction based on support vector machine. Archives of Transport, 39.
[17] Tevik, K., Bergh, S., Selbæk, G., Johannessen, A., & Helvik, A. S. (2021). A systematic review of self-report measures used in epidemiological studies to assess alcohol consumption among older adults. PloS one, 16(12), e0261292.
[18] Kumar, S., & Toshniwal, D. (2015). A data mining framework to analyze road accident data. Journal of Big Data, 2(1), 1-18.
[19] R.Sneha,Mrs.P.Jasmine Lois Ebenezer, "PREDICTION OF TRAFFIC VIOLATION USING MACHINE LEARNING", International Journal of Creative Research Thoughts (IJCRT), ISSN:2320-2882, Volume.10, Issue 12, pp.b706-b711, December 2022, [20] Abidin, N. Z., Ismail, A. R., & Emran, N. A. (2018). Performance analysis of machine
learning algorithms for missing value imputation. International Journal of Advanced Computer Science and Applications, 9(6).
[21] Bushover, B., & Morrison, C. (2022). 146 Self-report measures of alcohol-impaired driving: a systematic review.
[22] Singichetti, B. (2023). Characteristics of Initial and Repeat Alcohol Driving While Impaired (Alcohol-DWI) License Suspensions and Impacts on Recidivism and Future Crash Events in North Carolina, 2007-2016 (Doctoral dissertation, The University of North Carolina at Chapel Hill).
[23] Alcohol-Impaired Driving https://crashstats.nhtsa.dot.gov/Api/Public/Publication/
813450 (Access time : 8/21/2023, 10:15pm )
[24] Roudsari B, Ramisetty-Mikler S, Rodriguez LA. Ethnicity, age, and trends in alcohol- related driver fatalities in the United States. Traffic Inj Prev. 2009 Oct;10(5):410-4.
doi: 10.1080/15389580903131506. PMID: 19746303.
[25] Jones, A.W., Morland, J., & Liu, R.H. (Eds.). (2020). Alcohol, Drugs, and Impaired Driving: Forensic Science and Law Enforcement Issues (1st ed.). CRC Press.
https://doi.org/10.4324/9781003030799
![Figure 4.1: Experiment Flow [20].](https://thumb-ap.123doks.com/thumbv2/filepdfnet/11893142.0/21.892.277.640.70.758/figure-4-1-experiment-flow-20.webp)