Risk of Dental Disease Prediction Using Machine Learning
BY
IFFAT FIROZY RIMI ID: 163-15-8432
AND
SHARMIN AKTER ID: 163-15-8436
This Report Presented in Partial Fulfillment of the Requirements for the Degree of Bachelor of Science in Computer Science and Engineering.
Supervised By Md. Tarek Habib Assistant Professor Department of CSE
Daffodil International University
DAFFODIL INTERNATIONAL UNIVERSITY DHAKA, BANGLADESH
8 October 2020
APPROVAL
This Project/internship titled “Risk of Dental Disease Prediction Using Machine Learning”, submitted by Iffat Firozy Rimi, ID No: 163-15-8432 and Sharmin Akter ID No: 163-15-8436 to the Department of Computer Science and Engineering, Daffodil International University has been accepted as satisfactory for the partial fulfillment of the requirements for the degree of B.Sc. in Computer Science and Engineering and approved as to its style and contents. The presentation has been held on 8 October 2020.
BOARD OF EXAMINERS
____________________________
Dr. Syed Akhter Hossain Chairman Professor and Head
Department of Computer Science and Engineering Faculty of Science & Information Technology Daffodil International University
____________________________
Nazmun Nessa Moon Internal Examiner
Assistant Professor
Department of Computer Science and Engineering Faculty of Science & Information Technology Daffodil International University
____________________________
Gazi Zahirul Islam Internal Examiner
Assistant Professor
Department of Computer Science and Engineering Faculty of Science & Information Technology Daffodil International University
__________________________
Dr. Md. Saddam Hossain External Examiner
Assistant Professor
Department of Computer Science and Engineering United International University
DECLARATION
We hereby declare that, this project has been done by us under the supervision of Md.
Tarek Habib, Assistant Professor, Department of CSE Daffodil Internationa University. We also declare that neither this project nor any part of this project has been submitted elsewhere for award of any degree or diploma.
Supervised by:
Md. Tarek Habib Assistant Professor Department of CSE
Daffodil International University
Submitted by:
Iffat Firozy Rimi ID: 163-15-8432 Department of CSE
Daffodil International University
Sharmin Akter ID: 163-15-8436 Department of CSE
Daffodil International University
ACKNOWLEDGEMENT
First, we express our heartiest thanks and gratefulness to Almighty Allah for His divine blessing makes us possible to complete the final year project/internship successfully.
We grateful and wish our profound indebtedness to Md. Tarek Habib, Assistant Professor, Department of CSE Daffodil International University, Dhaka. Deep Knowledge & keen interest of our supervisor in the field of “Machine Learning” to carry out this project. His endless patience, scholarly guidance, continual encouragement, constant and energetic supervision, constructive criticism, valuable advice, reading many inferior drafts and correcting them at all stages have made it possible to complete this project.
We would like to express our heartiest gratitude to Dr. Syed Akhter Hossain, Head, Department of CSE, for his kind help to finish our project and Dr. Md. Ismail Jabiullah, Professor and Nazmun Nessa Moon, Assistant Professor and also to other faculty members and the staff of the CSE department of Daffodil International University.
We would like to thank our entire course mate at Daffodil International University, who took part in this discussion while completing the course work.
Finally, we must acknowledge with due respect the constant support and patients of our parents.
ABSTRACT
Now a day’s dental disease is the major health problem in Bangladesh. So dental care is important to most people of our country. But the cost of dental care services is increasing day by day. We will predict the risk of dental disease with machine learning. We identify the most common disease among people, consult with a dentist about those diseases, reading-related journals, and online articles, we find out the habitats that cause dental disease. Then we collect data based on those factors, such as age, brush before sleep, brush after eating morning, eating chocolates, soft drinks, betel leaf/nut, etc. We collect data from both who have already disease and who don’t. We have two outcomes. One is ‘Yes’
meaning they have dental disease and another is ‘No’ means they don’t have dental disease.
We apply machine-learning algorithms on our processed dataset. Recently machine learning, artificial intelligence, and deep learning used in various predictions and detection systems. We use k-nearest neighbor (KNN), logistic regression, support vector machine (SVM), naïve Bayes, random forest, adaptive boosting (ADA boosting), decision tree, multilayer perceptron (MLP-ANN), Linear Discriminant Analysis (LDA) and gradient boosting classifier. In our work, we use those factors answer as input and after processing and applying the algorithm, we find out addicted or not addicted as our output with the accuracy of 95.89% on the logistic regression algorithm.
TABLE OF CONTENTS
CONTENTS PAGE
Board of examiners... i
Declaration... ii
Acknowledgements ………. iii
Abstract... iv
CHAPTER PAGE CHAPTER 1: INTRODUCTION 1-4
1.1 Introduction……… 11.2 Motivation……….. 1
1.3 Rationale of the study……… 3
1.4 Research Questions……… 4
1.5 Expected Outcome….……… 4
1.6 Report Layout……...………. 4
CHAPTER 2: BACKGROUND STUDY 5-19 2.1 Introduction……… 5
2.2 Related Works ………. 5
2.3 Comparative Analysis and Summary……….... 13
2.4 Scope of the Problem ……… 18
2.5 Challenges ……… 18
CHAPTER 3: RESEARCH METHODOLOGY 20-31 3.1 Introduction………. 20
3.2 Data collection process……… 20
3.3 Research Subject and Instrumentation……… 22
3.4 Statistical Analysis………. 25
3.5 Implementation Requirements……… 31
CHAPTER 4: EXPERIMENTAL RESULTS AND 32-46 DISCUSSION 4.1 Introduction………. 32
4.2Experimental Results & Analysis……….. 32
4.3 Discussion………... 46
CHAPTER 5: IMPACT ON SOCIETY, ENVIRONMENT 47-48 AND SUSTAINABILITY 5.1 Impact on Society……… 47
5.2 Impact on Environment……… 47
5.3 Ethical Aspects……… 48
5.4 Sustainability Plan……….. 48
CHAPTER 6: SUMMARY, CONCLUSION, 49-50 RECOMMENDATION AND IMPLICATION FOR FUTURE RESEARCH 6.1 Summary of the Study………. 49
6.2 Limitations and Conclusions……….. 49
6.3 Implication for Further Study……….... 50
REFERENCES……… APPENDICES………. 51 54
PLAGIARISM REPORT………..55
LIST OF TABLES
TABLES PAGE
Table 2.1: Summary of related research work.……… ……… 12 Table 4.1: Summary Of Accuracy... 38 Table 4.2: Confusion Matrix Of All Classifier ………....
45 Table 4.3: Classifier Performance Evaluation………..
Table 4.4: Results of comparison...
46 47
LIST OF FIGRES
FIGURES PAGE NO
Figure 3.3.1: Workflow of our proposed methodology 22
Figure 3.3.2: Workflow of data preprocessing. 23
Figure 3.4.1: Addicted and not addicted cases. 24
Figure 3.4.2: Dental disease and age case. 25
Figure 3.4.3: Dental disease and smoke per day case. 26 Figure 3.4.4: Relation between dental disease and some features. 27 Figure 3.4.5-8: Different distribution of features of dental diseases. 28 - 29
Figure 3.4.9: Correlation Matrix. 30
Figure 3.4.10: Shows which feature has noisy value. 31 Figure 3.4.11: Shows noisy value on age is removed. 31
Figure 4.2.1: Accuracy before applying PCA. 34
Figure 4.2.2: Accuracy after applying PCA. 35
Figure 4.2.3: Accuracy with unprocessed data. 36
Figure 4.2.4: ROC curve of KNN algorithm. 40
Figure 4.2.5: ROC curve of Logistic regression algorithm. 40
Figure 4.2.6: ROC curve of SVM algorithm. 41
Figure 4.2.7: ROC curve of Naïve Bayes algorithm. 41 Figure 4.2.8: ROC curve of Random forest algorithm. 42 Figure 4.2.9: ROC curve of Decision tree algorithm. 42 Figure 4.2.10: ROC curve of ADA boosting classifier. 43
Figure 4.2.11: ROC curve of MLP-ANN algorithm. 43
Figure 4.2.12: ROC curve of Latent Dirichlet Allocation (LDA). 44 Figure 4.2.13: ROC curve of Gradient boosting classifier. 44
CHAPTER 1 INTRODUCTION 1.1 Introduction
In Bangladesh dental problem is growing rapidly that needs to resolve and forties rapid growth it marks as one of the public health problems. So, it is the crying need of the country to have adequate information on the pattern of dental diseases and to take the necessary prevention program to fight against dental diseases. Because of the increase in population, and the corresponding rise in dental needs, we appreciate more and more each day that we are fighting a losing battle by a mere emphasis on therapy; this is neither adequate nor progressive.
Prevention, not therapy is today's challenge and hopefully, tomorrow's achievement [1], The principal causes to poor dental health are shared by those responsible for chronic diseases; first of all, these factors are related to poor diet, tobacco use, excessive use of alcohol and physical inactivity [2]. The joint action of communities, professionals, and individuals aimed at reducing the impact of sugar consumption and emphasizing the beneficial impact of fluoride can prevent dental caries and tobacco intervention and proper oral hygiene can help prevention of periodontal disease [3]. A study was done in London among 1072 patients to determine their knowledge of the correlation between smoking and periodontal disease. Also, the number of dentists concerning the population is one of the lowest in Bangladesh. There is one dental surgeon for every 0.2 million people [4]. Besides, there are private dental clinics where dental treatment is done on huge payment. Due to the unawareness of the causes that lead to dental disease and not having the proper knowledge to avoid the habitant of this problem people are making a wrong decision and they are not taking proper prevention to avoid this situation. This project aims to predict the risk of dental disease so that people came to know which habitant may cause dental disease. And to find these criteria we take the help of machine learning to predict which habitant is more dangerous and which one should we emphasize most to prevent dental disease.
1.2 MOTIVATION
In Bangladesh, the term oral health is not very common. Most people in Bangladesh think dental disease means something that has to do with teeth but oral health is also a part of dental disease.
Oral health deals with the general condition of the mouth, mouth cavity, teeth, and associated structures. In Bangladesh, it has been studied that more than 80 percent of the population has at least one or more oral and dental diseases. Most of them suffer from periodontitis, gingivitis, dental caries, pulpitis, alveolar abscess, etc. There are also dental cysts, carcinoma of the oral cavity. In cities nowadays people are growing concern about these diseases but in a rural area, people are comparatively much ignorant regarding oral hygiene. Most often they use neem sticks, ashes, muds to clean their teeth in the morning. They don't even care about brushing their teeth at night. Also, there is no facility for any type of dental treatment in a rural area, people who live in a rural area have to go to the nearby Upazila for health care issues. Even after that, it is difficult to provide conservative and prosthetic dental treatment to the village people, so most people in the village are they can't even get artificial dentures after losing their teeth. In recent studies, it shows that there are 3705 dentists have been registered for a population of 150 million. Therefore, it has been calculated that the ratio of dentists to population is 46000:1. So for that reason majority of the people in Bangladesh especially in rural areas, are not getting any proper treatment, so most of the time they have to rely on traditional (unqualified) dentists. In traditional treatment, the most common practice is the extraction of the teeth. If someone wants to get the modern treatment they need to move to larger cities. Which is very difficult for the people who live in rural areas. According to the WHO data published in April 2011, the oral cancer death in Bangladesh reached 11, 562 or 1.21% of the total deaths reported. The age‐adjusted death rate of 12.52 per 100,000 of population ranks Bangladesh as number 4 in the World [5]. Only 1591 dental health technologists are available in the country and no primary oral health workers or oral hygienists [6]. There is no national‐level information about the distribution of oral diseases in Bangladesh.
On the other hand, Dentistry is a small industry, so companies that manufacture dental equipment and materials need to charge each dentist a lot for the companies to recuperate the cost of research and development. Dentistry is expensive because both the setup cost and running cost for a dental practice are very high.
Therefore, we will try to anticipate in advance if we tend to become affected by any dental disease. We have not seen much research in this field. We are going to do this prediction using the machine learning technique.
1.3 Rationale of the Study
As we mentioned earlier, there is less significant work has done previously with dental disease prediction in Bangladeshi perspective. That is why we are interested to work with the risk of dental disease and machine learning techniques. Machine learning is a branch of artificial intelligence that employs a variety of statistical, probabilistic, and optimization techniques that allows computers to "learn" from past examples and to detect hard-to-discern patterns from large, noisy, or complex data sets. Machine learning methods used in a wide range of applications ranging from detecting and classifying. Machine learning is used for cancer prediction [7], a systemic review of software fault prediction [8], dermatological disease detection [9], and so on. Many types of detection and risk prediction are now conducting by using machine learning. Machine learning techniques may have a supplementary role in highly complex problems and provide a comparison to regression results. [10]. As machine learning has a vast field of work, we thought that we should apply machine learning for our work of prediction.
1.4 Research Questions
• How do we identify who has dental disease?
• What is the risk that causes dental disease?
• What will our original data be like?
• Do we need to train our original data to the machine learning model?
• What amount of data do we collect and where do we collect it?
• Does our data and machine learning will be compatible?
• Should we use popular machine learning techniques or use a new machine learning technique?
1.5 Expected Outcome
We hope our research will help people to predict. By using this technique, people can easily and quickly know the risk of dental disease. People can also know more about prediction with machine learning. Successful deployment of existing or new machine learning algorithms for predicting dental disease.
When It comes to anything dental related, we normally think about brushing teeth daily two times. But it's not all about brushing our teeth. Our food habit has a great impact on dental disease. Especially for children they love eating sweet things and after that, they don't even concern about dental issues, as they are children is supposed to be their parents' concern to take care of them, but most Bengali parents are not aware of that because they are also careless.
Most often in rural areas, people are addicted to eating betel leaf and they don't even think about brushing their teeth after that. In big cities, young people are mostly fond of soft drinks and they take an excessive amount of soft drinks daily. Also, the sleeping pattern in cities is a big concern. Our model mainly aims to find all of these areas where people are not taking any concern about their daily eating system.
1.6 Report Layout
This research paper contains the following contents as given below:
Chapter one explains the introduction of the research with its relation with study, motivation, research questions and outcomes.
Chapter two discuss about work, research summary, the scope of problems and challenges.
Chapter three contains the workflow of this research, procedure of data collection, feature implementation and statistical analysis.
Chapter four covers experimental evaluation and some relevant discussions, the outcome of research via numerically and graphically.
Chapter five covers this research impact on society.
Chapter six contains a summary of this research work along with the limitation and future work.
CHAPTER 2
BACKGROUND STUDY 2.1 Introduction
In this section, we will discuss related works, research summary, the scope of the problem, and challenges. In the part of the related work, we summarize some research papers, related works, underlying methods, classifiers, and accuracies of which related to our work. In the research summary part, we prepare a summary of some related works and display them in a table for better and easy understanding. The scope of the problem part discusses how we can contribute to the problem with our work model. Finally, the Challenges part contains some words about the obstacles and dangers we encountered during this research work.
2.2 Related Works
This literature review section of this research paper is going to present the near past related works done by some researchers on disease prediction. We have followed and studied their work to understand the processes and methods expressed by them.
Dhiraj Dahiwade et al. [11] has proposed a general disease prediction system, which based on machine learning algorithms. They proposed disease prediction based on the syndromes of the patient. They used disease evidence in their dataset. They collected the living habits of a person and checkup information as to their data for the prediction system. They remove comma, punctuations, and blank space in data preprocessing and used the dataset as a training dataset. The dataset of patient disease downloaded from UCI machine-learning website. They used KNN and CNN algorithms. In KNN, Euclidean distance, Hamming distance used as common distance metrics. In CNN, the dataset converted into vector from for implementation. Max pooling operation performed at the convolutional stage on CNN.
KNN took more time than CNN. They compare two algorithms based on the accuracy and time and found 84.5% accuracy in CNN, which was greater than KNN. They use Java for case implementation, MySQL in the backend.
Ahmed M. Alaa et al [12] has proposed a machine learning-based model for predicting disease risk of cardiovascular on Biobank participants. Their created ML-based model can predict CVD risk based on 473 variables. In their model, they used AutoPrognosis algorithmic tool. AutoPrognosis tool automatically selects and tunes ensembles of ML modeling pipelines. They compared their model with well-established risk prediction models like Framingham score, Cox proportional hazard. They used for 473 variables in their model. They considered patients' usual walking, health rating, diabetes, and breathing rate for the analysis of the CVD disease risk. They collected data from 22 assessment centers across England, Wales, and Scotland from 2006 to 2010. All their data also kept a store in UK Biobank. They used seven core risk factors; there are age, gender, systolic blood pressure, smoking status, hypertension, diabetes, and BMI. They had 423604participators from the UK. In their train model, AutoPrognosis conducted 200 iterations of the Bayesian Optimization Procedure. Generally, AutoPrognosis contains 5460 possible ML pipelines but in their model, they had used seven imputation algorithms, nine feature algorithms, twenty classification algorithms, and three calibration methods. They used a random forest algorithm for variable ranking. Their risk prediction AutoPrognosis model performance evaluated based on the area under the receiver operating characteristics curve (AUC-ROC).
Their proposed model had AUC-ROC: 0.774 where the Framingham model had 0.724 and the Cox PH model had 0.734. Using their AutoPrognosis model for CVD risk prediction in UK Biobank increases accuracy. The limitation of their model was the absence of cholesterol biomarkers in a data repository.
Hiba Asri el at [13] has proposed a machine learning-based model for predicting breast cancer risk and diagnosis. The proposed classification and data mining methods are an effective way to classify data. Especially in the medical field, where those methods are widely used in diagnosis and analysis to make decisions. In their paper, they performed a comparison between different machine learning algorithms: Support Vector Machine (SVM), Decision Tree (C4.5), Naive Bayes (NB), and k Nearest Neighbors (k-NN) on the Wisconsin Breast Cancer (original) datasets is conducted. The main objective is to assess the correctness in classifying data concerning the efficiency and effectiveness of each algorithm in terms of accuracy, precision, sensitivity, and specificity. Experimental results
show that SVM gives the highest accuracy (97.13%) with the lowest error rate. All experiments are executed within a simulation environment and conducted in the WEKA data mining tool.
Xue-hue Meng el at [14] has proposed a comparison of three data mining models for predicting diabetes or pre-diabetes by the risk factors. In this paper they compare the performance of logistic regression, artificial neural networks (ANNs), and decision tree models for predicting diabetes or pre-diabetes using common risk factors. Participants came from two communities in Guangzhou, China; 735 patients confirmed to have diabetes or pre-diabetes and 752 normal controls were recruited. A standard questionnaire was administered to obtain information on demographic characteristics, family diabetes history, anthropometric measurements, and lifestyle risk factors. Then they developed three predictive models using 12 input variables and one output variable from the questionnaire information; they evaluated the three models in terms of their accuracy, sensitivity, and specificity. The logistic regression model achieved a classification accuracy of 76.13%. The ANN model reached a classification accuracy of 73.23% and the decision tree (C5.0) achieved a classification accuracy of 77.87%. The decision tree model (C5.0) had the best classification accuracy, followed by the logistic regression model, and the ANN gave the lowest accuracy.
Miguel Angel Fernandez-Granero et al. [15] has proposed a model for predicting exacerbations of obstructive pulmonary disease with machine learning features. They had proposed a new data-driven methodology for developing a prediction model. Their model had learned from past experiences and made a new pattern with clinical data. They tried to predict COPD with the patient's daily symptoms report with the help of a pattern recognition mechanism. They had prepared their dataset with the score of symptoms. They collected data and samples of 16 patients at home for six months each day. Pneumology and Allergy Department of the University Hospital Puerta del Mar of Cadiz (Spain) was monitoring the whole process. Patients were aged above 60 years and had cumulative tobacco consumption. They got a total of 789 records from the patients and applied these in their model. They used three classifiers; they were radial basis function neural network (RBF), k-means classifier (K-means) and probabilistic neural network (PNN). For graphical
analysis, signal processing they used MATLAB. The classifiers had evaluated based on accuracy, specificity, sensitivity, confusion matrix, positive predictive value, and negative predictive value. PNN got the best accuracy with 89.3% accuracy, 84.1% sensitivity, and 92.5% specificity. In the future, they wanted to improve the consistency of the result with their proposed data-driven method.
Md. Tarek Habib et al. [16] has done a study on Papaya disease recognition based on a machine learning classification technique. They used defective papayas color images. They converted all images into 300 x 300 pixels. Bicubic interpolation and histogram equalization were used for image processing. They used a total of 129 images of defective and defect-free in their model. They divided their dataset into two parts, two-third as a training dataset and one-third as a testing dataset. They have used several machine learning classification techniques. The techniques are SVMs, C4.5, Naïve Bayes, Logistic Regression, KNN, Random Forest, BPN, CPN, and RIPPER. They had worked with five common diseases in their work. Among these techniques, SVM has performed best. SVM has produced 95.2% accuracy among all classifiers.
Prof. B. B. Shah and S. S. Chikkmat [17] designed a web based medical health care and management system to resolve the issues related to the management of health checkup, appointments, reports. They also used a disease prediction model which predicts Heart Diseases for the patients. In order to predict disease three different classifiers are used by them which predicts heart disease. KNN classifier has the lowest accuracy compared to the SVM and random forest. The three classifiers have got different accuracy, SVM & Random forest have got same accuracy 85.24% & K-Nearest Neighbour have got 67.21% accuracy.
Renee Christina, Vanithamani, Dhivya [18] created a model to identify the and detect the dental caries. They designed Near-infrared (NIR) is a non-ionizing, non-invasive method to identify and quantify caries at any stage. In dental imaging, the tooth’s optical property exhibits lower absorption of stain and deeper penetration into tooth because the enamel is highly transparent to NIR. The image captured using NIR camera is of low contrast and resolution and requires visual enhancement. It is performed using morphological operations. The features are extracted from the Otsu’s segmented caries image. The feature
subset using the Gray -Level Co- occurrence Matrix (GLCM) are extracted, trained and tested using Support Vector Machine (SVM)classifier. SVM classifier categorizes the affected region in the image as normal or abnormal. The performance of the SVM classifier is compared with Scaled Conjugate Gradient – BacN Propagation NetworN (SCG-BPN) classifier and Generalized Regression NetworN (GRN) classifier.
Shahadat Uddin, Arif Khan, Md Ekramul Hossain and Mohammad Ali Moni [19] did research Comparing different supervised machine learning algorithms for disease prediction. They identify the key trends among different types of supervised machine learning algorithms and their performance and usage for disease risk prediction. For their study, they did extensive research to identify those studies that applied more than one supervised machine learning algorithm on single disease prediction. They selected 48 articles in total for the comparison among variants supervised machine learning algorithms for disease prediction. They found that the Support Vector Machine (SVM) algorithm is applied most frequently (in 29 studies) followed by the Naïve Bayes algorithm (in 23 studies). However, the Random Forest (RF) algorithm showed superior accuracy comparatively. Of the 17 studies where it was applied, RF showed the highest accuracy in 9 of them, i.e., 53%. This was followed by SVM which topped in 41% of the studies it was considered.
S. A. Prajapati, R. Nagaraj and S. Mitra [20] proposed a model to classified dental disease using the CNN algorithm and Transfer Learning. A labeled dataset consisting of 251 Radio Videography (RVG) x-ray images of 3 different classes is used by them for classification.
They decided to go with the Convolutional neural network (CNN) as it is one of the most effective tools in machine learning which enables solving problems like image recognition, segmentation, classification, etc., with a high order of accuracy. It is stated that CNN performs well in natural image classification problems where a large dataset is available.
So, they experimented on the performance of CNN for the diagnosis of a small labeled dental dataset. In addition, transfer learning also used to improve accuracy. They scaled the images down to 500 x 748 and fed as an input to the network. Reducing the image dimension results in information loss. The network consists of 5 convolution layers, 2 max- pooling layers, and 4 fully connected (FC) layers. All the convolution layers and the FC
layers (except the last FC layer) have the activation function ReLU. The softmax activation function is applied to the last FC layer. Dropout is used to overcome the problem of over fitting. Three different models have been designed on two different architectures. Transfer learning with the VGG16 pre-trained model was used to achieve better accuracy. A small dataset consisting of 251 RVG x-ray images was used for training and testing purposes.
Experimental results for different models were discussed. The overall accuracy of 88.46%
was achieved.
Shivalingappa Basavantappa Javali, Mohan Anantarao Sunkad, Appasaheb Saheb Wantamutte [21] studied on predicting the risk factors of periodontal disease by logistic regression. Their study was to analyze the dependence of oral health diseases i.e.
periodontal disease by Community Periodontal Index of Treatment Needs (CPITN) by considering the number of risk factors through the applications of logistic regression model.
This cross-sectional study involves a systematic random sample of 600 permanent dentition aged between 18-40 years in Karnataka, India. The mean age was 34.26±7.28. The risk factors of periodontal disease were established by multiple logistic regression models using SPSS 21.0 statistical software. They focused on the factors like frequency of brushing, timings of cleaning teeth, and type of toothpaste are significant persistent predictors of periodontal disease. The log likelihood value of the full model is –1085.7876 and AIC is 1.2577 followed by reduced regression model are -1019.8106 and 1.1748 respectively for periodontal disease. The area under the receiver operating characteristic (ROC) curve for the periodontal disease is 0.6128 (full model) and 0.5821 (reduced model).
Jae-Hong Leea, Do-Hyung Kima, Seong-Nyum Jeonga, Seong-Ho Choib [22] proposed a model about the detection and diagnosis of dental caries using a deep learning-based convolutional neural network algorithm. Their goal was to use the deep convolutional neural networks (CNNs) which is very good in terms of medical research. They found an impressive result in diagnosis and prediction in the fields of radiology and pathology. They used total of 3000 periapical radiographic images which then divided into a training and validation dataset (n = 2400 [80%]) and a test dataset (n = 600 [20%]). A pre-trained GoogLeNet Inception v3 CNN network was used for preprocessing and transfer learning.
The diagnostic accuracy, sensitivity, specificity, positive predictive value, negative
predictive value, receiver operating characteristic (ROC) curve, and area under the curve (AUC) were calculated for the detection and diagnostic performance of the deep CNN algorithm. Results: The diagnostic accuracies of premolar, molar, and both premolar and molar models were 89.0% (80.4–93.3), 88.0% (79.2–93.1), and 82.0% (75.5–87.1), respectively. The deep CNN algorithm achieved an AUC of 0.917 (95% CI 0.860–0.975) on the premolar, an AUC of 0.890 (95% CI 0.819–0.961) on a molar, and an AUC of 0.845 (95% CI 0.790–0.901) on both premolar and molar models. The premolar model provided the best AUC, which was significantly greater than those for other models (P < 0.001).
Conclusions: This study highlighted the potential utility of deep CNN architecture for the detection and diagnosis of dental caries.
Prof. Bharat Burghate, Kirti Nagane, Nikita Dongre, Anshita Dhar, and Divya Jadhav [23]
proposed a study for predicting enriching Gum Disease using Machine Learning. They aimed to design the system by performing the prognosis that can be found at very initial level and they designed the system considering every possible symptom. They wanted to check the most common form of gum diseases which are gingivitis and periodontitis is predictable using the techniques of Machine Learning. SO they decided to choose "Hidden Marcov Model" along with Dempster Shaffer Reasoning in this system, which helps in the diagnosis of the symptoms that might be hidden. Most of the techniques may have performance snag related to Gum Disease Detection Systems scarcely not produce the desired output. So their model concentrated on overcoming the issues which are relevant to the performance and also it did propose a novel idea for the detections of gum disease.
Moreover, their developed software has the functionality to take input the images of a patient who is suffering from gum disease and then it processed using clustering methodologies and later the desktop application generates the resultants in the form of ranges by processing over the provided symptoms and images.
Bhornsawan Thanathornwong, Siriwan Suebnukarn [24] designed a model for automatic detection of periodontally compromised teeth in digital panoramic radiographs using faster regional convolutional neural network. In order to test their model, they collected around 100 digital panoramic radiographs of periodontally compromised patients from their hospital's information system and augmented. Then they used the keras library to train and
test the model which were periodontally compromised teeth found in each image were annotated by experts in periodontology to obtain the ground truth. They used the faster R- CNN model to use a pre-trained ResNet architecture. They got the average precision rate of 0.81 demonstrated that was a significant region of overlap between the predicted regions and the ground truth. The average recall rate of 0.80 showed that the periodontally compromised teeth regions generated by the detection method excluded the healthiest teeth areas. In addition, their model achieved a sensitivity of 0.84, a specificity of 0.88, and an F-measure of 0.81.
2.3 Comparative Analysis and Summary
Some work has already done about prediction and detection with the machine learning algorithm and data mining process. Nowadays, the use of machine learning technology has increased with the use of various disease detection. The comparison between these related works has shown in this part. Here, the comparison of different research works with their subject, methodology, and the outcome are given below in Table 2.1.
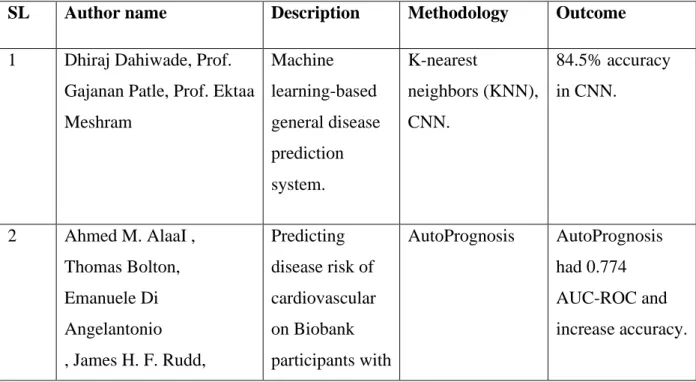
TABLE 2.1: SUMMARY OF RELATED RESEARCH WORK.
SL Author name Description Methodology Outcome 1 Dhiraj Dahiwade, Prof.
Gajanan Patle, Prof. Ektaa Meshram
Machine learning-based general disease prediction system.
K-nearest
neighbors (KNN), CNN.
84.5% accuracy in CNN.
2 Ahmed M. AlaaI , Thomas Bolton, Emanuele Di Angelantonio , James H. F. Rudd,
Predicting disease risk of cardiovascular on Biobank participants with
AutoPrognosis AutoPrognosis had 0.774 AUC-ROC and increase accuracy.
Mihaela van der Schaar machine learning.
3 Hiba Asria, Hajar Mousannif ,Hassan Al Moatassime, Thomas Noeld
Using Machine Learning Algorithms for Breast Cancer Risk Prediction and Diagnosis
Support Vector Machine(SVM), Decision Tree (C4.5), Naive Bayes(NB) and k Nearest
Neighbors(k-NN)
SVM gives the highest accuracy (97.13%).
4 Xue-HuiMeng, Yi- XiangHuang. Dong- PingRao, QiuZhang QingLiu
Comparison of three data mining models for predicting diabetes or prediabetes by risk factors
Logistic regression, decision tree, ann
Decision tree gives the best accuracy 80.68%
5 Miguel Angel FernandezGranero, Daniel Sanchez-
Morillo, Miguel Angel Lopez-Gordo , Antonio Leon
predicting exacerbations of obstructive pulmonary disease with machine
learning features
Radial basis function neural network, Kmeans, probabilistic neural network
PNN had 89.3%
accuracy, 84.1%
sensitivity and 92.5%
specificity
6 Md. Tarek Habib, Anup Majumder, Rabindra Nath Nandi, Farruk Ahmed, and
Mohammad Shorif Uddin.
Papaya disease recognition based on a machine learning classification technique
SVM, C4.5, naïve bayes, logistic regression, KNN, random forest, BPN, CPN and RIPPER.
SVM got 95.2%
accuracy.
7 Prof. B. B. Shah and S. S.
Chikkmat
Disease
Prediction with Machine Learning Algorithm
SVM, Random Forest & KNN.
SVM got 85.24%
accuracy, Random forest got 85.24%
accuracy,
KNN got 67.21%
accuracy.
8 Renee Christina, Vanithamani, Dhivya
Dental caries detection using NIR imaging technique.
SVM, SCG-BPN, GRNN
SVM got 95%
accuracy, SCG- BPN got 90%
accuracy, GRNN got 80%
accuracy.
9 Shahadat Uddin, Arif Khan, Md Ekramul Hossain and Mohammad Ali Moni
Comparing different supervised machine learning algorithms for disease
prediction
SVM, Naïve Bayes and Random Forest.
Random Forest: 53%.
SVM: 41%
10 Shreyansh A. Prajapati, R. Nagaraj and Suman Mitra
Classification of Dental Diseases U sing CNN and Transfer
Learning
CNN, Transfer Learning,
Transfer learning with fine tuning
CNN got 73.07%
accuracy,
Transfer learning got: 88.46%
accuracy,
Transfer learning with fine tuning got 88.46%
accuracy 11 Shivalingappa
Basavantappa Javali, Mohan Anantarao Sunkad, Appasaheb Saheb Wantamutte
Predicting the risk factors of periodontal disease by logistic regression
Multiple logistic regression model
ROC curve for the full model is 0.7509, 61%
accuracy in full model
12 Jae-Hong Leea, Do- Hyung Kima, Seong- Nyum Jeonga, Seong-Ho Choib
Detection and diagnosis of dental caries using a deep learning-based convolutional neural network algorithm
Deep CNN Algorithm
premolar model provided the best AUC with 91.7%
13 Prof. Bharat Burghate,Kirti Nagane,Nikita Dongre,Anshita Dhar,Divya Jadhav
Enriching Gum Disease
Prediction using Machine
Learning
K means clustering for preprocessing the image for cluster and vigorous scrutinization is done using HMM and Dumpster Shaffer
theory to yield best results of gum disease detection , quality metrics NMAE
machine learning method for gum disease prediction is having less NMAE
14 Bhornsawan Thanathornwong, Siriwan Suebnukarn
Automatic detection of periodontal compromised teeth in digital panoramic radiographs using faster regional convolutional neural networks
Regional convolutional neural network (faster R-CNN) with ResNet architecture.
Precision rate:81%
Currently, a combination of machine learning, artificial intelligence, and deep learning is being explored with new technologies that are used in any kind of prediction and detection model.
Diagnosis and detection of material are being done recently using various machine learning algorithms. ANN, KNN, CNN, SVM, logistic regression, and many algorithms are popular for any detection model. From previous research, we can see that the KNN, SVM, Random forest, ANN, Naïve Bayes, and Decision tree algorithm's popularity and effectiveness for prediction or detection models are high. In our research, we have tried to implement KNN, SVM, Random forest, MLP, Logistic regression, Naïve Bayes and other algorithms to predicts the risk of dental disease in Bangladesh’s perspective and we have 94.87% accuracy in logistic regression.
2.4 Scope of the Problem
The research is helping to create a model that can predict dental disease by analyzing data and using machine-learning algorithms. This model will help us to predict the causes of dental disease and thus it will be helpful for society to avoid dental issues. In our society, even people have some knowledge about the causes of dental disease but they are not aware of the fact that which action is more responsible for dental disease. So, this model is solely working on finding the causes that can lead to dental problems. For the children, parents are trying to prevent them from eating anything that can be harmful to their teeth, so even after all of these concerns it has
been seen that most of these children are growing up with some kinds of dental problems. It's not that their parents are not concern about their children's dental problem but they don't have the knowledge which food is harming their teeth most or which daily habitant they should follow to prevent these problems. It's not only applicable for the children but it can be applicable for all the ages, they can't find out the problem. So, our model is going to predict those issues for them. Using machine learning and artificial intelligence we are creating a model that will tell us which habitant is harming most. And that is the reason we thought about creating a model that can predict dental diseases.
2.5 Challenges
While doing our research we are facing some problems. Data collection was very challenging for us. Those who have the dental disease do not want to talk easily and do not want to admit.
Besides, ordinary people and affected people cannot be easily distinguished. We read a lot of newspapers and talked to different people, talking to people in the neighborhood, but nobody was going to give any information about their dental disease people. It was very difficult to collect information about the disease from our campus, stations, and unknown places. After that we able to collect our data from the Ad-Din Medical College Hospital. We searched for some more dental clinics but did not want to help us with any information. We needed to talk to Parsons to Parsons for the data collection but we could not do that because the hospital authorities had Privacy issues.
We were also not familiar with Anaconda, Jupyter notebook, and some new machine learning algorithms. It took us a while to know and learn about it at first, but with the help of our supervisor and doing more practice we can grab them easily. Then we continue to do our job very well and with enthusiasm.
CHAPTER 3
RESEARCH METHODOLOGY
3.1 Introduction
The purpose of this research is to establish a model for predicting the risk of becoming dental disease. The Prediction Model is created based on the daily life information of people and some other related information. To create this model, we have applied various machine-learning algorithms. We used k-nearest neighbor (KNN), logistic regression, support vector machine (SVM), naïve Bayes, random forest, adaptive boosting (ADA boosting), decision tree, multilayer perceptron (MLP-ANN), Linear Discrimination Analysis (LDA) and gradient boosting classifier in this research. Algorithms used in the model for classification purposes. We used twenty-four key factors that were very closely connected with addiction. We analyzed some of the features that were responsible for the outcome. We processed our dataset before implantation. We have calculated three types and compared them. We calculated and computed the accuracy, sensitivity, specificity, precision, recall, f1-score and roc-curve of each algorithm to select the appropriate algorithm for the model. We found Logistic regression had the best accuracy and suitable for our proposed model.
3.2 Data Collection Process
The data set is a huge collection of necessary and relatable coordinates that can be easily accessed and changed. We first try to find out the whereabouts of affected people in our neighborhood and in different places. However, we saw someone around us who have dental disease but refused to give us data. Then we decided to go to the dental care center and medical hospital. We also collect information from some private clinics. Some of those hospitals were in their privacy issues and they refused to give us information. Ad-Din Medical College and Hospital & some dental care center helped us with the information.
In addition to providing information, we can learn from their consultants and doctors about many more important factors. We were not able to collect the information as we went to
the patients because the hospital authorities said it could damage patients' privacy.
Therefore, we created the form and provided it to them and the hospital authorities helped us with information from their patients' and patients’ databases. We were able to collect data of 1012 people based on 25 factors. There are 612 affected’ information and 400 healthy people's information we have. We collected all our data from Daffodil International University, Ad-Din Medical College and Hospital & some dental care center. We collected our data based on the following factors:
• Method of Brushing
• Time for brushing
• Brush too hard
• Brush after eating breakfast
• Brush before sleep at night
• Smoke
• Smokeless tobacco
• Drink alcohol
• Coffee
• Coffee with/out sugar
• Sweet
• Fast-food
• Binge eating
• Soft drinks
• Open packets
• Chewing pen-pencil
• Nail biting
• Grinding teeth
• Potato chips
• Betel leaf/nut
• Betel leaf/nut in a day
• Toothpick
• Chocolate
• Diabetes
To identify the risk of becoming affected to dental disease we have to consider each of these factors. We find out about these factors by talking to various physicians, websites and articles [25],[26],[27],[28],[29],[30],[31],[32],[33],[34],[35],[36],[37],[38],[39], [40].
3.3 Research Subject and Instrumentation
At present, machine learning algorithms, data mining and deep learning are very popular for any prediction and detection. We will apply our collected data to various algorithms to see which algorithms will perform well for our model. We use various machine-learning algorithms; they are KNN, Logistic regression, Support Vector Machine (SVM), Naïve Bayes, Decision tree, Random forest, Multilayer perception (MLP-ANN), Gaussian Discriminant Analysis (GDA) and others algorithms. We used ‘Python’ as a programming language and ‘Anaconda navigator’, ‘Jupiter notebook’ as a data mining tool and
‘Microsoft Excel’ as our dataset in our research work.
3.3.1 Proposed Methodology
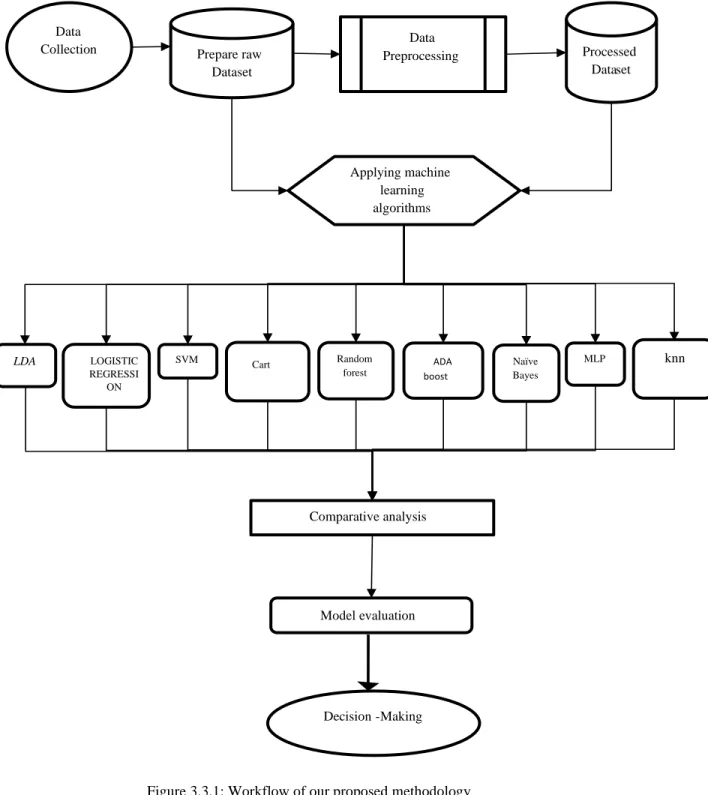
Our proposed methodology is shown below in Figure 3.3.1.
Figure 3.3.1: Workflow of our proposed methodology
Data
Collection Prepare raw
Dataset
Data
Preprocessing Processed
Dataset
Applying machine learning algorithms
LOGISTIC REGRESSI
ON
LDA SVM Cart Random
forest
ADA boost
Naïve Bayes
MLP knn
Comparative analysis
Model evaluation
Decision-Making
3.3.2 Data preprocessing
After collecting the data, we get some missing data, categorical data, numerical and text data. Then we decide that through data processing, we will make this data suitable for algorithms. Data processing is the ability to transform data into a suitable format after collecting data. Processing information or data in a specific format that helps to easily output.
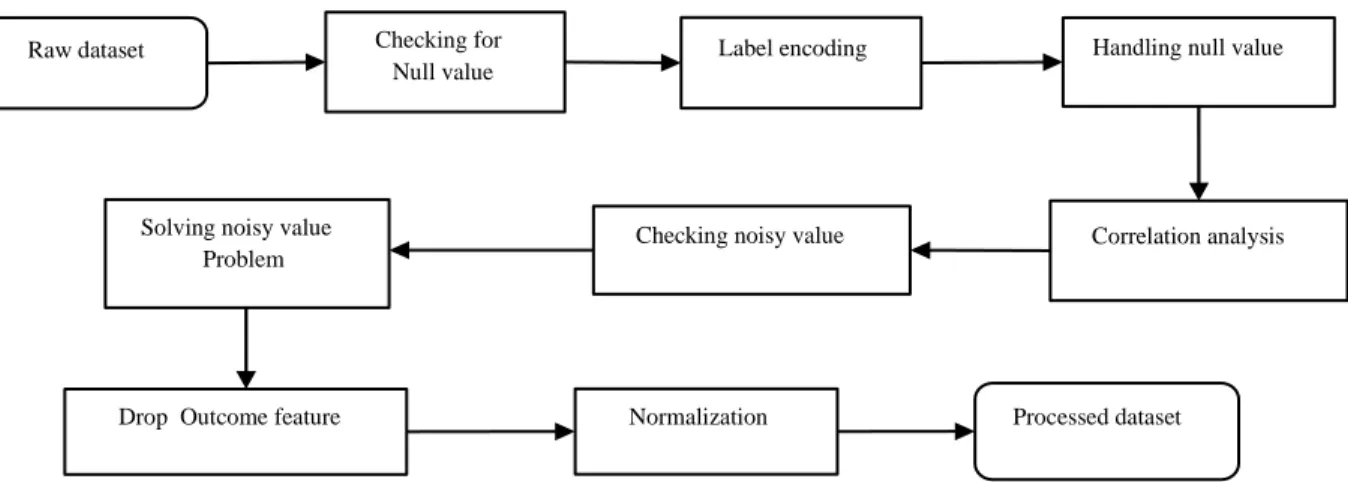
Our data preprocessing method is shown below in Figure 3.3.2
Figure 3.3.2: Workflow of data preprocessing.
First, we started the work of data cleaning. We check if there is a null value in the data set. We then encode the level that converts the text data to numerical data. We solved the missing value problem using imputer and median. Then we check if there is a noisy value in the data set using a box plot. Here we can see that there was some noisy data in the numerical data. Then we analyze the correlation matrix as a data integration process. This matrix shows us the ratio of each data connected to each data. Data is highly connected by a positive value and the negative value means that the data is negatively connected and zero indicates that the data does not connect to itself. We remove noisy values by using outlier quantile detection. Then we drop our outcome feature, that was, the addicted column. We create a separate histogram of each feature that helps us with data reduction and data visualization in feature engineering. Through normalization, we completed the data transformation. Thus, we finally get the
Raw dataset Checking for
Null value
Label encoding Handling null value
Correlation analysis Checking noisy value
Solving noisy value Problem
Drop Outcome feature Normalization Processed dataset
processed data set in our hands. This whole process of data processing was done using the “Jupyter Notebook” and “Anaconda navigator”.
3.4 Statistical Analysis
We were able to collect data of 1012 people. We collected data on people from different occupations, different ages, and different districts.
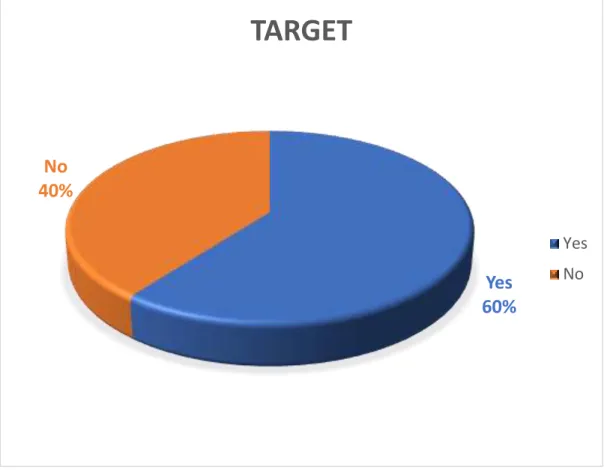
Figure 3.4.1 shows that in our data set how many people have dental disease and no dental disease. We had prepared our model based on data from 612 affected people and 400 non affected people.
Yes 60%
No 40%
TARGET
Yes No
Figure 3.4.1: Affected and Non affected cases.
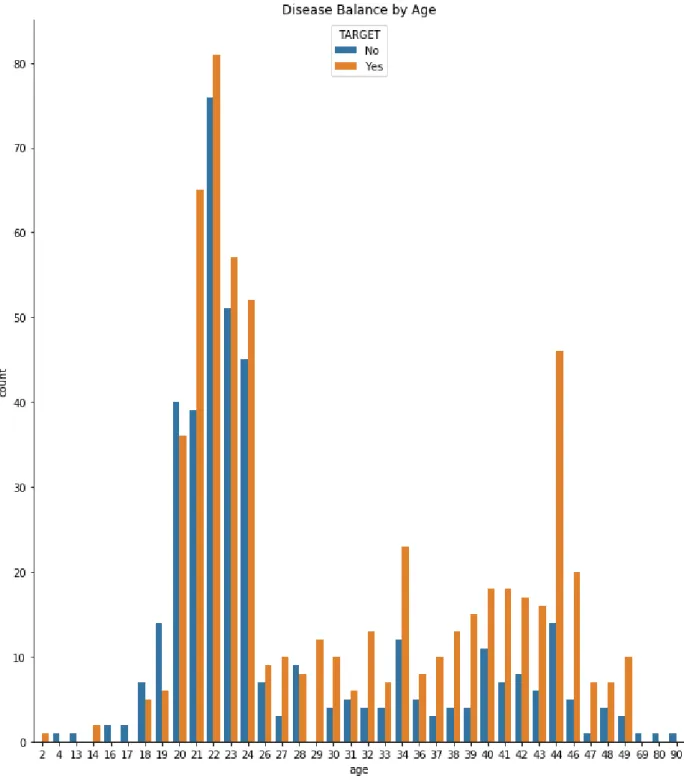
Figure 3.4.2: Dental disease and age case.
Figure 3.4.2 shows that information from people of some ages. This picture shows we have information about how many people affected by dental disease of any age. Most of the data we collected was about young and middle-aged people.
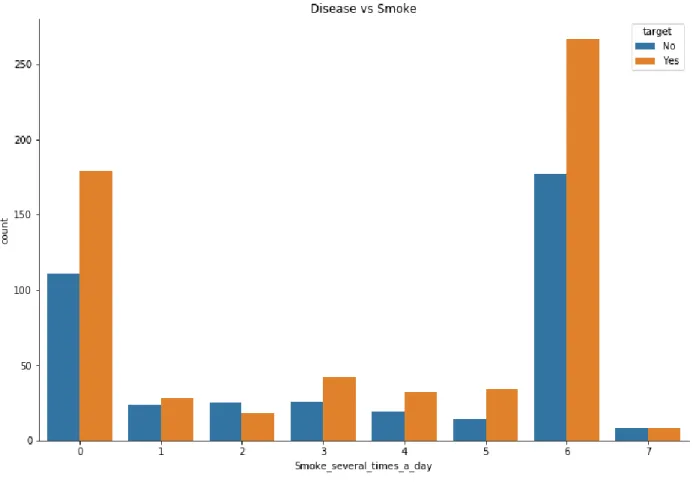
Figure 3.4.3: Dental disease and smoke per day case.
Figure 3.4.3 shows smoker per day and disease cases. This picture shows that most of the people who smokes six times a day have dental disease.
92%
1% 3% 2% 2%
0%
10%
20%
30%
40%
50%
60%
70%
80%
90%
100%
With Toothpaste With Miswak With Tooth powder With Coal Not Specific
Methods of Brush
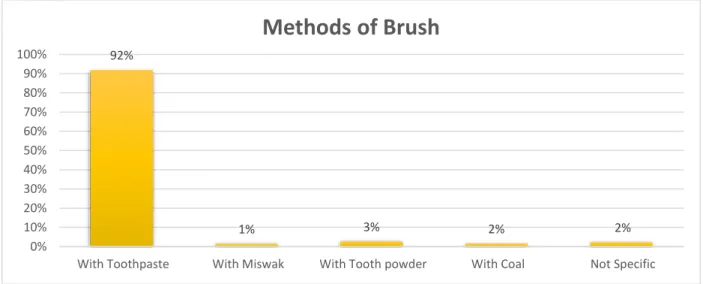
Figure 3.4.5: Different distribution of features of dental diseases.
Figure 3.4.6: Different distribution of features of dental diseases.
Figure 3.4.7: Different distribution of features of dental diseases.
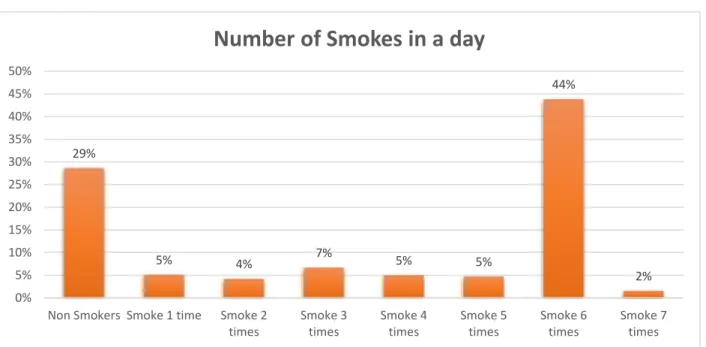
29%
5% 4% 7%
5% 5%
44%
2%
0%
5%
10%
15%
20%
25%
30%
35%
40%
45%
50%
Non Smokers Smoke 1 time Smoke 2 times
Smoke 3 times
Smoke 4 times
Smoke 5 times
Smoke 6 times
Smoke 7 times
Number of Smokes in a day
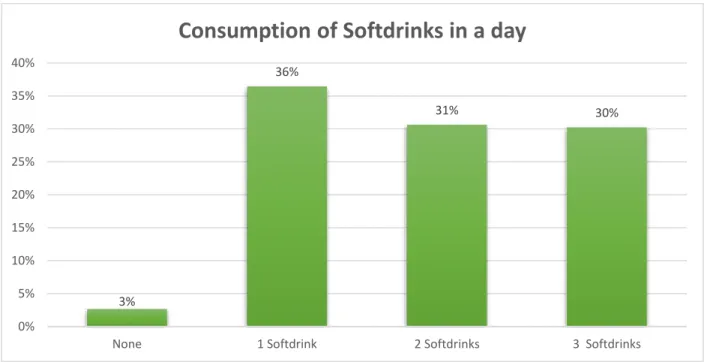
3%
36%
31% 30%
0%
5%
10%
15%
20%
25%
30%
35%
40%
None 1 Softdrink 2 Softdrinks 3 Softdrinks
Consumption of Softdrinks in a day
Figure 3.4.8: Different distribution of features of dental diseases.
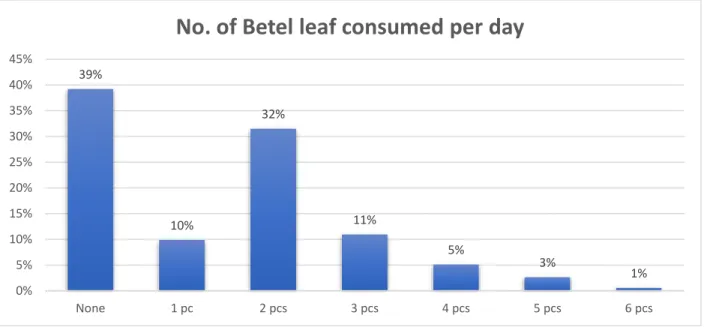
Figure 3.4.5, 6, 7, 8 shows, that some reason behind dental disease of the people we have collected our data. Here we can see the no. of people who use toothbrush for brushing is high. Also, most of the people smoke six times in a day, take soft drinks at least one time in a day and eat betel leaf two times in a day.
Now a correlation matrix describes the features connectivity to others feature. The statistics have shown that 209 people addicted because of their friends and 98 people addicted to drugs for curiosity mind.
39%
10%
32%
11%
5% 3%
1%
0%
5%
10%
15%
20%
25%
30%
35%
40%
45%
None 1 pc 2 pcs 3 pcs 4 pcs 5 pcs 6 pcs
No. of Betel leaf consumed per day
Figure 3.4.9: Correlation Matrix.
Figure 3.4.9 shows the correlation between the features. In addition, we find some noisy values in our dataset. We solve the noisy value problem and using a box plot we demonstrate the result.
Figure 3.4.10 shows which feature has noisy value. We had noisy value in the ‘age’ feature and solved it with outlier quantile.
Figure 3.4.11 shows that noisy value on age is removed. Normally noisy value remains in numerical data and there are few noisy value finds in texture data.
3.5 Implementation Requirements
We need data mining tools, data processing tools, data storing tools to implement our work.
We collect data through Google forms and using handwritten forms. We created data sets with Microsoft Excel. For data preprocessing and algorithms implementation, we used
“Anaconda-navigator” and “Jupyter notebook”.
Anaconda Navigator is one kind of graphical user interface for the desktop. It allows users to launch application and anaconda packages, environment and channel without any command-line command. Anaconda has completed and open-source data science packages [41].
CHAPTER 4
EXPERIMENTAL RESULTS AND DISCUSSION 4.1 Introduction
In the previous section, we discussed about the dataset and the dataset processing processes.
The processed data is used in some algorithms and the results of the algorithm will be discussed in this section. KNN, Logistic regression, Support Vector Machine (SVM), Gaussian Naïve Bayes, Decision tree, Random forest, Multilayer perception (MLP-ANN), ADA boosting classifier, Latent Dirichlet Allocation (LDA) and Gradient boosting classifier all of these algorithms are used and the results are analyzed to see which algorithm provides the best accuracy. There are basically three steps to calculate accuracy.
The accuracies first diagnosed before using PCA on the processed data, then calculate the accuracies after using PCA and finally the accuracies are calculated using the algorithm on the unprocessed data. We collect 1012 data of both addicted and non-addicted persons among them 85 percent is used as training data and 15 percent is used as test data. The name of our dataset is ‘Dental-Dataset-N3’.
4.2 Experimental Results & Analysis
We used ten machine-learning algorithms and compared them with each algorithm by calculating their accuracy, confusion matrix, precision, recall, f1-score, sensitivity, and specificity.
4.2.1 Experimental Evaluation
We run nine machine-learning algorithms on processed datasets where the number of the feature was 25. Then we use the PCA. PCA means principal component analysis. It is one kind of feature extraction method, which uses to grab the underlying variance of data in orthogonal linear projections. In the case of dimensionality reduction, PCA is used. The independent used variable of a model is known as the dimensionality of that model. The number of variables can be reduced using a PCA, only the important
variables are selected for the next task. Normally it combines highly correlated variables together to build up a short artificial set of variables.
Figure 4.2.1: Accuracy before applying PCA.
Figure 4.2.1 shows the accuracy of nine algorithms. It appears that before using PCA, KNN has achieved 74.82% accuracy, SVM has achieved 86.39% accuracy, logistic regression has achieved 74.82% accuracy, Gaussian Naïve Bayes has achieved 61.9%
accuracy, Random forest has achieved 61.9% accuracy, Decision tree has achieved 38.09% accuracy, ADA boosting classifier has achieved 34.69% accuracy, MLP-ANN has achieved 38.09% accuracy, Latent Dirichlet Allocation (LDA) has achieved 61.22% accuracy and Gradient boosting classifier 60.54% accuracy.
We calculate the accuracy again using PCA and in PCA, we used 19 features instead of 25 features. Since the number of features has changed due to the use of PCA, the change in accuracy is noticed.
75.51% 74.82%
85.71%
61.90%
34.69% 38.09% 38.09%
61.22% 61.90% 60.54%
0 0.1 0.2 0.3 0.4 0.5 0.6 0.7 0.8 0.9
Accuracy
Figure 4.2.2: Accuracy after applying PCA.
Figure 4.2.2 shows that the accuracy of nine algorithms after performing PCA. After using PCA, we can see that the accuracy of some algorithms has increased and some algorithms have decreased and some algorithms have remained unchanged. , KNN has achieved 67.69% accuracy, SVM has achieved 92.82% accuracy, Logistic regression has achieved 995.89% accuracy, Gaussian Naïve Bayes has achieved 42.5% accuracy, Random forest has achieved 50.76% accuracy, Decision tree has achieved 43. 06%
accuracy, ADA boosting classifier has achieved 47.69% accuracy, MLP-ANN has achieved 53.84% accuracy, Latent Dirichlet Allocation (LDA) has achieved 49.74%
accuracy and Gradient boosting classifier 63. 07% accuracy
67.69%
95.89%
92.82%
50.76% 47.69% 43.06% 53.84% 49.74% 42.50%
63.07%
0 0.2 0.4 0.6 0.8 1
1.2
After using PCA
Figure 4.2.3: Accuracy with unprocessed data.
Figure 4.2.3 shows the accuracy of nine algorithms with unprocessed data. KNN has achieved 70.35 % accuracy, SVM has achieved 65.82 % accuracy, logistic regression has achieved 39.69 % accuracy, Gaussian Naïve Bayes has achieved 40.20 % accuracy, Random forest has achieved 60.30 % accuracy, Decision tree has achieved 39.69 % accuracy, ADA boosting classifier has achieved 40.70% accuracy, MLP-ANN has achieved 37.18 % accuracy, Latent Dirichlet Allocation (LDA) has achieved 61.30%
accuracy and Gradient boosting classifier 52.76% accuracy
K-nearest neighbors (KNN) is a simple supervised machine-learning algorithm.
Classification and regression problems can be solved with the KNN algorithm. KNN algorithm memorizes the training observation for classifying the unseen test data. KNN algorithm grabs similar things that exist in a close neighborhood [42].
Support vector machine is a supervised machine-learning algorithm. This also used for both classification and regression problems. Data items are placed in n-dimensional space and the values of the features are presented the particular coordinate. It creates the most homogeneous points in each subsection that is why it is called hyper plane [42].
70.35%
39.69%
65.82% 60.30%
40.70% 39.69% 37.18%
61.30%
40.20%
52.76%
0 0.1 0.2 0.3 0.4 0.5 0.6 0.7 0.8
KNN Logistic Regression
SVM Random Forest
ADA Boosting
Decision Tree
MLP-ANN LDA GNB Gradient
Boosting Classifier
Accuracy with Unpreprocessed Data
Logistic regression used logistic function and this Logistic function is called a sigmoid function. An S-shaped curve takes the real values and put them between 0 to 1 [42].
Gaussian Naïve Bayes is one of the oldest algorithms of machine learning. This algorithm is based on Bayes theorem and basic statistics. Class Probabilities and conditional Probabilities are used in the Naive bias model. It extends attributes using Gaussian distribution [43].
Decision tree is a tree-based model. It distributing the features into the smaller section with similar response value using splitting rules. The divide-and-conquer method uses for making the tree diagram. Decision tree needs a small pre-processing and it can easily control the categorical features without preprocessing [43].
Yoav Freund and Robert Schapiro propose ADA boosting or Adaptive boosting in 1996. It makes a classifier with a combination of multiple poorly performing classifier.
It set the weight of classifiers and train the data in each iteration [43].
Random forest makes a large collection of de-correlated trees for prediction purposes.
It reduces tree correlation by injecting randomness into the tree growing process. It performs split-variable randomization. Random forest has a smaller feature search space at each tree split [43].
Gradient boosting classifier build an ensemble of shallow trees with tree learning and improving technique. Gradient boosting classifier works with the principle of boosting weak learners iteratively by shifting focus towards problematic observation. It prepares a stage-wise fashion model like others boosting methods and normalize them with arbitrary differentiable functions [43].
MLP means multilayer perception. MLP-ANN has a combination of multilayer neurons. The first layer is the input layer, the second layer is called the hidden layer and the third layer is called the output layer. It takes input data through the input layer and gives the output from the output layer [43].
TABLE 4.1: SUMMARY OF ACCURACY
Algorithms Accuracy before applying PCA (%)
Accuracy after applying PCA (%)
Accuracy with unprocessed data (%)
KNN 75.51 67.69 70.35
SVM 85.71 92.82 65.32
Logistic regression
74.82 95.89 39.69
Gaussian Naïve Bayes
61.90 42.50 40.20
Random forest 61.90 50.76 60.30
Decision tree 38.09 43.06 39.69
ADA boosting classifier
34.69 47.69 40.70
MLP-ANN 38.09 53.84 37.18
Latent Dirichlet Allocation (LDA)
61.22 49.74 61.30
Gradient Boosting Classifier
60.54 63.07 52.76
Table 4.1 shows that logistic regression has achieved the highest accuracy among all of them with 95.35% accuracy. SVM has achieved the highest accuracy before applying PCA. Again, logistic regression has achieved the highest accuracy after applying PCA with 94.35%. KNN has achieved the highest accuracy with 70.85% on unprocessed data.
4.2.2 Descriptive Analysis
We not only calculated the accuracy of several algorithms but also calculated sensitivity, specificity, precision, recall, f-score, and roc-curve and confusion matrix of