UNITED INTERNATIONAL UNIVERSITY
Internship Report on: “Inventory Analysis at Grameen Footwear Ltd.”
Course code: INT 4339
Submitted by Prince Mahmud Naafi
ID- 111182068
1
Contents
Letter of transmittal 2
Declaration By student 3
Supervisor certificate 4
Acknowledgement 5
Executive Summary 6
Chapter 1: Company Profile 7
Chapter 3: Theoretical Aspects 10
Chapter 4: Result and Discussion 12
Chapter 5: Internship Experience and Conclusion 40
Bibliography 41
Appendix 1: Experience Certificate 43
2
Letter of transmittal
12 April, 2023 Dr. Saad Hasan Associate Professor
United International University
Subject: Submission of Internship Report on “Inventory Analysis at Grameen Footwear Ltd”.
Assalamu Alaikum Sir,
It is my privilege to let you know that, as a partial fulfilment of the requirements for Bachelor of Administration (BBA) degree, I have completed my internship program in Grameen Footwear Ltd.’s main branch. Based on the practical scenario of the business I had to furnish my report. The report carries information of how the footwear industry operates their business. It has been a unique experience for me to carry out such research and gather practical experience of working in a company. And also this has created an opportunity for me to enhance my knowledge and skills that will help me in my future career. I tried my best as possible to make the report more informative. Despite my best effort there might be some flaws remaining in the report, and I hope that you'll justify my mistakes and be pleased to accept my report.
Thank You!!
Sincerely yours
Prince Mahmud Naafi ID: 111 182 068
United International University
3
Declaration By student
I, Prince Mahmud Naafi, declare that the entire internship report titled “Inventory Analysis at Grameen Footwear Ltd” is prepared by me. I am also assured of not having any plagiarism in this report, as well as the report was written only for meeting the academic standards not for any other purpose.
Prince Mahmud Naafi ID- 111 182 068
4
Supervisor certificate
This is to certify that Prince Mahmud Naafi, Student of United International University (UIU), Bachelor of Business Administration (BBA), ID- 111 182 068 has completed an internship report tiled “Inventory Analysis at Grameen Footwear Ltd” according to the Universities requirement.
The report will only be acceptable in terms of quality and form as directed by the university authority.
Dr. Saad Hasan Associate Professor
School of Business and Economics United International University
5
Acknowledgement
Firstly I would like to thank Almighty Allah for giving me the strength and ability to learn and understand. Then I would like to thank my Honorable faculty and supervisor Dr. Saad Hassan, for giving me the proper instruction and guidance in order to finish the report. I would also like to Thank Mr. Awlad Hossain, chairman of Grameen footwear for giving me a wonderful opportunity to work in his company. As well as Mr. Mokhlesur Rahman (Accounts officer) and Mr. Abdur Rahim(Manager Slipper) & Mr. Lokman Hossian (Manager Footwear) for training me up. Without all of their guidance and support, it might have been difficult for me to complete the entire report.
6
Executive Summary
This report contains information about the local and international footwear industry and overall activities of the organization where I completed my internship. The report discusses the primary tasks that I was assigned by my supervisor and over all process of Grameen Footwear. The information that is provided in this report is collected based on the primary research. The report focuses on results of inventory analysis I have conducted. In particular, I have utilized an inventory management and analysis tool called ABC analysis. The results of the study will be helpful for analyzing inventory of the in firm real time and will optimize the level of inventory.
7
Chapter 1: Company Profile
Introduction
Grameen Footwear brands, distributes and retails footwear. If we talk about the most renowned brand of the local market in Bangladesh, Grameen footwear comes among the top ten listed brands to match the taste and preference of maximum Bangladeshi customers. The company started its journey as a sole proprietorship, twenty years ago by Mr. Hazi Mohammad Awlad Hossian.
Company Vision and Mission
Consistent Product Quality: The main focus of the company is to establish a repeated customer base and increase their brand values by ensuring the quality standards expected by Consumers.
Product and services
Grameen Footwear carries a huge collection of shoes, sandal, keds, slipper, Sneakers etc. for all types of customers male, female and kids. The company ensures that the product meets all sets of standards according to Bangladeshi customers taste and preference. Grameen mainly gives subcontracts to vendors for manufacturing products. It also has the supply chain team to source compliant suppliers across Bangladesh, who are responsible to ensure the best quality of raw materials for the product. The company also sources raw material from China to maintain high quality standards in order to satisfy the customer by offering premium quality products.
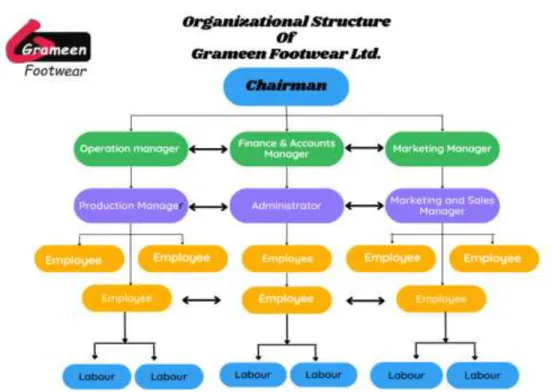
8 Organizational Structure
Figure 1. Organizational Structure
9 Key People
Figure 2. Key peoples in the organizations Hazi MD Awlad (Managing Director)
MD Shahin (Chief executive Officer)
MD Abdur Rahim (Marketing and sales Head) Md Lokman Hossain (sales & marketing Manager) Md Mokles (Finance & accounts)
Md Nayem (production and operation Manager) Prince Mahmud Naafi (Admin and accounts officer)
10
Chapter 3: Theoretical Aspects
This chapter provides a literature review of local and international footwear industry and issues related to inventory management and analysis tools such as ABC analysis.
International and Bangladesh Footwear Industry
The footwear sector is a diverse industry that covers a wide range of materials and products for different types of men, women, and children. Globally this market is highly Competitive and Fragmented with few major players as well as infinite numbers of small players, including designers, manufacturers, marketers and retailers. The Global market demand of the Footwear industry is around $224B USD and $22.3B sold annually.
Unlike readymade garments (RMG), Bangladesh footwear industry did not get enough recognition in the international market. There were 220 tanneries in Bangladesh, who were active in processing and manufacturing of leather and were facing fierce competition in the international market.
According to the report of the Export Promotion Bureau of Bangladesh, Bangladesh Non leather footwear industry has increased by 30% in export which is worth 449 million from fiscal year 2020-2022.
Since in covid-19 pandemic, many international buyers were shifting their dependency from China to avoid risk with a single supplier, and from that giant footwear companies started to switch their focus to manufacturing units in Bangladesh as well as other native Asian countries. Nowadays, Bangladesh uses advanced manufacturing facilities to adhere to environmental regulation. The top non leather footwear buyers of Bangladesh are from Spain, France, Netherlands, South Korea, India, Germany and Netherland.
Inventory Management
In footwear industry what moves in the supply chain is inventory. In addition, this report is based on inventory management. Therefore, it is important to have a discussion on inventory. Inventory
11
management ensures that the right type of goods reach the right place in the right quantity, time and price. Thus it maintains the product availability at warehouses, retailers & distributors.
Insufficient inventory management may halt production process which leads to failure to deliver the product on time, would result in loss of customer and negative impact in the market. Also excessive inventory maintenance increases the holding cost, which might have a negative effect on company’s profitability.
ABC Analysis
So far different methods and models have been proposed to classify inventory but among all of them, ABC analysis is the best approach to classify the inventory. It enables organizations to classify inventories into meaningful categories. Basically this approach is based on Pareto principle 80/20 rule, assumes that 20% of the inventory will accounts 80% of significant measurement. There are also some benefits of ABC classification systems:
Cycle counting Frequency: Here A class items will be counted frequently then B & C class Items.
Replenishment system: This will vary according to the importance of the inventory system.
Example: if C Class items are lower it will be treated in two bin system, which will help to minimize the inventory carrying cost.
12
Chapter 4: Result and Discussion
Following is a summary of various strategies and tactics employed by Grameen Footwear.
Competitive Production Rates
Grameen Footwear tries to maintain Output rates Comparable with Competitors. Since the Product is purchased under subcontract, but maximum time the company always tries to involve in manufacturing decisions with the vendors and also source the material to ensure the best quality.
Currently the Company is trying to establish their own factory that will help the organization to minimize more their Production Cost
Low cost
The Company tries to source the product as cheap as possible in order to minimize the cost. For that they purchase raw materials in bulk to get advantage of order quantity cycle. Currently the Company is trying to establish their own factory that will help the organization to minimize more their Production Cost.
Distribution network
The company has a large distribution channel in Bangladesh and still it is trying to increase the number of customers and vendors.
Customer satisfaction
The ultimate goal of Grameen is to satisfy their customers and increase their brand value.
Industry the company operates
Though the company does primary and secondary work in the industry, their prime attention is on the tertiary sector to serve the product to customers.
Production
At first the supply chain team sources and procure the raw materials. Secondly they deliver the raw material to third party manufacturers for sample products. When the sample is ready the quality is inspected by the quality assurance team, then the product goes for manufacture. Grameen
13
always orders a minimum 2-4 dozen footwear for one design sample. Not likely all the time the company goes for the manufacturing process, the manufacturer also has the opportunity to show their personal design, if the product meets the standard the company gives direct order directly.
Marketing: Grameen follows multiple marketing strategies. The marketing officers are spread all over the districts. They go from door to door to retail shopkeepers to sell their product. The officers offer the retail shop to purchase their product for cash or credit. In terms of credit the marketing officers provide some conditions. The payment system depends on retailers’ sales capability and other factors to pay back the money.
Target Market: Basically the company's main Attraction of customers are out of the city.
Grameen targets all types of customers from children to adult and based on their taste and preference the shoes are produced.
Sales: Grameen sells their product at a fixed price to the customer. Since they directly sell their product to wholesale customers, they offer a 30% discount for both cash and credit sales. For the loyal customer the company offers a 35% discount. Overall the retailer makes a profit of 30-35%
of product price.
ABC Classification
I have used ABC analysis tool to assess the available inventory of Grameen Footwear. As discussed in the previous section ABC Analysis classifies inventory as per three different categories namely, A, B and C based on Annual Taka usage percentage. Table 1-3 and Figure 3-6 provides details and summaries of the ABC analysis conducted.
A Class Items: This has the smallest category generally, 10-15% of total items and the most crucial items among all because 60-70% money is invested on this Inventory.
B Class Items: 20-30% of money is usually invested on B class items. This will be slightly larger in terms of volumes of SKU’s which is around 20-25% of total Inventory.
C class Items: Typically this is always the largest category of inventory around 60-70% and less money is invested in these items.
14
Table 1. ABC Analysis of Inventory at Grameen Footwear
SL SKU
Annual Number of item Sold
Cost/
Unit(TK) Annual Units
Percentage Annual Unit Sold
ABC
Classification
Cumulative Annual Usage
1 101-245 18 1075 19,350 0.94 A 0.94
2 2-60 24 1350 32,400 1.57 A 2.51
3 26-24 24 1250 30,000 1.46 A 3.97
4 26-26 24 1250 30,000 1.46 A 5.42
5 26-30 24 1250 30,000 1.46 A 6.88
6 27-14 24 995 23,880 1.16 A 8.04
7 27-4 24 995 23,880 1.16 A 9.20
8 306-10 12 1450 17,400 0.84 A 10.04
9 306-12 24 1450 34,800 1.69 A 11.73
10 306-7 24 1450 34,800 1.69 A 13.42
11 306-9 12 1450 17,400 0.84 A 14.26
12 30-7 30 1250 37,500 1.82 A 16.08
13 308-6 30 1450 43,500 2.11 A 18.20
14 33-4 24 850 20,400 0.99 A 19.19
15 35-10 24 1050 25,200 1.22 A 20.41
16 6-29 30 795 23,850 1.16 A 21.57
17 6-31 24 795 19,080 0.93 A 22.49
18 6-36 30 795 23,850 1.16 A 23.65
19 6-38 30 795 23,850 1.16 A 24.81
20 6-41 24 1095 26,280 1.28 A 26.08
21 6-7 24 1095 26,280 1.28 A 27.36
22 9-25 24 1150 27,600 1.34 A 28.70
23 101-256 12 975 11,700 0.57 B 29.26
24 101-258 12 975 11,700 0.57 B 29.83
25 113-18 12 950 11,400 0.55 B 30.39
26 119-91 12 950 11,400 0.55 B 30.94
15 SL SKU
Annual Number of item Sold
Cost/
Unit(TK) Annual Units
Percentage Annual Unit Sold
ABC
Classification
Cumulative Annual Usage
27 119-97 12 950 11,400 0.55 B 31.49
28 128-5 12 1055 12,660 0.61 B 32.11
29 26-54 12 1250 15,000 0.73 B 32.83
30 30-0 12 1250 15,000 0.73 B 33.56
31 306-15 6 2190 13,140 0.64 B 34.20
32 306-16 6 2190 13,140 0.64 B 34.84
33 309-1 6 1950 11,700 0.57 B 35.41
34 309-5 6 1950 11,700 0.57 B 35.97
35 6-63 24 625 15,000 0.73 B 36.70
36 6-84 24 625 15,000 0.73 B 37.43
37 1-0 6 1050 6,300 0.31 C 37.73
38 101-0 6 695 4,170 0.20 C 37.94
39 101-153 12 755 9,060 0.44 C 38.38
40 101-154 6 755 4,530 0.22 C 38.60
41 101-155 6 755 4,530 0.22 C 38.82
42 101-172 6 650 3,900 0.19 C 39.01
43 101-173 6 650 3,900 0.19 C 39.19
44 101-181 6 395 2,370 0.12 C 39.31
45 101-196 18 395 7,110 0.35 C 39.65
46 101-197 12 395 4,740 0.23 C 39.88
47 101-202 6 395 2,370 0.12 C 40.00
48 101-208 6 695 4,170 0.20 C 40.20
49 101-209 12 395 4,740 0.23 C 40.43
50 101-211 6 395 2,370 0.12 C 40.55
51 101-215 6 750 4,500 0.22 C 40.77
52 101-217 6 750 4,500 0.22 C 40.98
53 101-218 6 750 4,500 0.22 C 41.20
16 SL SKU
Annual Number of item Sold
Cost/
Unit(TK) Annual Units
Percentage Annual Unit Sold
ABC
Classification
Cumulative Annual Usage
54 101-219 6 1095 6,570 0.32 C 41.52
55 101-220 6 1095 6,570 0.32 C 41.84
56 101-234 6 490 2,940 0.14 C 41.98
57 101-235 6 490 2,940 0.14 C 42.13
58 101-236 6 490 2,940 0.14 C 42.27
59 101-237 6 490 2,940 0.14 C 42.41
60 101-242 6 875 5,250 0.25 C 42.67
61 101-243 6 875 5,250 0.25 C 42.92
62 101-244 6 1075 6,450 0.31 C 43.23
63 101-248 6 875 5,250 0.25 C 43.49
64 101-250 6 1075 6,450 0.31 C 43.80
65 101-252 6 1075 6,450 0.31 C 44.11
66 101-253 6 1075 6,450 0.31 C 44.43
67 101-254 12 395 4,740 0.23 C 44.66
68 101-255 6 395 2,370 0.12 C 44.77
69 101-257 6 975 5,850 0.28 C 45.06
70 101-259 6 975 5,850 0.28 C 45.34
71 101-32 6 550 3,300 0.16 C 45.50
72 101-33 6 550 3,300 0.16 C 45.66
73 101-52 6 695 4,170 0.20 C 45.86
74 102-0 12 550 6,600 0.32 C 46.18
75 102-100 6 550 3,300 0.16 C 46.34
76 102-101 6 550 3,300 0.16 C 46.50
77 102-109 6 550 3,300 0.16 C 46.66
78 102-110 6 550 3,300 0.16 C 46.82
79 102-111 12 550 6,600 0.32 C 47.14
80 102-112 6 695 4,170 0.20 C 47.35
17 SL SKU
Annual Number of item Sold
Cost/
Unit(TK) Annual Units
Percentage Annual Unit Sold
ABC
Classification
Cumulative Annual Usage
81 102-113 6 695 4,170 0.20 C 47.55
82 102-114 6 695 4,170 0.20 C 47.75
83 102-116 6 675 4,050 0.20 C 47.95
84 102-117 6 675 4,050 0.20 C 48.14
85 102-45 6 550 3,300 0.16 C 48.30
86 102-59 6 595 3,570 0.17 C 48.48
87 102-60 6 595 3,570 0.17 C 48.65
88 102-61 6 595 3,570 0.17 C 48.82
89 102-64 6 675 4,050 0.20 C 49.02
90 102-67 6 675 4,050 0.20 C 49.22
91 102-69 6 675 4,050 0.20 C 49.41
92 102-73 6 675 4,050 0.20 C 49.61
93 102-74 6 675 4,050 0.20 C 49.81
94 102-77 6 675 4,050 0.20 C 50.00
95 102-82 6 725 4,350 0.21 C 50.21
96 102-86 6 725 4,350 0.21 C 50.43
97 102-87 6 725 4,350 0.21 C 50.64
98 102-97 12 550 6,600 0.32 C 50.96
99 112-15 6 775 4,650 0.23 C 51.18
100 112-16 6 695 4,170 0.20 C 51.38
101 112-26 6 775 4,650 0.23 C 51.61
102 112-32 6 695 4,170 0.20 C 51.81
103 112-33 6 695 4,170 0.20 C 52.02
104 112-35 6 695 4,170 0.20 C 52.22
105 112-40 6 695 4,170 0.20 C 52.42
106 112-43 6 775 4,650 0.23 C 52.65
107 112-46 6 695 4,170 0.20 C 52.85
18 SL SKU
Annual Number of item Sold
Cost/
Unit(TK) Annual Units
Percentage Annual Unit Sold
ABC
Classification
Cumulative Annual Usage
108 112-47 6 695 4,170 0.20 C 53.05
109 112-50 6 695 4,170 0.20 C 53.25
110 112-51 6 695 4,170 0.20 C 53.46
111 113-0 6 950 5,700 0.28 C 53.73
112 113-11 6 1250 7,500 0.36 C 54.10
113 113-6 6 1250 7,500 0.36 C 54.46
114 113-7 6 1225 7,350 0.36 C 54.82
115 113-9 6 1250 7,500 0.36 C 55.18
116 115-13 6 995 5,970 0.29 C 55.47
117 115-15 6 995 5,970 0.29 C 55.76
118 116-19 6 825 4,950 0.24 C 56.00
119 116-20 6 825 4,950 0.24 C 56.24
120 116-21 12 795 9,540 0.46 C 56.70
121 119-101 6 950 5,700 0.28 C 56.98
122 119-102 6 950 5,700 0.28 C 57.26
123 119-103 12 855 10,260 0.50 C 57.75
124 119-104 12 855 10,260 0.50 C 58.25
125 119-43 6 855 5,130 0.25 C 58.50
126 119-51 6 1250 7,500 0.36 C 58.87
127 119-53 6 1250 7,500 0.36 C 59.23
128 119-63 6 855 5,130 0.25 C 59.48
129 119-65 6 855 5,130 0.25 C 59.73
130 119-70 6 855 5,130 0.25 C 59.98
131 119-77 6 855 5,130 0.25 C 60.22
132 119-78 6 855 5,130 0.25 C 60.47
133 119-79 6 950 5,700 0.28 C 60.75
134 119-87 6 950 5,700 0.28 C 61.03
19 SL SKU
Annual Number of item Sold
Cost/
Unit(TK) Annual Units
Percentage Annual Unit Sold
ABC
Classification
Cumulative Annual Usage
135 119-89 6 950 5,700 0.28 C 61.30
136 119-92 6 950 5,700 0.28 C 61.58
137 119-96 6 950 5,700 0.28 C 61.86
138 119-96 6 950 5,700 0.28 C 62.13
139 127-7 6 1225 7,350 0.36 C 62.49
140 127-9 6 1225 7,350 0.36 C 62.85
141 128-20 6 1055 6,330 0.31 C 63.15
142 128-6 6 1055 6,330 0.31 C 63.46
143 128-9 6 955 5,730 0.28 C 63.74
144 1-31 6 1050 6,300 0.31 C 64.05
145 131-1 12 795 9,540 0.46 C 64.51
146 131-1 1/4/ 6 850 5,100 0.25 C 64.76
147 131-2 6 850 5,100 0.25 C 65.00
148 131-4 6 795 4,770 0.23 C 65.23
149 1-36 6 1050 6,300 0.31 C 65.54
150 1-37 6 1050 6,300 0.31 C 65.85
151 2-100 6 775 4,650 0.23 C 66.07
152 2-102 6 1350 8,100 0.39 C 66.46
153 2-103 6 1350 8,100 0.39 C 66.86
154 21-108 6 1490 8,940 0.43 C 67.29
155 21-24 6 1190 7,140 0.35 C 67.64
156 2-13 6 675 4,050 0.20 C 67.83
157 21-80 6 1450 8,700 0.42 C 68.26
158 21-81 6 1450 8,700 0.42 C 68.68
159 21-93 6 1450 8,700 0.42 C 69.10
160 21-94 6 1450 8,700 0.42 C 69.52
161 21-95 6 1450 8,700 0.42 C 69.95
20 SL SKU
Annual Number of item Sold
Cost/
Unit(TK) Annual Units
Percentage Annual Unit Sold
ABC
Classification
Cumulative Annual Usage
162 21-98 6 1450 8,700 0.42 C 70.37
163 21-99 6 1450 8,700 0.42 C 70.79
164 2-41 6 775 4,650 0.23 C 71.02
165 2-42 6 775 4,650 0.23 C 71.24
166 25-10 6 1095 6,570 0.32 C 71.56
167 25-16 6 1250 7,500 0.36 C 71.92
168 25-25 6 1250 7,500 0.36 C 72.29
169 25-26 6 1250 7,500 0.36 C 72.65
170 25-43 6 1095 6,570 0.32 C 72.97
171 25-45 6 1095 6,570 0.32 C 73.29
172 26-0 6 1150 6,900 0.33 C 73.62
173 26-11 6 1150 6,900 0.33 C 73.96
174 26-18 6 1150 6,900 0.33 C 74.29
175 26-41 6 1250 7,500 0.36 C 74.66
176 26-42 6 1250 7,500 0.36 C 75.02
177 26-43 6 1250 7,500 0.36 C 75.39
178 26-44 6 1250 7,500 0.36 C 75.75
179 26-47 6 1250 7,500 0.36 C 76.11
180 26-48 6 1250 7,500 0.36 C 76.48
181 26-53 6 1250 7,500 0.36 C 76.84
182 26-68 6 1250 7,500 0.36 C 77.21
183 27-18 6 995 5,970 0.29 C 77.50
184 2-77 6 1350 8,100 0.39 C 77.89
185 2-86 6 1350 8,100 0.39 C 78.28
186 2-87 6 1350 8,100 0.39 C 78.68
187 2-88 6 1350 8,100 0.39 C 79.07
188 2-89 6 1350 8,100 0.39 C 79.46
21 SL SKU
Annual Number of item Sold
Cost/
Unit(TK) Annual Units
Percentage Annual Unit Sold
ABC
Classification
Cumulative Annual Usage
189 29-11 6 575 3,450 0.17 C 79.63
190 29-12 6 575 3,450 0.17 C 79.80
191 29-15 6 575 3,450 0.17 C 79.96
192 29-23 6 575 3,450 0.17 C 80.13
193 29-27 6 575 3,450 0.17 C 80.30
194 29-28 6 575 3,450 0.17 C 80.47
195 2-93 6 1450 8,700 0.42 C 80.89
196 29-33 6 575 3,450 0.17 C 81.06
197 29-35 6 525 3,150 0.15 C 81.21
198 29-37 6 525 3,150 0.15 C 81.36
199 29-40 6 575 3,450 0.17 C 81.53
200 29-45 6 525 3,150 0.15 C 81.68
201 29-47 6 575 3,450 0.17 C 81.85
202 29-49 6 575 3,450 0.17 C 82.02
203 29-5 6 575 3,450 0.17 C 82.18
204 29-50 6 575 3,450 0.17 C 82.35
205 29-52 6 595 3,570 0.17 C 82.52
206 29-55 12 575 6,900 0.33 C 82.86
207 29-56 6 575 3,450 0.17 C 83.03
208 29-57 6 575 3,450 0.17 C 83.19
209 29-58 6 575 3,450 0.17 C 83.36
210 29-59 6 595 3,570 0.17 C 83.53
211 2-96 6 775 4,650 0.23 C 83.76
212 29-60 12 595 7,140 0.35 C 84.11
213 29-61 12 595 7,140 0.35 C 84.45
214 29-62 6 595 3,570 0.17 C 84.63
215 2-97 6 775 4,650 0.23 C 84.85
22 SL SKU
Annual Number of item Sold
Cost/
Unit(TK) Annual Units
Percentage Annual Unit Sold
ABC
Classification
Cumulative Annual Usage
216 2-99 6 1450 8,700 0.42 C 85.27
217 304-154 6 850 5,100 0.25 C 85.52
218 304-166 6 995 5,970 0.29 C 85.81
219 304-170 6 995 5,970 0.29 C 86.10
220 304-171 6 995 5,970 0.29 C 86.39
221 306-11 6 1450 8,700 0.42 C 86.81
222 308-8 6 1450 8,700 0.42 C 87.24
223 31-11 6 1150 6,900 0.33 C 87.57
224 31-12 6 1150 6,900 0.33 C 87.91
225 33-17 6 750 4,500 0.22 C 88.12
226 33-18 6 750 4,500 0.22 C 88.34
227 33-7 6 750 4,500 0.22 C 88.56
228 34-1 6 850 5,100 0.25 C 88.81
229 34-2 6 850 5,100 0.25 C 89.06
230 35-2 6 1050 6,300 0.31 C 89.36
231 35-6 6 1050 6,300 0.31 C 89.67
232 35-7 6 1050 6,300 0.31 C 89.97
233 4-102 6 525 3,150 0.15 C 90.13
234 4-105 6 525 3,150 0.15 C 90.28
235 4-106 6 525 3,150 0.15 C 90.43
236 4-108 6 575 3,450 0.17 C 90.60
237 4-110 6 575 3,450 0.17 C 90.77
238 4-117 6 575 3,450 0.17 C 90.93
239 4-132 6 575 3,450 0.17 C 91.10
240 4-136 6 755 4,530 0.22 C 91.32
241 4-138 6 755 4,530 0.22 C 91.54
242 4-147 6 690 4,140 0.20 C 91.74
23 SL SKU
Annual Number of item Sold
Cost/
Unit(TK) Annual Units
Percentage Annual Unit Sold
ABC
Classification
Cumulative Annual Usage
243 4-148 6 690 4,140 0.20 C 91.94
244 4-161 6 585 3,510 0.17 C 92.11
245 4-162 6 585 3,510 0.17 C 92.28
246 4-164 6 585 3,510 0.17 C 92.45
247 4-173 6 585 3,510 0.17 C 92.62
248 4-27 6 585 3,510 0.17 C 92.79
249 4-34 6 685 4,110 0.20 C 92.99
250 4-36 6 685 4,110 0.20 C 93.19
251 4-72 6 525 3,150 0.15 C 93.35
252 4-86 6 575 3,450 0.17 C 93.51
253 4-88 6 575 3,450 0.17 C 93.68
254 4-90 6 575 3,450 0.17 C 93.85
255 4-92 6 575 3,450 0.17 C 94.02
256 4-95 6 575 3,450 0.17 C 94.18
257 6-10 6 950 5,700 0.28 C 94.46
258 6-100 6 1225 7,350 0.36 C 94.82
259 6-33 6 795 4,770 0.23 C 95.05
260 6-37 6 795 4,770 0.23 C 95.28
261 6-55 6 1225 7,350 0.36 C 95.64
262 6-57 6 1225 7,350 0.36 C 95.99
263 6-64 6 625 3,750 0.18 C 96.17
264 6-65 6 1225 7,350 0.36 C 96.53
265 6-74 6 1250 7,500 0.36 C 96.90
266 6-76 6 1250 7,500 0.36 C 97.26
267 6-78 6 1250 7,500 0.36 C 97.62
268 6-85 6 950 5,700 0.28 C 97.90
269 6-88 6 995 5,970 0.29 C 98.19
24 SL SKU
Annual Number of item Sold
Cost/
Unit(TK) Annual Units
Percentage Annual Unit Sold
ABC
Classification
Cumulative Annual Usage
270 8-24 6 550 3,300 0.16 C 98.35
271 8-27 6 650 3,900 0.19 C 98.54
272 8-28 6 650 3,900 0.19 C 98.73
273 9-31 6 695 4,170 0.20 C 98.93
274 9-35 6 695 4,170 0.20 C 99.13
275 9-36 6 695 4,170 0.20 C 99.34
276 9-40 6 695 4,170 0.20 C 99.54
277 128-0 12 795 9,540 0.46 C 100.00
2244 2,060,610 100.00 200.00
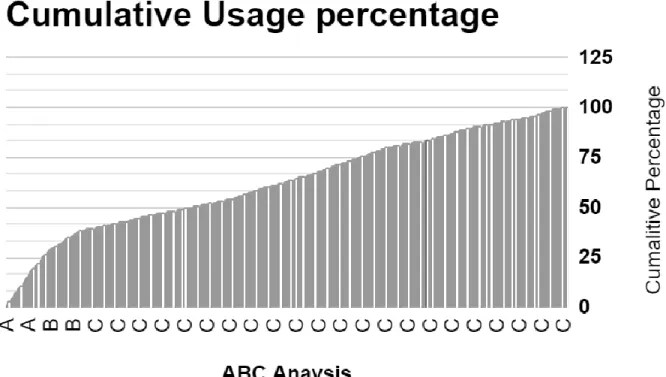
Figure: 3. histogram chart ABC analysis
Based on the Month of February, I had prepared an ABC analysis Report (Table1). In Which I have sorted out all the Inventories of Shoes and divided into three categories A, B and C. In this Chart you can see the SKUS/Article numbers of product,
25
The SKU’s which have higher number of Sales Volume and much profitable are Classified as “A”
Class Items. Mid-range sales, we categories it as “B” and the least Number of sales Items are “C”
class Items. Basically “C” items have less demand in the market. So the company tries to stock a very small Number of stocks.
The graph (Figure 3) represents the entire report of the ABC Stocks of Grameen Footwear. Based on the Annual Percentage Units sold,
● The items which is more than or equals to 80% are categorized as “A”. there are 22 A class Items sold in the month of February
● whereas items that is more than or equals to 50% are known as “B” items, 14 items are Classified as B
● And lastly the SKUs that fall under “C” Categories are less than 50%.The rest 241 Items are considered as B Class Items.
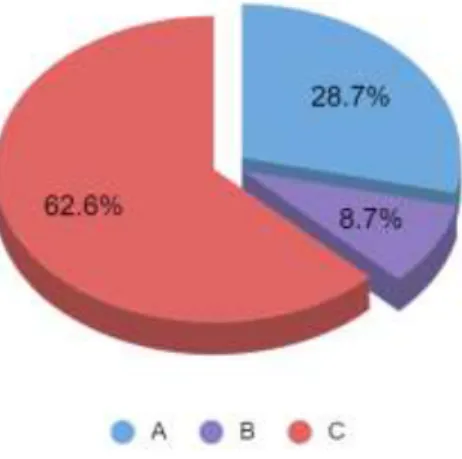
Table 2. Categorization summary
Category
Count Number
of SKU /Articles SKU/Article Percentage Of Investment
A 22
101-245 0.94
2-60 1.57
26-24 1.46
26-26 1.46
26-30 1.46
27-14 1.16
27-4 1.16
306-10 0.84
306-12 1.69
306-7 1.69
26
306-9 0.84
30-7 1.82
308-6 2.11
33-4 0.99
35-10 1.22
6-29 1.16
6-31 0.93
6-36 1.16
6-38 1.16
6-41 1.28
6-7 1.28
9-25 1.34
Total Percentage 28.72
Category
Count Number
of SKU /Articles SKU/Article Percentage Of Investment
B 14
101-256 0.57
101-258 0.57
113-18 0.55
119-91 0.55
119-97 0.55
128-5 0.61
26-54 0.73
30-0 0.73
306-15 0.64