This project/internship titled “AN INTEGRATED WEB IOT BASED SYSTEM FOR PREDICTION OF COVID-19 IN CLINICAL ENVIRONMENT” submitted by Suranjit Kumar Baidya, ID No at Department of Computer Science and Engineering, Daffodil International University has been accepted as satisfactory. partial fulfillment of the requirements for the degree of B.Sc. Department of Computer Science and Engineering Faculty of Information Science and Technology Daffodil International University. We declare that; this project was done by us under the supervision of Md.
We also declare that neither this project nor any part of this project has been submitted elsewhere for the award of any degree or diploma. Her endless patience, scientific guidance, constant encouragement, constant and energetic supervision, constructive criticism, valuable advice, reading many inferior drafts and correcting them at all stages have made the completion of this project possible. Touhid Bhuiyan, Head of CSE Department, for his kind help to complete my project and also to other faculty members and staff of CSE department of Daffodil International University.
We would like to thank our entire colleague at Daffodil International University who participated in this discussion while completing the course. Finally, we must acknowledge with due respect the constant support and patience of our parents. The utility of AI models is often severely limited by the homogeneity of data sources, which limits their applicability to other populations, populations, or geographic areas.
INTRODUCTION
- Introduction
- Motivation
- Objectives
- Expected Outcomes
- Project Management and Finance This project was fully funded by myself
- Organization of the Report
In this pandemic situation, we will be able to easily detect COVID with our X-ray findings. We also know that monitoring the patient every time is difficult and therefore we have used some hardware sensors to monitor the patient's heart rate, oxygen level and body temperature every time, which will be available at a low cost. Building a commercial IoT device for doctor-patient interaction and state-of-the-art service.
Any patient who thinks they need to use a remote doctor service can purchase this device from an authorized medical company or organization. Can be used in technical learning platform where web and hardware integration will be taught. The history, block diagram, circuit diagram and component list are all covered in the second chapter.
BACKGROUND
- Terminologies
- Related Works
- Comparative Studies
- Scope of the problem
- Challenges
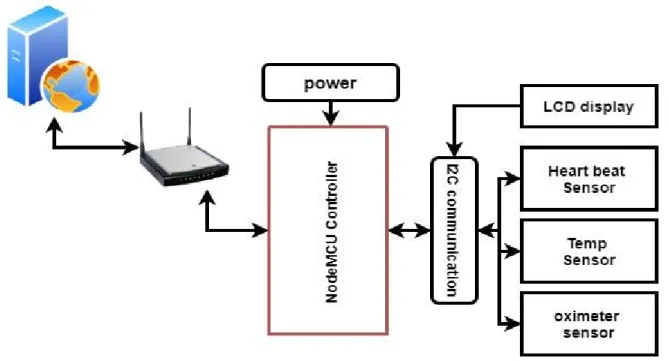
- Block diagram description
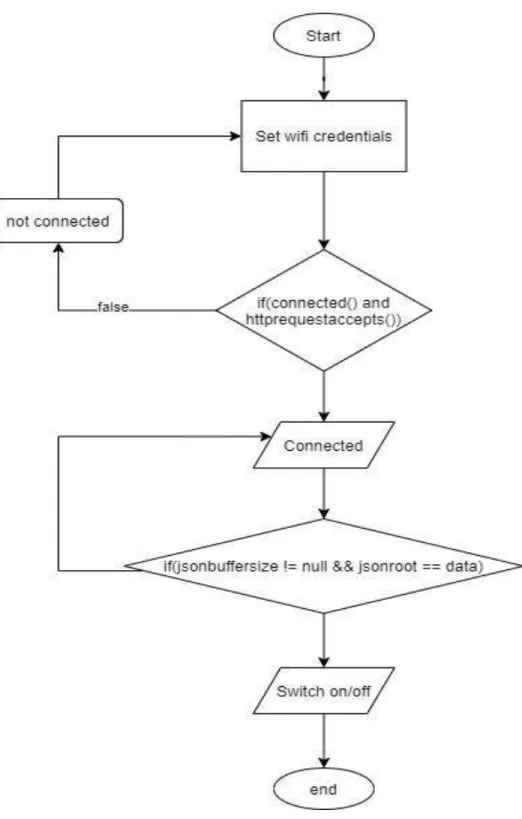
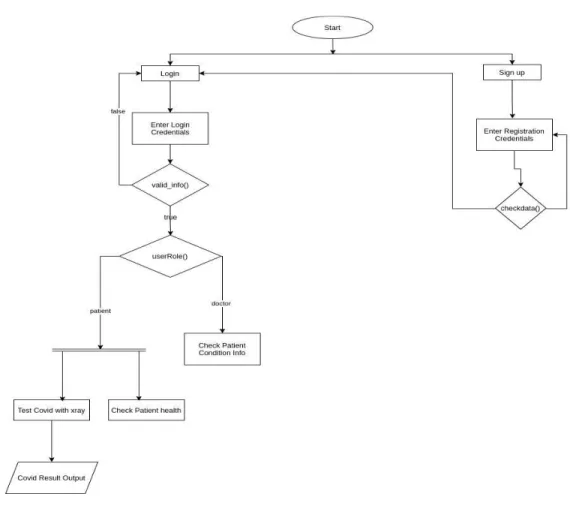
- Flowchart Diagram of our project
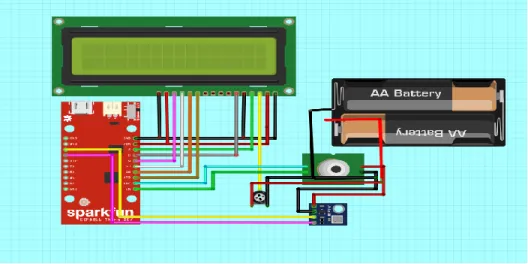
- Circuit diagram
- Working process our circuit diagram
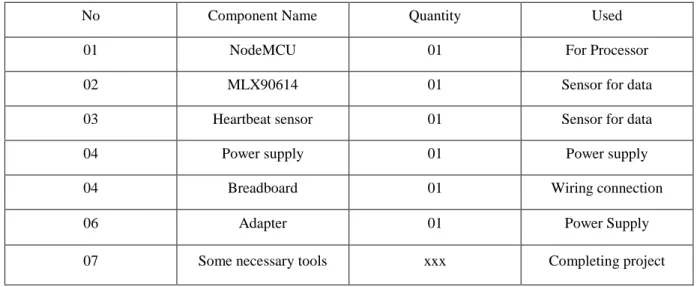
- List of Components used in Circuit
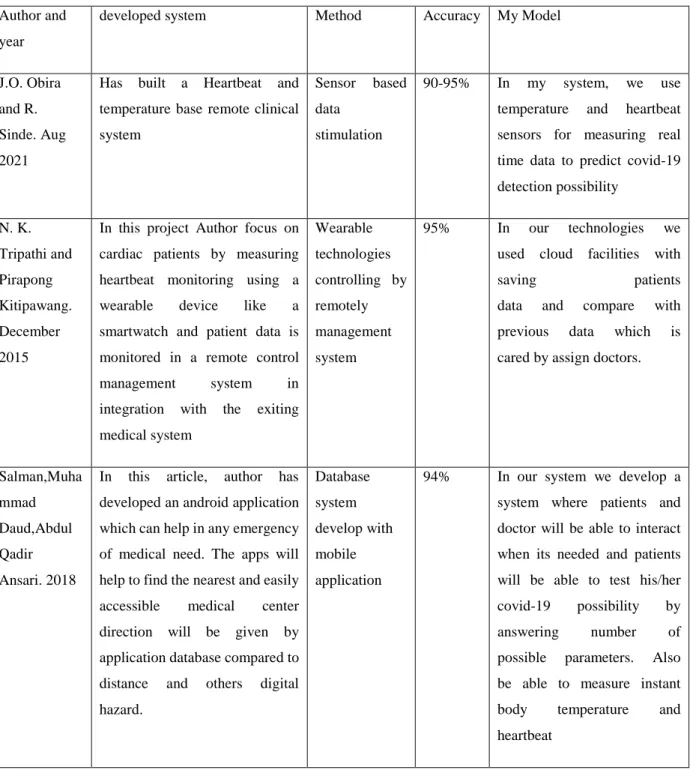
Overall, I can say that my system is quite different and flexible in this era, by analyzing any other related work on it. 90-95% In my system, we use temperature and heart rate sensors to measure real-time data to predict the possibility of Covid-19 detection. In this project, Author focuses on cardiac patients by measuring heart rate monitoring using a wearable device such as a smart watch and patient data is monitored in a remote control management system in integration with the emerging medical system.
In this article, the author has developed an android application that can help in any urgent medical need. The apps will help to find the nearest and easily accessible health center, the direction will be given by the app's database compared to the distance and other digital dangers. 94% In our system, we are developing a system where patients and doctors will be able to work together when necessary, and patients will be able to test their possibility of covid-19 by answering many possible parameters.
In this research, the authors focus on testing the possibility of covid-19 using image processing and a deep learning algorithm, where they tried to predict the percentage by analyzing the x-ray weather report, whether there is any chance that covid-19 is affected. So, I can hardly say this, this is the period when we can change the whole situation regarding covid-19 by using IoT. In this chapter we will discuss our project which is an IoT based service that provides web integration to the system using ng website webtroller option.
Here will show some work like block diagram of our project, circuit diagram, flow diagram and three components we used in this project. As we can see, our device first connects to the web platform through a router connection, because our microcontroller has a built-in Wi-Fi module that can connect our device to the Internet. The circuit diagram above is completed with our project wire, although there is little change in the real work due to the user-friendly hardware connection.
In the circuit diagram we will first give power to the system and all the system or device will be switched on and ready for action. Meanwhile, our microcontroller nodemcu will connect with Wi-Fi and there will be a bridge connection from network to server, then the sensor will start working as if we will get data from sensor as some predetermined random data while we start measuring our parameter, they will go directly through in the web portal for monitoring services.
HARDWARE SPECIFICATION
Introduction
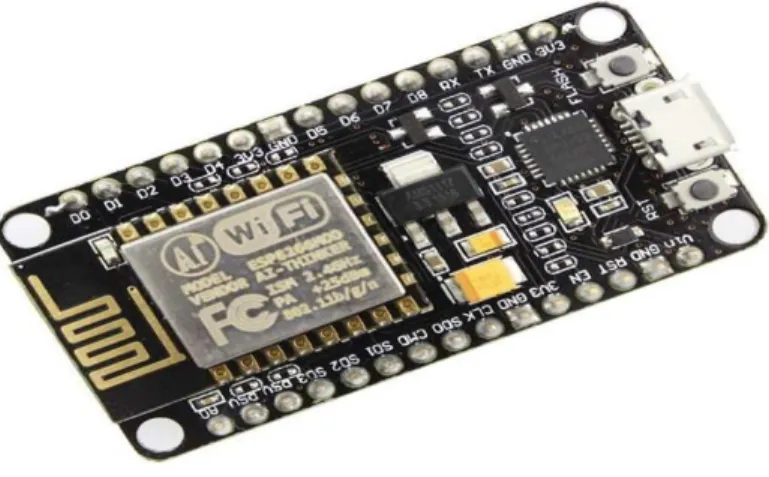
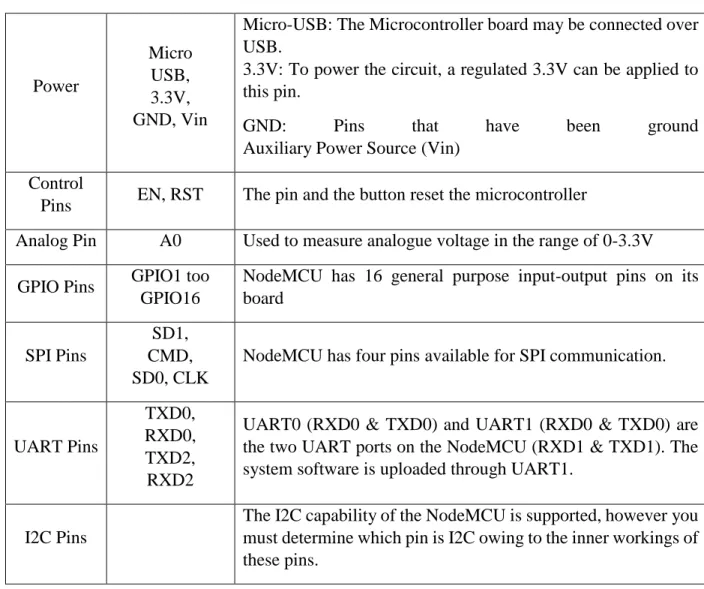
NodeMCU
Analog pin A0 Also used to measure analog voltage in the range of 0-3.3V GPIO pins GPIO1.
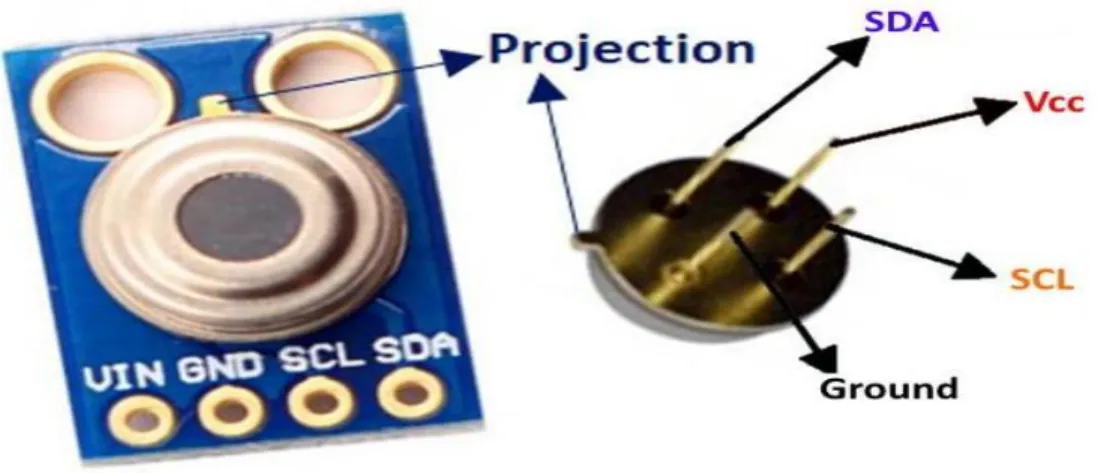
MLX90614 Temp Sensor
- Features and benefits
Industrial facility in line with a wide temperature range: - 40 to 125°C for sensor temperature and - 70 to 380°C for object temperature.
Heart Beat monitoring sensor
However, the volume within the thin tissues decreases between two consecutive pulses. The amount of light that passes through these tissues is affected by adjusting the volume between pulses. When we put our finger on the pulse sensor, the light that is considered changes depending on the amount of fluid in the fine veins.
The output from the beat sensor can be used to get this variation in light transmission and reflection as a heartbeat. This heart rate can then be used to measure heart rate and then appropriately adjusted to read as a heart rate test with Arduino.
Description of LCD Display
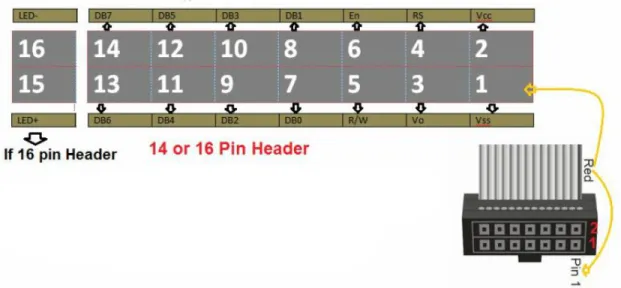
- Pin Description
- Control Lines
For example, compared to the more established "reverse nematic" types, the "supertwist" types provide a better cut and study point. Most 1-controller LCDs have 14 pins, and 2-controller LCDs have 16 pins (two pins are extra on both for LED backlight connections). This control line is also used to tell the LCD that data is being sent.
Also, transfer the data to the LCD and our software should make sure that line is low (0), then adjust the other two input lines and put the data into the data transfer shortly after. When RS is low (0), the facts are unmistakably comparable and should be treated as a hint and as a fresh direction (for example, a clear display, a position indicator, etc.) Data delivered at the moment when RS is high ( 1) , is the text data that should then be displayed on the screen. Additionally, displaying the letter "T" on the screen would set RS to a high value.
Obviously, when RW is low (0), the data transport information remains in contact with the LCD. Obviously, when RW is high (1), the program is matching (or probing) the LCD. Finally, data transport strengthens 4 or 8 lines (depending on the upgrade system chosen by the customer).
Wires
Power supply
Cost Analysis
- Cost Sheet
Conclusion
Purchasing a hosting server, a web hosting plan, purchasing server space, and registering a domain name are all steps in the process. Use HTML, CSS, and JavaScript to develop the website, as well as PHP, a server-side programming language, to handle input/output and interactive elements on the website. Use MySQL, a relational database management technology, to design and maintain the essential data sets, as well as link them to the PHP code.
Our Design web application features
From the previous case study common symptom and are set based on previous data of patients affected by Covid such as Fever, Cough, Fatigue, etc. and a parameter will be set for each symptom. The love of Covid has increased for not maintaining social distance, making the gathering of those with mild symptoms suggest staying away from the social gathering, and if more than 10-15 smartphones are used in that place, the person with mild symptoms will be alerted. Based on the symptoms, people with mild symptoms will be suggested a related medicine.
Doctors are said to have suggested that regular and generic medicines will be prescribed to that person. 5.3 Web Development Environment. An application development environment is a collection of hardware, software, and/or computing resources used to create application software (ADE). These are used with systems engineering resources such as the Integrated Development Environment (IDE) for a programming language and other software applications for performance evaluation.
Service
Database
Development Model
Platform
Node MCU Connection and Data Pass
The environment is developed in Java and is based on open source tools such as processing, avr-gcc and others. Although some third-party programs, such as Ino, make it possible to build from the command line if necessary. The Arduino IDE includes a C/C++ library called "Wiring" (from the project of the same name), which simplifies many common input/output operations.
Arduino programs are written in C/C++, however to create an executable program, users simply need to declare two functions: Setup () is a function that is called only once at the beginning of a program and can be used to initialize settings .
Conclusion
Experimental Setup
Registration panel for doctor
Checkup data monitoring panel
Covid Detector checkup by X-ray report analyzing through upload
Login as Doctor for administrational service
- Doctor profile/Dashboard
List of patients in Doctor profile with condition
View patients’ profile from dashboard
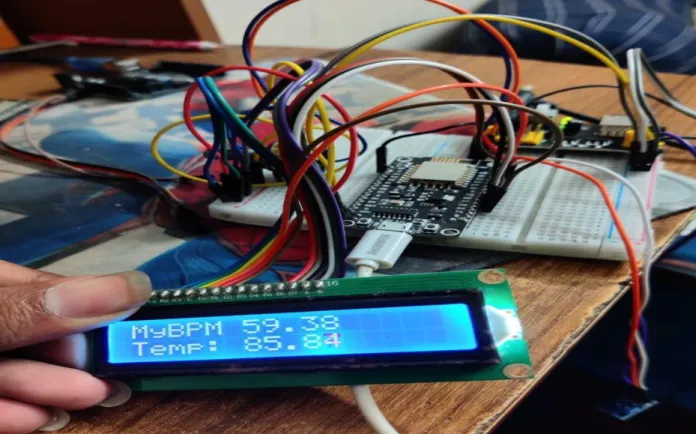
- Hardware Section Experiment
- Result
Here we show that our IoT-based medical service provider projects into the hardware section for testing purposes. After simulation and experimental work we were able to complete our project with the integration of the Internet. As we already discuss, our project can be of great help to the medical service during a pandemic or other brutal health crisis.
Although in normal daily life we can use this medical service to take doctor suggestions and prescribe medicine, we can wipe out our health problem. Now finally we can say that our project is complete and running as we want. Our project is now able to receive signal from our web application and has seen live data regulation of patients.
So we said our framework was a viable, fast response, generally secure, and easy to build.
CONCLUSION AND FUTURE SCOPE 7.1 Conclusion
Advantages
Disadvantages
Future Scopes