40 Table 5.1 Salt Intrusion Period and Gate Opening Time 47 Table 5.2 Salinity Level in Sailadaha River 48 Table 5.3 Salinity Level in Canal Water 49 Table 5.4 Salinity Concentration in Pond Water 552 Salinity Concentration in Sailadaha River hand tube well water 53 Table 5.6 Seasonal calendar of farming practices 56. 30 Figure 4.1 FGD with women of Kakuibunia village 33 Figure 4.2 FGD with farmers of Kakuibunia village 34 Figure 4.3 FGD with fishermen of Kakuibunia village. FGD in Kakuibunia.
Background
Drinking water and some domestic water needs (e.g. cooking) in the project area are covered by groundwater. However, the salinity measurement that the researcher made in such a hand tube well during the exploratory visit showed that the salt concentration in the groundwater was very high.
Objectives of the Study
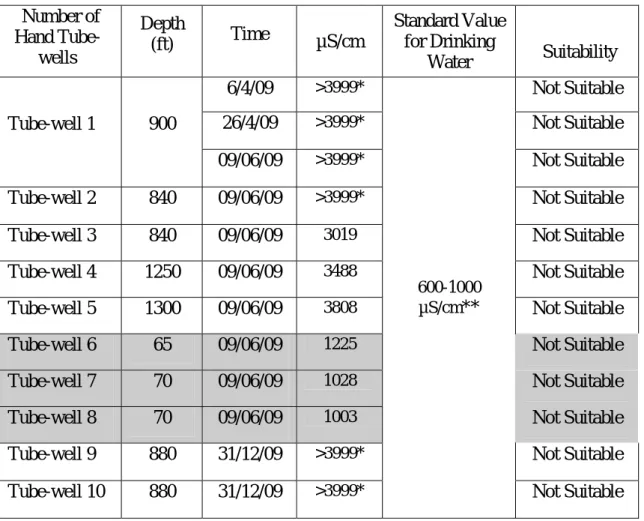
Local residents use water for drinking and domestic purposes from hand tube wells located at 840 to 1200 ft due to the presence of arsenic in high concentration at shallow depths.
Organization of the Report
Introduction
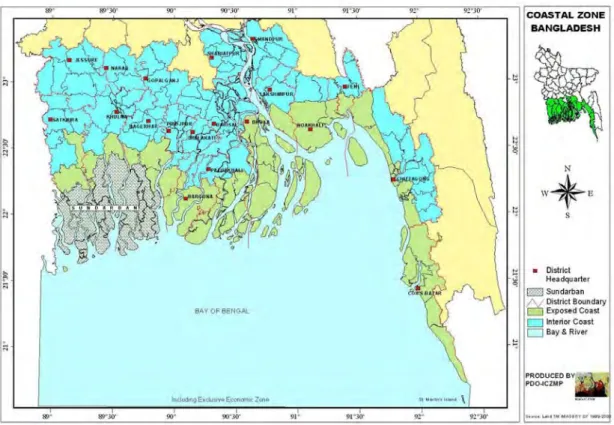
Salinity Processes in Coastal Region .1 The coastal zone
Surface water salinity
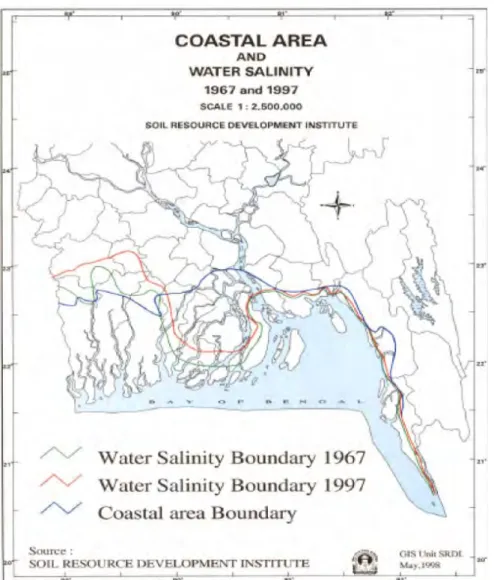
In the southwestern region, surface water salinity has been accentuated by the reduction of dry season flows entering the Gorai tributaries following the diversion of the Ganges flow upstream of the border. Increased salt water intrusion into the freshwater of southwestern Bangladesh is one of the most important environmental effects that has changed the entire ecosystem in the coastal areas of the region (Nishat, 1988).
Groundwater salinity
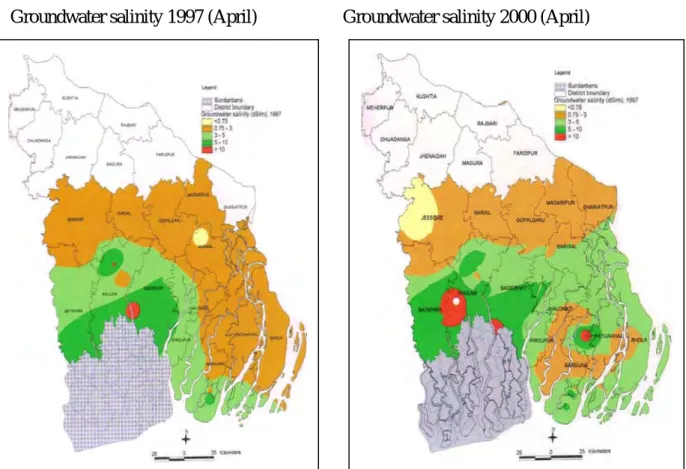
Sarker (2005) analyzed groundwater salinity data measured by the Soil Resources Development Institute (SRDI) in the month of April in two different years (1997 and 2000) at 43 stations in the southwestern region of Bangladesh and produced groundwater salinity maps (see figure 2.3). . The analysis further revealed that the salinity range of the groundwater in the entire study area increased by approximately 4.7% over the three-year period.
Soil salinity
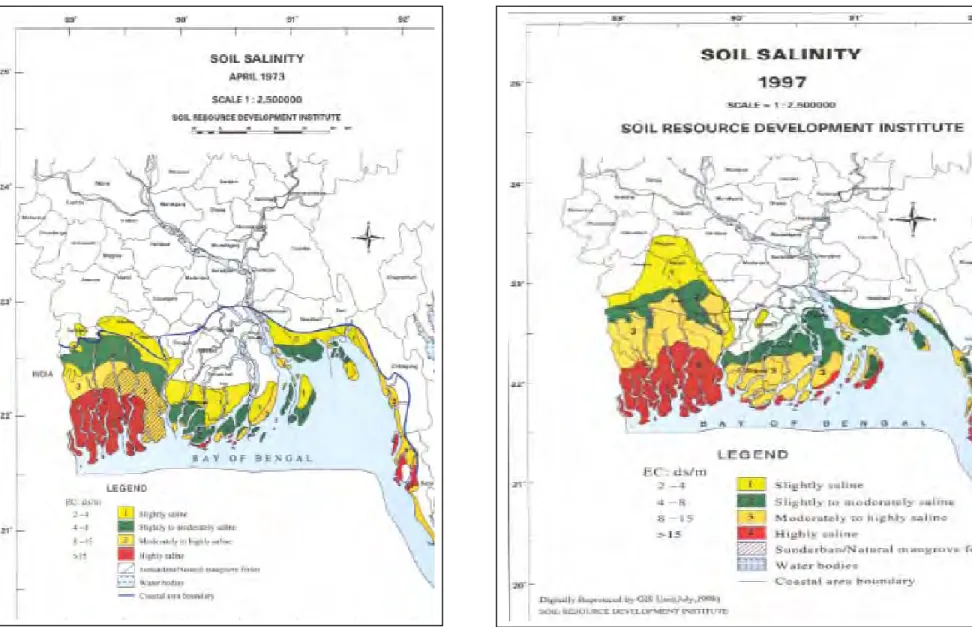
The increase in water salinity in these areas has created a suitable habitat for shrimp farming. According to the salinity survey findings and salinity information, about 1.02 million ha (about 70%) of cultivated lands are affected by varying degrees of soil salinity.
Impacts of Salinity on Different Water Uses .1 Impact on agriculture
- Impact on ecosystem
- Impact on domestic water use
- Impact on health
- Other social and economic consequences
Native species of fish are declining in the region as salt water from the sea reaches rivers and canals. The skin of adolescent girls becomes rough and unattractive due to the use of salt water.
Introduction
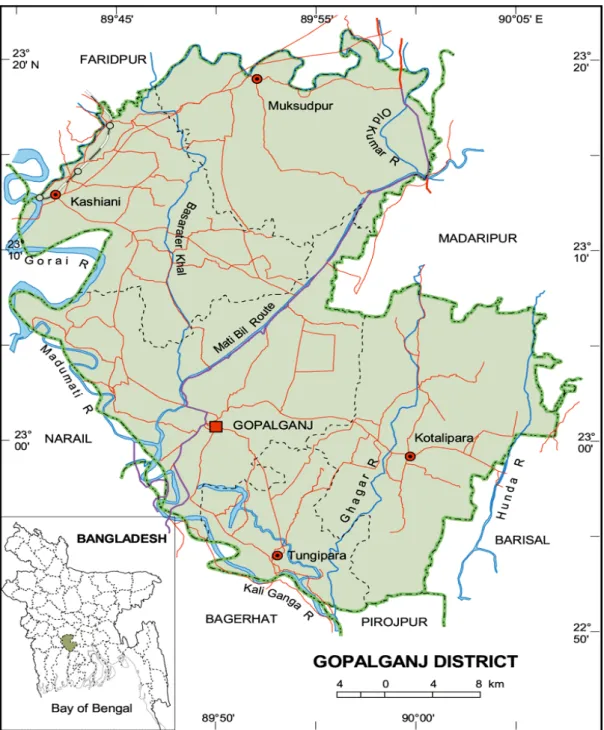
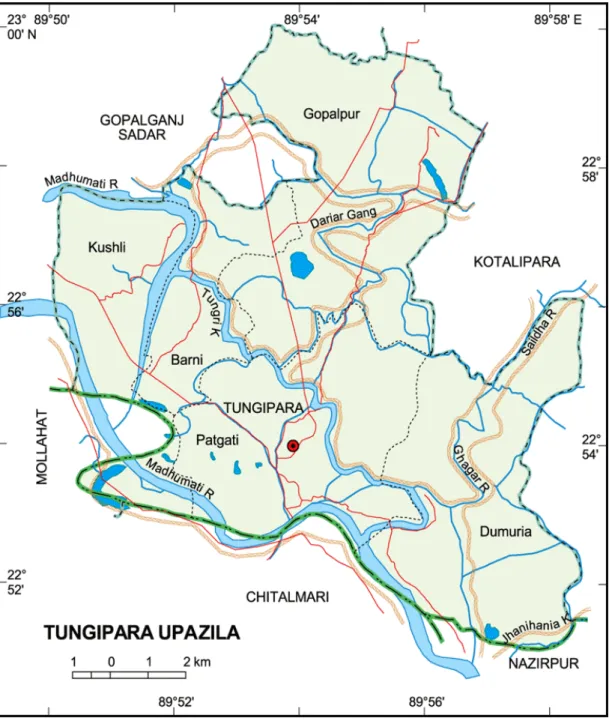
Location
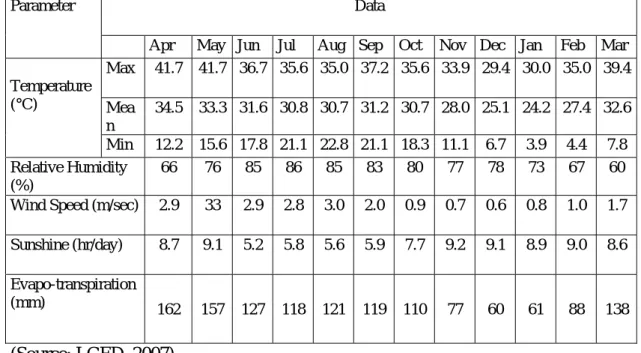
Climate
River Systems
Project Infrastructure
Land Use and Land Type
Agricultural Land Use
Transplanted aman (T. aman) grown in rotation with HYV boron is the main crop pattern in the district. Study Area: Before the project, one crop was grown in a year, but now two crops are grown in a year namely Boro and Aus/Aman. The main benefit of the Tripalli (Kakuibunia–Chinguri) sub-project is increased agricultural production; in particular, a total increase of 524 tonnes (103%) for cereals: pulses, oilseeds and spices production will increase by 47 tonnes (134%) (LGED, 1998).
Fisheries
Study Area: The project assessment report of LGED (1998) predicted that as a result of the construction of the embankment in the Tripalli (Kakuibunia-Chinguri) sub-project, the amount of F3 and F2 land would be reduced from 121 ha to 115 ha. It would have a negative impact on biodiversity and fisheries production in the sub-project area. Fishery habitat, yield and production of the Tripalli (Kakuibunia-Chinguri) sub-project are shown in Table 3.5.
In 2006, fish farming was done in the Kakuibuni channel, but now it has been stopped due to different opinions among the residents of the village.
Aquifer and Groundwater
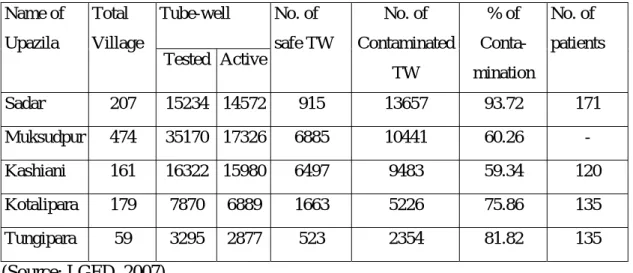
In recent years, arsenic contamination of groundwater has emerged as an acute problem; groundwater in as many as 61 out of 64 districts is contaminated with arsenic. It was also found that although there are many shallow tube wells, villagers cannot use water from tube wells at shallower depths because of the arsenic problem. There are only 7 manual tube wells (dropped at 840 to 1200 ft) in the study area from which water is collected for drinking, cooking and some domestic purposes.
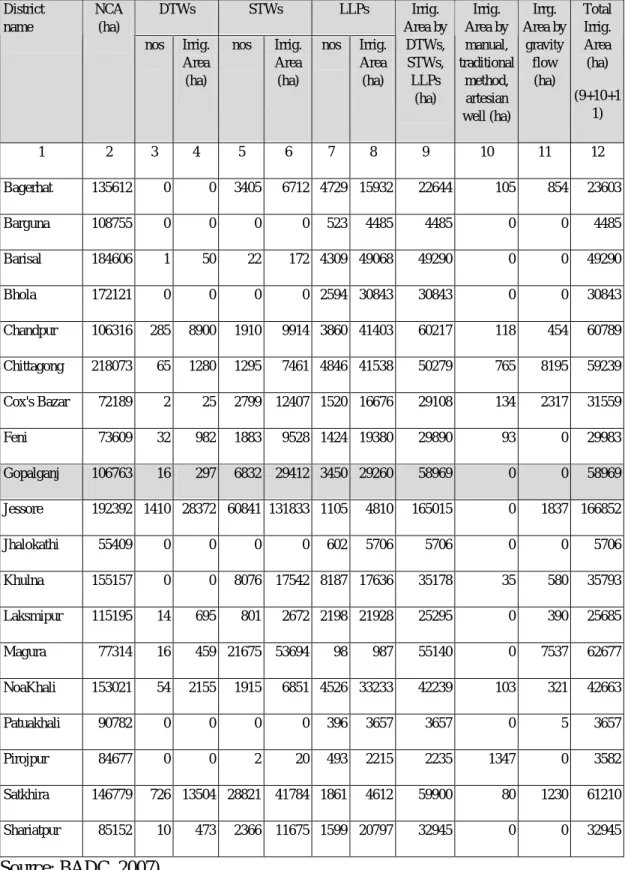
Irrigation Development Gopalganj district
Farm Size Distribution
Occupational Distribution
Introduction
Primary Data Collection
Field reconnaissance visit
As a result, an enabling situation is created in which the members of the group discuss the subject of concern among themselves with the help of the facilitator and in the presence of one or more observers. The uses of these resources and accessibility of the poor people to these resources are also analyzed. This place was chosen by consulting with local people as it is located in the middle of the town, so that people from all sides could easily come there.
Ninety percent of the women were housewives, while the rest were engaged in agricultural activities.

Salinity measurement
From a hand tube-well (depth-9 ted during the first and last weeks of April and June, to identify salinity variations in groundwater, if any. In the study area, a total of seven tube wells are used mainly for drinking and domestic water collection. During sampling from the hand tube well, the well was pumped continuously for about 5 minutes before sampling in order to remove the effect of standing water inside the tube.
About 500 ml water samples were collected from both surface and groundwater sources such as rivers, canals, ponds and hand tube wells.

Secondary Data Collection
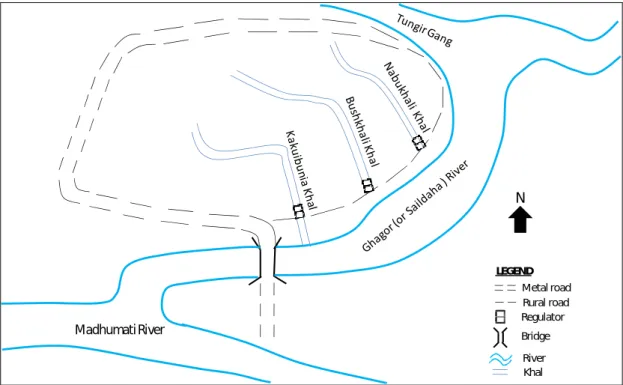
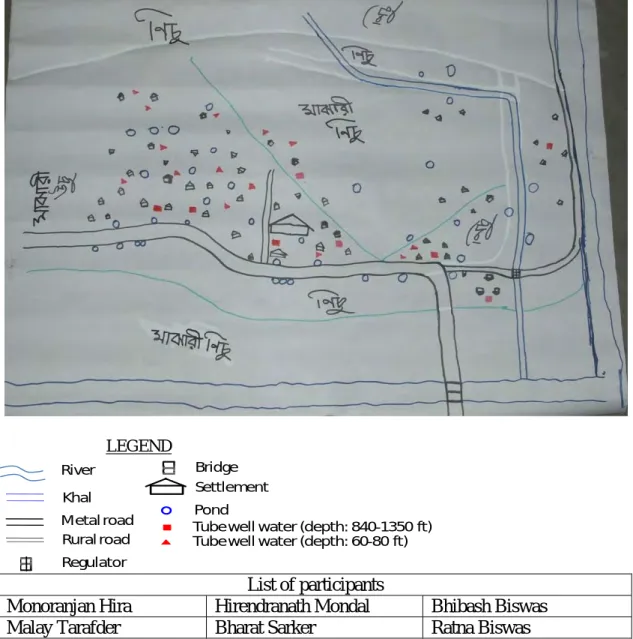
A resource map was prepared with the participation of the local population in the study area, which is presented in figure 5.1. The area of Kakuibunia village is about 100 acres and the total cultivable land is about 10 acres. According to the information provided by the local union office, the village has a population of 738, of which 394 are males and 344 are females.
Introduction
- Natural system
- Infrastructure system
- Instituti
- Settlements
- Land types
The Ghagor River (also known locally as the Sailadaha River) flows along the southern side of the village. You can walk from the southwestern corner of the village to the southeastern part along the river. The villagers regulate the water in the canal according to their needs through the operation of the regulator.
One metalled road runs on the right side of the village along the Sailadaha river.
Different Water Use
Other buildings are found on the left side of the canal. d in the area of control of intruding tidal water). The village is mainly dominated by medium low land and low land as can be seen on the resource map (Figure 5.1). There is some medium-high ground in the south-east corners of the village and the north side of the metalled road, which consists mainly of built-up areas, as can be seen on the resource map.
In the study area, local people use water for irrigation from the Kakuibunia canal and irrigation is done by low-lift pumps.
Salinity Problem in the Study Area
Operation of Kakuibunia regulator
The regulator is also used to control saltwater intrusion into the Kakuibunia channel from the river. The regulator is kept open during December to mid-April to allow water into the area used in dry season irrigation. The gate is kept closed from late April to September to prevent salinity intrusion into the canal.
In October, the regulator is kept open for the removal of rainwater from the low-lying area through the can.
Salinity in surface water system
- Salinity in river
- Salinity in canal
- Salinity in ponds
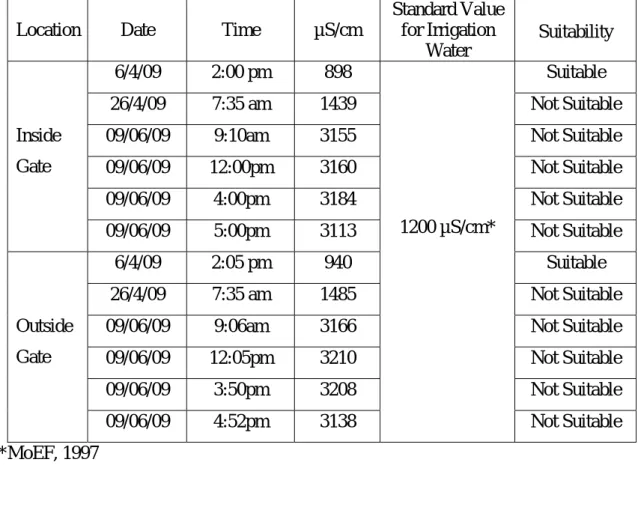
Considering the fact that the gate is kept closed from late April to September. Lo ple t the d ope ell for the first pair .. im ntation r, du ical p the gate does not close. Moreover, the floor of the gate Where the river is low, water through ice can be said by people to lower the uld by at least 3 feet.
Although it is clear that salt water leaking under the failed gate towards the interior of the project makes the salinity similar (in range) to outside the gate, there is a damping effect and a time lag that shows up in the lower salinity level inside the gate and the peak salinity level inside the gate , which appears later.
Salinity in groundwater system
Salinity levels at shallow depths (tubewells 6, 7 and 8) are low, whereas salinity levels at deeper depths (840-1350 ft) are very high. The levels at deeper depths are far above (3 times or more) than the tolerable limit (600-1000 µS/cm) of drinking water standard. Lithological analysis in and around the study area, as presented in Figure 5.5, shows a complex system that varies over short distances, with very little or no water-bearing formations at deeper depths.
In fact, the local DPHE official reported that it is not very easy to install tube wells at deeper depths; in some cases, the installation had to be abandoned due to the presence of hard rock.
Salinity Constraints to Different Water Use .1 Constraints to irrigation water
Constraints to domestic water use
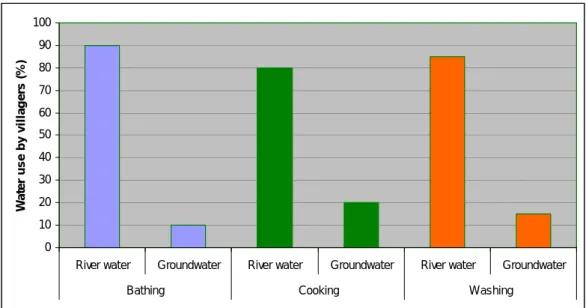
The salinity measurement of the hand tube wells showed that the salinity concentration is much higher than the standard value for drinking water. From semi-structured interviews with 50 people, a quantitative indication of the sources of various household uses of water, other than drinking water, was obtained, which is shown in Figure 5.6. In the literature, excessive salt consumption has been found to cause exercise-induced asthma, heartburn, duodenal and gastric ulcers, hypertension (high blood pressure), left ventricular hypertrophy (enlargement of the heart), gastric cancer (stomach cancer), osteoporosis (reduces bone density). in women), hypernethremia (Can worsen kidney disease) and even death (consumption of large amounts of salt in a short period of time of about 1 g per kg of body weight can be fatal).
Therefore, their health problem must be strongly related to the salinity in the drinking water.
Constraints to aquatic lives
When this river water is used for cooking, more time is required for cooking food and the cooked food gets rotten very early. Freshwater fish bred in ponds in the study area are Rui, Katla, Silver Carp, Mrigal, Puti, Glass Carp, Mining Carp etc. The fish found in the low lying areas are declining due to salt water intrusion.
Local people also reported that the increasing salinity in the Water Hyacinth River (locally known as Kachuripana) has increased drastically.
Management Options
They reported that they only recently found out about the problem, contrary to what the locals were reporting, and that the gate would be fixed soon. 95% of farmers use gypsum, while about 5% of farmers use organic fertilizers and Dhaincha fruit, which helps reduce soil salinity. All farmers use an insecticide called "Septin" to get rid of insect attacks (Mow-poka).
Although high levels of salinity were found in the tubewells, local people were not concerned about it.
Conclusions
There is no initiative from the WMCA, even though they have been warned about the problem several times over the past 4 years. There seems to be some conflict between WMCA's powerful leaders, who are mostly unscathed. MoEF (1997), Ministry of Environment and Forests, Government of Bangladesh, Water Quality Standards for Drinking and Irrigation Notification 1997, Department, People's Government.
-ICZMP (2001), Inception Report- Preparatory Phase for Sustainable Development of the Coastal Zone of Bangladesh.