YIELD AND CARBON SEQUESTRATION OF PIGEON PEA AT DIFFERENT ENVIRONMENTS IN BANGLADESH
MST. ATQIYA SADIA
DEPARTMENT OF AGROFORESTRY AND ENVIRONMENTAL SCIENCE SHER-E-BANGLA AGRICULTURAL UNIVERSITY
DHAKA-1207
JUNE, 2020
YIELD AND CARBON SEQUESTRATION OF PIGEON PEA AT DIFFERENT ENVIRONMENTS IN BANGLADESH
BY
MST. ATQIYA SADIA REGISTRATION NO . 13-05289
A Thesis
Submitted to the Faculty of Agriculture Sher-e-Bangla Agricultural University, Dhaka,
in partial fulfillment of the requirements for the degree of
MASTERS OF SCIENCE IN
AGR
OFORESTRY AND ENVIRONMENTAL SCIENCE
SEMESTER: JANUARY- JUNE, 2020APPROVED BY :
Dr . A.K.M. Mahbubul Alam Co - Supervisor
Professor Dr . Nazmun Naher Supervisor
Dr . Jubayer-Al-Mahmud Chairman
Examination Committee
Chairman
Examination Committee
CERTIFICATE
This is to certify that the thesis entitle, “
YIELD AND CARBON SEQUESTRATION OF PIGEON PEA AT DIFFERENT ENVIRONMENTS IN BANGLADESH” submitted to the Faculty of Agriculture, Sher - e - Bangla Agricultural University, Dhaka in partial fulfillment of the requirements for the degree of MASTER OF SCIENCE IN AGROFORESTRY AND ENVIRONMENTAL SCIENCE, embodies the result of a piece of bona fide research work carried out by MST. ATQIYA SADIA, Registration No . 13 - 05289 under my supervision and my guidance . No part of the thesis has been submitted for any other degree or diploma .
I further certify that such help or source of information, as has been availed of during the course of this investigation has duly been acknowledged.
Dated: June, 2020 Dhaka, Bangladesh
Prof. Dr . Nazmun Naher Professor Supervisor
Sher-e-Bangla Agricultural University Sher-e-Bangla Nagar, Dhaka-1207
PABX: +88029144270-9 Fax: +88029112649 Web site: www.sau.edu.bd
D EDICATED TO
M Y B ELOVED Husband
Dr. Md. Mahbul Alam
i
ACKNOWLEDGEMENTS
All the praises and gratitude are due to the omniscient, omnipresent and omnipotent Almighty Allah, who has kindly enabled the author to complete her research work and complete this thesis successfully for increasing knowledge and wisdom.
The author sincerely desires to express her deepest sense of gratitude, respect, profound appreciation and indebtedness to her research Supervisor Professor Dr. Nazmun Naher, Department of Agroforestry and Environmental Science, Sher-e-Bangla Agricultural University, Dhaka for her kind and scholastic guidance, untiring effort, valuable suggestions, inspiration, co-operation and constructive criticisms throughout the entire period of the research work and the preparation of the manuscript of this thesis.
The author expresses heartfelt gratitude and indebtedness to her Co-supervisor, Dr. A.K.M.
Mahbubul Alam, PSO, Bangladesh Agricultural Research Institute, Gazipur, for his cordial co- operation, valuable advice and helpful suggestions for the successful completion of the research work.
The author is highly grateful to Dr. Jubayer-Al-Mahmud, Chairman, Department of Agroforestry and Environmental Science, Sher-e-Bangla Agricultural University, Dhaka along with all the teachers and staff members of the Department of Agroforestry and Environmental Science, Sher-e- Bangla Agricultural University for their co-operation during the period of the study.
Finally, the author found no words to thank her parents and husband for their unquantifiable love and continuous support, their sacrifice never ending affection, immense strength and untiring efforts for bringing her dream to proper shape. They were constant source of inspiration, zeal and enthusiasm in the critical moment of her studies.
May Allah bless and protect them all.
Dated: June, 2020 The author
ii
YIELD AND CARBON SEQUESTRATION OF PIGEON PEA AT DIFFERENT ENVIRONMENTS IN BANGLADESH
ABSTRACT
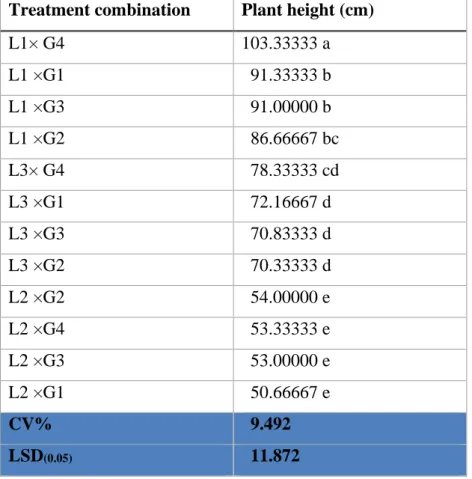
Pigeon pea is a multi-purpose species for agroforestry systems and subsistence agriculture especially the ability to recover from the losses caused by various biotic and abiotic stresses. So, this experiment was carried out to determine the performance of four pigeon pea genotypes for yield and yield contributing characters, stability and carbon sequestration across different environments of Bangladesh. This experiment was conducted under three different locations viz. Gazipur, Sylhet and Madaripur during the year 2018-2019. The experimental materials comprised of four pigeon pea genotypes namely G1= BPP1502, G2 =BPP1503, G3 = BPP1504 and G4 = BPP1505 and was conducted in randomized complete block design with three replications in each environment. Significant differences were observed for all the genotypes of pigeon pea against number of branches plant-1, pods plant-1, seeds pod-1, plant height, breadth, stem diameter and hundred seeds weight among the environments. Highest plant height (103.33 cm) of pigeon pea genotype was observed in G4 at Gazipur. G3 produced highest no of pods plant-1 (188.00) and hundred seed weight (9.10 g) at Gazipur. Carbon sequestration plant-1of pigeon pea (7.63 lbs) and carbon sequestration year-1 (15.23 lbs) both were highest in G4 at Gazipur and lowest was found in G2 at Sylhet. For stability of performance across environments, G3 and G4 were identified as most stable genotypes and G1 and G2 were found least stable. On the basis of both stable performance and mean seed yield across environments, the GGE biplot ranked genotype of pigeon pea, G3 as the best among all, followed by G4 while the rest of the genotypes were identified as inferior. Gazipur was identified as most representative environment and highly discriminative as compared to the others.
iii
ACRONYMS
% =Percent
0C =Degree Celsius
AEZ =Agro Ecological Zone ANOVA =Analysis of Variance ATC=Average tester coordinate B=Boron
BARI =Bangladesh Agricultural Research Institute BBS =Bangladesh Bureau of Statistics
CEC=Cation exchange capacity cm =centimeter
cm2 =Centimeter square CV =Co-efficient of Variation DW =Dry weight
E=East
e.g. =For example et al. =And others
FAO =Food and Agriculture Organization
FAOSTAT =Food and Agriculture Organization Statistics FW =Fresh weight
g =Gram lbs= Pound K =Potassium
LSD =Least Significant Difference m =Metre
mm =Milimeter
MOP=Murate of potash N =North
no. =Number
PC1=First principal component PC2= Second principal component
RARS=Regional Agricultural Research Station RPRS=Regional Pulse Research Station
S =South
SAU =Sher-e-Bangla Agricultural University SOC= Soil organic carbon
TSP=Triple super phosphate viz. =Namely
W=West Zn=Zinc
iv
CONTENTS
CHAPTER TITLE Page
no
ACKNOWLEDGEMENT i
A ABSTRACT ii
ACRONYMS iii
CONTENTS iv
LIST OF TABLES viii
LIST OF FIGURES ix
LIST OF PLATES x
CHAPTER 1 INTRODUCTION 1-3
CHAPTER 2 REVIEW OF LITERATURE 4-22
2.1 Pigeon pea 4
2.2 Growth and development of pigeon pea 5 2.3 Scenario of pigeon pea production and
marketing In Bangladesh and around the world
6 2.4 Socio-economic importance of pigeon pea 9
2.5 Intercropping 11
2.6 Importance of legume 12
2.7 Carbon sequestration from different plant 13
2.8 Pigeon pea yield 15
2.9 Pigeon pea low yield 16
2.10 Constraints of pulse production in Bangladesh 16
2.11 GGE-biplot technique 17
2.12 Application of GGE-biplot technique on some crop
19
CHAPTER 3 MATERIALS AND METHODS 23-28
3.1 Experimental site 23
3.2 Soil 23
3.3 Climate 24
3.4 Materials 24
3.5 Experimental Design 24
3.6 Methods 24
3.6.1 Land Preparation 24
3.6.2 Sowing of seeds 25
3.6.3 Fertilizer 25
3.7 Intercultural operations 25
3.7.1 Weed control 25
3.7.2 Thinning 25
v
3.7.3 Irrigation and drainage 25
3.7.4 Pest and disease management 25
3.8 Harvesting and sampling 26
3.9 Threshing, drying, cleaning and weighing 26
3.10 Data collection 26
3.11 Statistical analysis 28
CHAPTER 4 RESULTS AND DISCUSSION 29-60
4.1 Plant height (cm) 29
4.1.1 Effect of location on plant height (cm) of pigeon pea
29 4.1.2 Effect of genotype on plant height (cm) pigeon
pea
30 4.1.3 Interaction effect of location and genotype on
plant height (cm)
30
4.2 plant breadth (cm) 31
4.2.1 Effect of location on plant breadth (cm) of pigeon pea
31 4.2.2 Effect of genotype on plant breadth (cm) of
pigeon pea
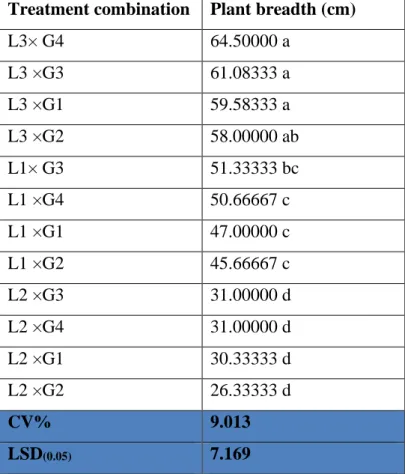
32 4.2.3 Interaction effect of location and genotype on
plant breadth (cm)
32
4.3 Stem diameter (cm) 33
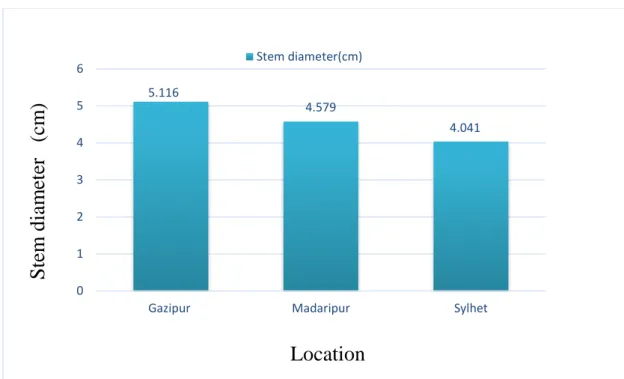
4.3.1 Effect of location on stem diameter (cm) of pigeon pea
33 4.3.2 Effect of genotype on stem diameter (cm) of
pigeon pea
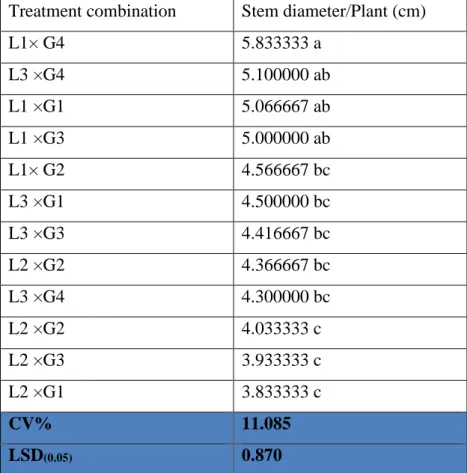
34 4.3.3 Interaction effect of location and genotype on
stem diameter(cm)
35
4.4 Number of branches plant-1 36
4.4.1 Effect of location on number of branches plant-
1 of pigeon pea
36 4.4.2 Effect of genotype on number of branches
plant-1 of pigeon pea
37 4.4.3 Interaction effect of location and genotype on
number of branches plant-1
37
4.5 Number of pods plant-1 38
4.5.1 Effect of location on number of pods plant-1 of pigeon pea
38 4.5.2 Effect of genotype on number of pods plant-1 of
pigeon pea
39 4.5.3 Interaction effect of location and genotype on
number of pods plant-1
40
4.6 Number of seeds pod-1 41
vi
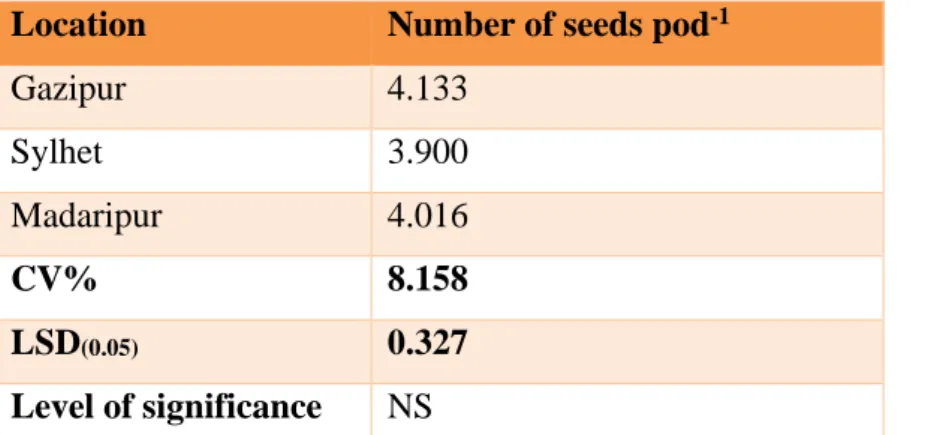
4.6.1 Effect of location on number seeds pod-1 of pigeon pea
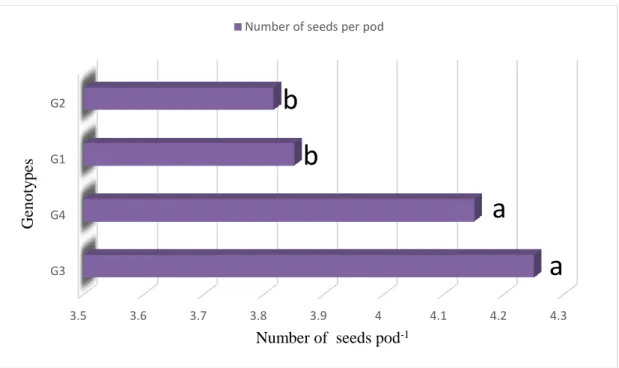
41 4.6.2 Effect of genotype on pigeon on number seeds
pod-1 of pigeon pea
42 4.6.3 Interaction effect of location and genotype on
number of seeds pod-1
42
4.7 Hundred seed weight (g) 43
4.7.1 Effect of location on hundred seed weight (g) of pigeon pea
43 4.7.2 Effect of genotypes on hundred seed weight
(g) of pigeon pea
44 4.7.3 Interaction effect of location and genotype on
hundred seed weight (g)
45
4.8 Yield plant-1 (g) 46
4.8.1 Effect of location on yield plant-1 (g) of pigeon pea
46 4.8.2 Effect of genotype on yield plant-1 (g) of
pigeon pea
48 4.9 Carbon dioxide sequestration plant-1 (lbs) 48 4.9.1 Effect of location on carbon dioxide
sequestration plant-1 (lbs) of pigeon pea
48 4.9.2 Effect of genotype on carbon dioxide
sequestration plant-1 (lbs) of pigeon pea
49
4.9.3
Interaction effect of location and genotype on carbon dioxide sequestration plant-1 (lbs)
49 4.10 Carbon dioxide sequestration year-1(lbs) 50 4.10.1 Effect of location on carbon dioxide
sequestration year-1(lbs) of pigeon pea
50 4.10.2 Effect of genotype on carbon dioxide
sequestration year-1(lbs) of pigeon pea
51 4.10.3 Interaction effect of location and genotype on
carbon dioxide sequestration year-1(lbs)
52
4.11 GGE biplot 53
4.11.1 Ranking ideal genotype of pigeon pea for yield 54 4.11.2 Ranking ideal genotype of pigeon pea for
carbon dioxide sequestration
55 4.11.3 Mean vs stability performance for yield of
pigeon pea
56 4.11.4 Mean performance vs stability for carbon
dioxide sequestration of pigeon pea
57 4.11.5 Discriminativeness vs representativeness of
location for yield of pigeon pea
58 4.11.6 Discriminativeness vs representativeness of
location for carbon sequestration of pigeon pea
60
vii
CHAPTER 5 SUMMARY AND CONCLUSION 61-63
CHAPTER 6 REFERENCES 64-76
APPENDICES 77-88
viii
LIST OF TABLES
Table no. Title of the table Page no.
1 Interaction effect of location and genotype on plant height (cm)
31 2 Interaction effect of location and genotype on
plant breadth (cm)
33 3 Effect of genotype on plant height, breadth and
stem diameter (cm) of pigeon pea
34 4 Interaction effect of location and genotype on
stem diameter
35 5 Effect of genotype on the number of branches
plant-1 and on number of pods plant-1 of pigeon pea
37
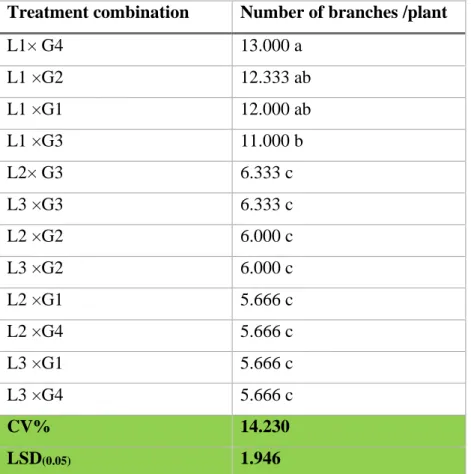
6 Interaction effect of location and genotype on the number of branches plant-1
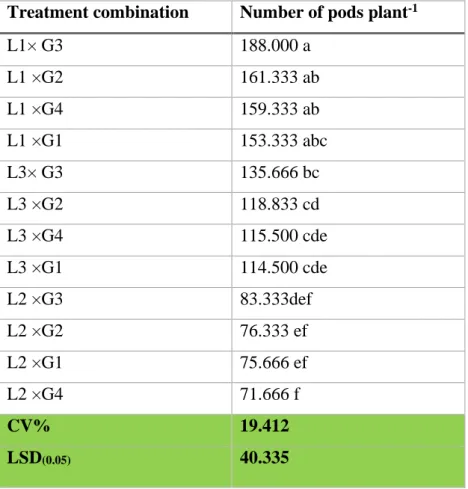
38 7 Interaction effect of location and genotype on
the number of pods plant-1
40 8 Effect of different location on number seeds
pod-1 of pigeon pea
41 9 Interaction effect of location and genotype on
the number of seeds pod-1
43 10 Interaction effect of location and genotype on
hundred seed weight (g)
46 11 Effect of genotype on yield plant-1 (g) of pigeon
pea
48 12 Interaction effect of location and genotype on
carbon dioxide sequestration plant-1 (lbs)
50 13 Effect of genotype on carbon dioxide
sequestration plant-1 (lbs) and year-1(lbs) of pigeon pea
51
14 Interaction effect of location and genotype on carbon dioxide sequestration year-1 (lbs)
52
ix
LIST OF FIGURES
Figure no.
Title of figure Page
no.
1 Effect of location on plant height (cm) of pigeon pea (CV - 9.502% with LSD(0.05)value- 6.920)
29 2 Effect of location on plant breadth (cm) of pigeon pea (CV
-7.952% with LSD(0.05)value- 3.684)
32 3 Effect of location on stem diameter (cm) of pigeon pea (CV
-11.049% with LSD(0.05)value- 0.505)
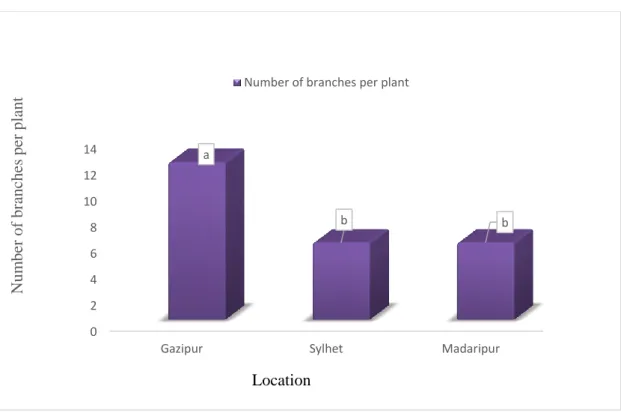
34 4 Effect of location on the number of branches per plant of
pigeon pea (CV – 21.434% with LSD(0.05)value-1.707)
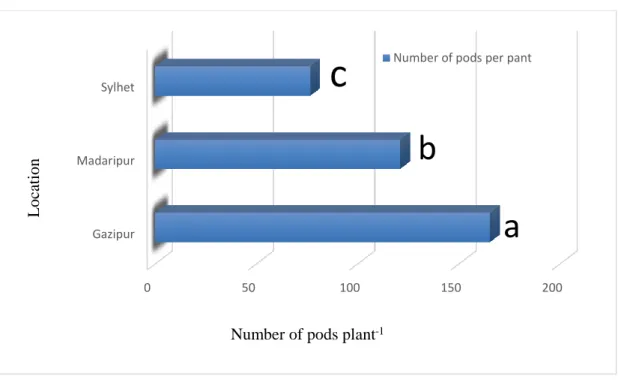
36 5 Effect of location on number of pods plant-1of pigeon pea
(CV -14.906% with LSD(0.05)value- 18.036)
39 6 Effect of genotype on number of seeds pod-1 of pigeon pea
(CV -5.533% with LSD(0.05)value- 0.220)
42 7 Effect of location on hundred seed weight (g) of pigeon pea
(CV -10.036% with LSD(0.05)value- 0.696)
44 8 Effect of genotype on hundred seed weight (g) of pigeon
pea (CV –7.964% with LSD(0.05)value- 0.547)
45 9 Effect of location on yield plant-1 (g) of pigeon pea (CV -
16.103% with LSD(0.05) value- 4.801)
47 10 Effect of location on carbon dioxide sequestration plant-1
(lbs) of pigeon pea (CV –33.979% with LSD(0.05)value- 1.251)
49
11 Effect of location on carbon dioxide sequestration year-1 (lbs) of pigeon pea (CV –33.803% with LSD(0.05) value- 2.483)
51
12 GGE biplot exhibiting four pigeon pea genotypes across three environment for yield performance
53 13 GGE biplot exhibiting four pigeon pea genotypes across
three environment for carbon sequestration
54 14 Ranking of ideal genotype of pigeon pea for yield 55 15 Ranking ideal genotype of pigeon pea for carbon dioxide
sequestration
56 16 GGE-biplot showing the ranking of pigeon pea genotypes
for both mean performance and stability over environments 57 17 GGE-biplot showing the ranking of pigeon pea genotypes
for both mean performance and stability over environments 58 18 The vector view of the GGE-biplot to show relationship
among environments for yield of pigeon pea
59 19 The vector view of the GGE-biplot to show relationship
among environments for carbon sequestration of pigeon pea 60
x
LIST OF PLATES
Plate no. Title of plate Page no.
1 Field visit with respected co-supervisor 86 2 Experimental field visit at BARI, Gazipur 86
3 Monitoring of pigeon pea plant 86 4 Measuring plant height 86
5 Harvested pigeon pea plant 87
6 Measuring plant breadth 87
7 Counting of branches plant-1 87
8 Counting of pods plant-1 87
9 Counting of number of seeds pod-1 (10 pods) 87
10 Pigeon pea plant showing pods 88
11 Packaging of harvested pods 88
12 Field visit at RARS, Sylhet 88 13 Monitoring plant height at RPRS, Sylhet 88 14 Monitoring pigeon pea at RPRS, Madaripur 88
1 CHAPTER 1
INTRODUCTION
Pigeon pea [Cajanus cajan (L.) Millsp.] is one of the major grain legume grown in the tropics and subtropics. It is a minor pulse crop in Bangladesh, mainly grown in the northwestern part of the country (Virmani et al., 1991). It is a perennial shrub that can survive for a period of 3-5 years but it is normally cultivated as an annual crop.
Perennial pigeon pea is receiving considerable attention in India as a multi-purpose species for agroforestry systems. In Agroforestry system there is a high potentiality of pigeon pea to bring under commercial cultivation as a intercrop with tree which is a main component as it provides the three most important services of agroforestry system namely: food, fuel and fodder (3F) along with its diverse benefits. It is the best versatile food legume, span over a wide area of the world with diversified uses and also benchmark with “sustainable agriculture” with enormous existing wild diversity, India is considered to be the “hot spot” and center of origin for pigeon pea (Van der Maesen, 1990). It is well known as finest nitrogen fixer and nutrient re-cycler (Graham and Vance, 2003; Srivastava et al., 2012). Besides its primary use as food, it can also be used as forage, fodder, fuel and medicine. As food, the pods whether consumed as green pea or dry grain consists of 20-22% protein, which plays a vital role in meeting the protein needs of a vegetarian population (Singh et al., 1990, Saxena, 2009). Most parts of Asia and Middle-eastern countries are the major market for good-quality pigeon peas for human consumption.
Pigeon pea is known to produce more nitrogen per unit of plant biomass than most other legumes and can nodulate in most soils although it produces fewer nodules than any other legumes (Onim,1987). The crop is deep-rooted, so their ability to release more phosphates means that valuable nutrients are being brought up from the deeper soil layers. The release of phosphorous benefits not only the crop, but also the subsequent crops grown in the same field (Ae et al., 1990). It is also considered to be tolerant to low and high temperatures. Because of these unique characteristics of pigeon pea, it is recognized as an important crop for subsistence agriculture especially so due to its drought tolerance and ability to recover from the losses caused by various biotic and abiotic stresses. In addition, the leaves of this plant can also be used as food for the
2
silkworm (Duke, 1981) and it can also be a substitute for alfalfa in animal feed formulations. The need to substitute fishmeal in animal feed has necessitated the use of plant derived feed stuffs. Since pigeon pea has strong woody stems that grow up to 4m tall and branch freely, its spindly stalks are extensively used as a cooking fuel in energy short villages of several African countries and in India, Nepal and Sri Lanka. In the lac growing areas of China after harvesting the lac resin, pigeon pea plants are chopped and dried for fuel use. The crop produces about 6 t/ha of fuel wood (Zhenghong and Fuji, 1997). Pigeon pea offers the benefits of improving long-term soil quality and fertility when used as green manure (Onim et al., 1990), cover crop (Bodner et al., 2007) or alley crop (Mapa and Gunasena, 1995).
A major constraint to the adoption of agroforestry systems in the semi-arid tropics is the severe competition between trees and crops for environmental resources.
Pigeon pea can adapt to a wide range of soil types from gravely stones to heavy clay loams of close texture and high moisture content provided there is no standing water on the soil surface or excessive soil salinity. Extensive ground cover of pigeon pea prevents soil erosion, serves as windbreak, hedge, encourages filtration, minimizes sedimentation and smothers weeds. Traditional varieties are highly sensitive to photoperiod (McPherson et al., 1985) and they take about 175 to 280 days to reach maturity.
Fortunately, the loss of Soil organic carbon (SOC) can be slowed down by implementing crop management practices such as conservation tillage (Lal, 2004b;
Puget and Lal, 2005), converting degraded arable land to perennial grassland (Gentile et al., 2005), using diverse rotations, and introducing legume and grass mixtures into the rotation (Lal, 2004c). Therefore, pigeon pea a tall woody shrub with huge branching as a legume crop has the ability to sequester carbon dioxide from atmosphere and plays a great role in stocking carbon in soil.
In Bangladesh, pigeon pea (Arhar) is mostly cultivated in Kushtia, Rangpur, Dinajpur, and Jessore districts. Total acreage of its cultivation is about 5,215 and the annual production is about 1,005 m tons (Banglapedia, 2004). Some short duration lines of pigeon pea were tested in the northern part of the country, but found promising only as intercrop (BARI, 1990). In the southern part of Bangladesh, where winter temperature
3
remains warm enough to support the crop growth, less photosensitive and short duration pigeon pea can be introduced in transplanted aman-fallow cropping system. In the hilly areas of south-eastern part of Bangladesh also, the crop may potentially be grown during the post-rainy season.
Although Bangladesh has suitable land and friendly environment for pulse cultivation, it is heavily imported every year as the domestic production of pulse cannot address the quantity demanded domestically. Considering the above circumstances, pulse production should be increased rapidly to improve the national nutritional status along with less outflow of precious foreign currency. Pulses are in Bangladesh generally called as poor’s men protein. But in these days we cannot fulfill our demand of pulse.
We should give more attention to this protein source as the demand is close to 2 million tons but the country generates only 0.53 million tons comparing with total demand (Razzaque, 2000). Climate change is manifested by unpredictable rainfall patterns, further complicating the plight of farmers. There is a need to identify varieties that are adaptable to these challenges. As pigeon pea can be grown with relative ease and growing it can uplift farmers’ livelihoods especially of it’s wide range of adaptability with low cultivation cost and little management practices which also makes it a good crop for helping farmers adapt to climatic variability and change. If farmers select varieties are adaptable to their region they will plant the right varieties and will bring it under commercial cultivation as a result good yield would translate to better income leading to improved livelihoods. So, there is a need to identify suitable pigeon pea varieties for better yield with good carbon sequestration ability and also for make ensure the improvement of farmer’s livelihoods.
Considering above facts, the study was conducted with the following objectives:
1. To evaluate the yield performance of pigeon pea in three studied areas Gazipur, Sylhet and Madaripur ;
2. To determine the stability performance of different pigeon pea genotypes and 3. To estimate the amount of carbon sequestration by pigeon pea per year in these areas.
4 CHAPTER 2
REVIEW OF LITERATURE
In this chapter, an attempt has been performed to review the information about the morphological and yield performances using GGE biplot technique and carbon dioxide sequestration of pigeon pea genotypes.
2.1 Pigeon pea
Pigeon pea [Cajanus cajan (L.) Millsp.] which is under the genus of Cajanus, subtribe- Cajaninae, tribe haseoleae, order-Fabales, family-Fabaceae and sub-family Faboideae.
Several edible beans like Lablab, Dolichos, Phaseolus, Vigna and Cajanus of tribe Phaseoleae but in the sub-tribe Cajaninae, only one species, Cajanus cajan has been domesticated and cultivated. The species belonging to Cajaninae have peculiar vesicular glands on the leaves, calyx and pods which accumulate a sticky substance on their surface. The Latin name Cajanus cajan came from a Malay word cachang, which was therefore a corrupt form of the Telugu word kandi. The Telugu word has its source of origin in the Sanskrit word kaand (a stem), a reference to the long stem of the pigeon pea plant (Royes, 1976). The name pigeon pea was first reported in Barbados where the seeds were once considered as pigeon feed (Plukenet, 1692).
The term ‘pigeon pea’ was reported in Barbados, where its seeds were considered an important pigeon-feed (Gowda et al., 2011). Pigeon pea or red gram or tur is known by different vernacular names in India viz. Tur (Maharashtra and Gujarat), Arhar (Uttar Pradesh, Bihar, Madhya Pradesh), Aral (West Bengal), Kandi (Andhra Pradesh), Harad (Haryana and some parts of western Uttar Pradesh), Rahat (parts of Bihar), Tuvaraparippu (Kerala), Kokh-lan (tribes of Tripura), adhaki and tuvarika (Sanskrit).
The alternate (Syn.) botanical names of pigeon pea are as follows: Cytisus cajan L.; C.
bicolor DC.; C. flavus DC.; C. indicus Spreng.; C. striatus Bojer (Van der Maesen,1990).
5 2.2 Growth and development of pigeon pea
Pigeon pea is adapted to the tropical and subtropical region and it can be grown on marginal land and low fertilizer input, even under drought condition. The growth habit of pigeon pea is predominantly indeterminate but some genotypes show determinate growth. The branching pattern varies from erect to spreading. Pigeon pea is a predominantly photoperiod sensitive shortday plant and exhibit wide variation in days to flower among genotypes (Gooding, 1962; Spence and Williams, 1972).
Pigeon pea is planted commercially for canning in the Dominican Republic, Trinidad and Puerto Rico while it is mostly grown for home consumption and export in Africa, Kenya, Malawi, Tanzania and Uganda. Elsewhere in the tropics, it is more a crop of kitchen gardens and hedges. In India, the yields are dry seeds while in the Dominican Republic, fresh seeds or pods are the yields (Duke, 1981). Pulses, pigeon pea being one, have a wide adaptability to latitudes, longitudes and climate variables but adaptability of individual species is confined to their areas of origin (Kumar and Bourai, 2012).
There is a need to encourage more growing of adaptable varieties as pigeon pea market is enormous with its demand outstripping supply (Odeny, 2007).
Distribution of pigeon pea is asymmetric over the world. It is grown in different parts of the globe covering more than 22 countries including India, Myanmar, Tanzania, Malawi and Kenya (FAOSTAT, 2013).
In South-East Asia, pigeon pea is mainly cultivated in India, Myanmar, Nepal, Bangladesh and Phillipines. It is widely grown in India where it plays an important role in pulse based cropping systems and occupies second largest area among the pulse crops. Recently this crop has been introduced in China as well where it is planted on the hilly slopes primarily to check soil erosion (Saxena, 2008).
India occupies the largest area (3.5 – 4.0 million hectares) of pigeon pea in the world, contributing nearly 80% area globally. Although pigeon pea is grown in 315 districts of India, 26 districts account for about 50% area (Bhatia et al., 2006). In India, it is a widely cultivated crop covering more than 18 states. About 85% of the pigeon pea is grown in six states namely, Maharashtra, Karnataka, Madhya Pradesh, Andhra Pradesh, Gujarat and Jharkhand. Other states include Uttar Pradesh, Orissa, Tamil Nadu, Bihar
6
and Chattisgarh. To a limited extent, pigeon pea is also grown in Rajasthan, Punjab, Haryana, West Bengal and North-Eastern States.
Although pigeon pea can be grown well on hilly slopes, grass lands, forest lands, degraded lands and ravine areas the cultivated species of pigeon pea does not exist as naturalized population in the wild form in any ecological zone of India. Hence its natural habitat conditions are not known; but it performs on well grassy habitats in tropical, cold free zones with optimum 600-1000 mm annual rainfall. Natural population of various wild species of pigeon pea can be found in Eastern and Western Ghats, North-Eastern states and in forests and hilly areas in almost every state of India (Sardana et al., 2011).
2.3 Scenario of pigeon pea production and marketing in Bangladesh and around the world
Pigeon pea is considered as the second most important pulse crop in India. This country has the largest growing area used for this crop cultivation and is the biggest producer thereof. Other countries though consider this crop as their most important crop, like Puerto Rico, which accounts for about 90% of the total pulse production, Trinidad and Tobago 86% and Malawi 36% while others consider it their second such as Panama, Dominican Republic, Jamaica and Uganda (Saxena et al., 2001).
In Bangladesh, pigeon pea is a multipurpose plant. All the plant parts are used in some form or another. The green pods are used as vegetable and the mature seeds are cooked or boiled and eaten as a pulse. The tops of the plant and its fruits provide excellent fodder and are also made into hay and silage. A majority of the people use the pigeon pea after de-husking and splitting of cotyledons to make dal. The husk and pod walls are used as cattle feed. Rural families use the stems as fuel. The dried stalks are used as firewood and for thatching and making baskets. Pigeon pea is also used to rear silkworm and lac insects (Amiruzzaman and Shahjahan, 2000).
Roy et al. (1996) evaluated 23 genotypes of variable maturity duration to explore the potentiality of fitting pigeon pea in rice-fallow cropping pattern and found some genotypes well adapted in fallow period although the yields were not satisfactory.
Therefore, the potential pigeon pea variety or cultivar selected for growing under such conditions should be of short duration with high yield potential.
7
In Asia, particularly in India, dal is the dominant form in which pigeon pea is sold to consumers. In India, considered as the world’s largest producer of pigeon pea, the annual demand of this crop is always in the shortfall due to the growing population, rise in income and shift of consumer preferences towards high-value products such as processed pulses, combined with the long-term stagnation in domestic production.
Pigeon pea is sold directly by farmers in rural markets to middlemen or to local dal millers (Von Oppen, 1981).
Market shortfalls are met by imports from Africa, Nepal and Myanmar. In Myanmar, the consumption of pigeon pea is preferred by people of Indian and Nepalese descent (Nene et al., 1990).
Asia dominated the world production of pigeon pea between 1961-2006 with as much as 90.64% in 2000 and 89.88% in 2006 compared to the other regions. The data gathered since 1961 showing Asia cornering the production of pigeon pea by an average of 91%. Globally, the production was not sufficient to meet the needs of the consumers due to a mismatch in population and production growth in spite of the increase in area.
(Mula and Saxena, 2010).
In Africa, pigeon pea marketing is widespread throughout the region with varying degrees of integration into commercial channels. About estimated 65% of regional pigeon pea production is consumed by the farmers themselves. These are consistent with micro-level observation of on-farm consumption, retention of seed for planting and pigeon pea exchanges at community level (Muwalo et al., 1999).
Around 10% of production in Kenya, Malawi and Tanzania are traded in domestic markets. Domestic markets in Tanzania are smaller than in Kenya, particularly for the green and processed forms. Thirty-five percent (35%) of the total production are consumed on farm (Monaco, 2003).
In the Americas and Caribbean, about 8% of the households take dried pigeon peas, especially in areas where there is a concentration of ethnic Indian population while in Trinidad and Guyana, 26% consume green pigeon pea as vegetable. About 60% of the produce is processed into canned pigeon pea, 15% sold as mature, green, fresh peas and the remaining quantities in frozen form (Nene et al., 1990).
8
The FAOSTAT (2008) reported that Dominican Republic and Malawi were continuously engaged in exporting pigeon peas from 1961 to 2009. The accumulated export in the 20s has substantially expanded owing to the aggressiveness of Myanmar in exporting its pigeon peas around the world. A total of 888,927 t with a value of
$390.611 M were exported with the bulk of the export of 887,793 t coming from Myanmar. The three-year aggregate of exported pigeon pea from 1961 to 2009. The period 2006–2008 showed an upsurge in export of pigeon pea with a total quantity of 589,345 t and with a street value of $291,236,278.80.
According to Joshi et al. (2001), besides Myanmar, African countries like Kenya and Tanzania are also important exporters for the last 10-15 years. But the exports made by these two countries were not recorded in the statistics data of FAO. Globally 4.33 million tonnes (mt) of pigeon pea was produced. India alone contributed 2.65 mt followed by Myanmar (0.9 mt), Tanzania (0.3 mt), Malawi (0.24 mt), Kenya (0.09 mt) and Uganda (0.084 mt) (FAOSTAT, 2012). The area and production of pigeon pea for last 6 years in India.
Most countries still do not report statistically their pigeon pea production. Global production trend has had its highs and lows from 1961 to 2005. From 1961 to 1980, pigeon pea production decreased from 2,227,955 t to 1,965,319 t. From 1980 to 1990, production increased to 3,100,287 t then dropped to 2,585,243 t in 1995. Since 1995, the production trend was upward with recorded increase of 3,204,187 tons in 2000, 3,428,166 t and 3,458,166 t in 2006 (FAOSTAT, 2008).
In Bangladesh, Arhar is mostly cultivated in Kushtia, Rangpur, Dinajpur, and Jessore districts. Total acreage of its cultivation is about 5,215 and the annual production is about 1,005 m tons (Banglapedia, 2014).
According to BBS (2018) the total area and production of other pulses like Gari Kalai, Khesari, Maskhali, Mung, Motor, Masur, Arhar, Gram were estimated at 363,182.5 ha and 473497 mt. respectively; of which cowpea contributed with notable number; which brings a total area of 32,000 hectors under cowpea production; the recorded amount of production is 35,000 tons in total.
9 2.4 Socio-economic importance of pigeon pea
The perennial nature of pigeon pea permits farmers to take multiple harvests with surpluses dealed in both local and international markets. This is partly due to the possible wide range of phenological development, which is influenced by photoperiod and temperature, and response to these factors conducts the ecophysiological adaptation of pigeon pea, from photoperiod sensitive genotypes grown as perennial crop (more than 11 months), long-season (9-11 months), mid-season (6 to 8 months) crops, to short-season (3 to 5 months) crops (Wallis et al., 1988).
The tall and erect pigeon pea varieties are known to provide not only nutritious food, feed and fodder but also provide fuel wood for the rural people, thus it is very popular among small and marginal farmers. The dry sticks of pigeon pea plant are used for making baskets, thatches and storage bins also. In addition to atmospheric nitrogen fixation through root nodulation by a wide range of symbiotic Rhizobia strains (Chikowo et al., 2004), the defoliated leaves also add nitrogen and organic matter to the soil.
Equally important is the optimum utilization of pigeon pea meal in fish production.
According to Ogunji et al. (2005), soaking of pigeon pea seeds for 16 hours enhanced best the fish weight gain and haematological values of African catfish.
The present high cost of animal sourced protein in feeds makes pigeon pea ideal as a good plant protein substitute as it is less expensive. Singh and Eggum (1984) and Springhall et al. (1974) reported that pigeon pea meal (21% crude protein, 9.2% crude fiber) could be included at levels of up to 30% in broiler chick diets with no significant depression in live weight gains. George and Elliott (1986) stated that raw pigeon pea seeds can be included at rates of up to 400 g/kg in a commercial layer diet without affecting egg production performance and health and feed intake of the birds. They suggested that raw, ground pigeon pea can be a valuable energy and protein source in poultry diets and can be included at rates of up to 450 g/kg of the dietary dry matter without adversely affecting the health and productivity of the bird.
Leaf fall at maturity adds to the organic matter in the soil and provides additional nitrogen. The root system is reported to break plough pans, thus improving soil structure, encouraging infiltration, minimizing sedimentation and smothering weeds.
10
The crop nodulates with wide ranges of Rhizobium and consistently fixes 20 to 140 kgs ha of N in fertile soil (Anderson et al., 2001).
Pigeon pea has been used successfully in coffee plantations as a cover crop to improve soil properties, reduce weed competition as well as act as a food source for predators (Venzon et al., 2006). Moreover, in the low mountain range of China, the farmers cultivate pigeon pea on wastelands and field bunds providing relief from the energy shortage and likewise help in arresting deforestation. The quality of fuel wood has been estimated to be excellent yielding energy at the rate of 4,350 K Cal/kg (Yude et al., 1993).
The pigeon pea is well balanced nutritionally and an excellent source of protein whether consumed as a green pea or as dried grain (Faris and Singh, 1990). In addition to protein, pigeon pea provides carbohydrates and 5-fold higher levels of Vitamin A and C (Faris et al., 1987).
Pigeon pea is also a good source of vitamin A and vitamin B complex. Cattle do not relish the forage in the immature stage. Grazing should be deferred to the early green- pod stage (Hosaka and Ripperton, 1944) and in some cases mature plants may cause irritation of the rumen of cattle (Stanton, 1966).
Pigeon pea stems are used in fencing crop fields and livestock and weaving crlbs and baskets. The wood is used in light construction such as roofing, thatch, wattling on carts, tubular wickerwork lining for wells, shelter for barns, huts and other crafts from branches and stems (Morton, 1976 and Van der Maesen, 1989).
Tall perennial pigeon pea is often used as live fences in homesteads of farmers of Africa and the Caribbean (Phatak et al., 1993). In Southeast Asia, pigeon pea is grown as a support for vanilla while in China; pigeon pea is also grown along highways on river banks, mountain, and slopes as substrate for mushroom production.
In some experimentation, pigeon pea has been found to produce a pulp for paper similar to that of hardwoods, which might be suitable for making good quality writing and printing material. In addition, the plant has been observed to be a good source for apiculture. The nectar collected by honeybees produce honey that has a distinctive greenish hue in the comb (World Agroforestry Centre).
11
In China, Jianyun and Yun (1998) conducted experiment on the processing technology of plywood bond using pigeon pea glue. The results showed that the bond strength of the plywood was 1.28-1.92 Mpa, which parameters meet the National Standards and it was higher than that of soybean glue (Glycine max). The pigeon pea glue processing technology is relatively simpler and economical.
2.5 Intercropping
Pigeon pea is a good alternative crop with low fertilizer requirements and with minimum pesticide use. Due to its hardiness, ability to grow on residual soil moisture, and slow early growth, pigeon pea is an ideal, non-competitive crop to plant with cereals. In traditional cropping systems, throughout the world, pigeon pea is mostly cultivated as secondary or mixed with other crops (Aiyer, 1949; Acland, 1971; Osiru and Kibira, 1981).
High input system in rice growing areas, which has begun showing signs of instability, could become more sustainable with the inclusion of pigeon pea into the rotation by providing farmers with an alternative to rice during periods of water scarcity, price incentives, and problems of soil fertility. It gives additional yield after the first harvest if sufficient moisture is available (ratooning), and it has great flexibility in a wide range of cropping systems. Pigeon pea is a superb intercrop and a non-competitive crop to grow with food crops (cereals, etc), cash crops and other plantation crops. Willey et al.
(1981) have stated that intercropping systems of pigeon pea have not significantly affected the yields of other crops compared to when the crop is planted as a sole crop.
In addition, up to 70% of the yield of pigeon pea alone can also be obtained.
Pigeon pea is alternately planted in rows with rows of wheat (Triticum aestivum L.), chickpea (Cicer arietinum L.), sorghum (Sorghum bicolor), groundnut (Arachis hypogaea L.), sesame (Sesamum indicum), cotton (Gossypium spp.) , pineapple (Ananas comosus), pearl millets (Pennisetum glaucum), maize (Zea mays) and in between plantation crops like coconut (Cocos nucifera L.), banana (Musa species), mango (Mangifera indica L.),and citrus (Citrus spp) (Ali and Kumar, 2000; Sekhon et al.,1992).
Intercropping of cereals and legumes is a better means of utilizing resources such as light, water and nitrogen. Understanding of how efficiently these three resources are
12
utilized in maize-pigeon pea intercrop system is important to achieve higher productivity. An experiment was conducted at Jomo Kenyatta University of Agriculture and Technology between October 2001 and June 2002 to determine light and water use in maize-pigeon pea intercrop system. Results showed that temporal complimentarily in maize-pigeon pea intercrop reduced competition for light between the two crops hence maize yields were unaffected. Temporal differences in root growth ensured full use of water during the growing season and spatial use of water below the ground could be better by a combination of shallow and deep rooting components in an intercrop system (Wanderi et al.,2006)
One hundred germplasm lines were evaluated by (Hamid et al., 2011) for variation in morphological and agronomic traits for selection of cultivar potentially convenient for growing in Bangladesh under rice-based cropping systems during the fallow period after kharif II season. A wide range of disparity was found in twelve quantitative plant traits. The most important correlations corresponded to eight plant traits. Considering these traits, PCA could explain 76.2% of total variance. Pods plant-1 played the most dominant role in explaining the highest variance according to DFA. Genotypes grouped in 1, 4 and 7 clusters were early maturing and high yielder as compared to the other cluster members. Genotype 21 (ICP7143) representing group 1 showed promising for its short stature nature. However, genotype 32 (ICP 7989) representing group 4 produced the maximum yield with the shortest maturity duration.
2.6 Importance of legume
Being a deep rooted legume, pigeon pea also improves the physical condition of the soil for the next crop. Krause (1932) considered pigeon pea for soil binding and advocated its plantation in Hawaii Island for checking soil erosion.
Herridge et al. (2008) used data on yields and areas of legumes and cereals from FAO (FAOSTAT) to generate global estimates of legume-fixed N per year. These were calculated as 29.5 Tg for pulses and 18.5 Tg for oilseeds. There are no available statistics with respect to the areas and yields of forage, fodder and green manure legumes on a global basis. This is a major gap in our knowledge and thus estimates with respect to these crops have much greater uncertainty attached.
13
Herridge et al. (2008) also gave broad calculations of 12–25 Tg N fixed per year from pasture and fodder legumes. Tropical legumes fix as much N as temperate ones, e.g.
575 kg/ha/year for a pure stand of Leucaena leucocephala, and there is greater C storage in legume-based tropical pastures than grass only.
Zhang et al. (2009) showed that conversion of reed meadows to alfalfa fields, in response to increased demand for forage for livestock systems in China, could result in increased levels of SOC.
Fornara et al. (2009) showed that the presence of legumes and non leguminous forbs and in particular their greater fine root decomposition led to enhanced root N release and increased net soil N mineralization compared with grass only swards. The authors stated that fine roots (less than 2 mm diameter) constitute a large fraction of annual primary productivity in many terrestrial ecosystems and have a significant influence on N and C cycling.
Cadisch et al. (1998) emphasized the role of legumes in building up soil organic matter (SOM) and considered that the importance of this in tropical soils may be as great as N supply. Again, persistence was highlighted as the key to realizing the benefits from legume stands.
2.7 Carbon sequestration from different plant
Lynch et al. (2005) conducted a study using simulation and spreadsheet analysis, considered changes in soil C sequestration in responses to alterations in grazing, fertilization and seeding of grasses and legumes. They stated that some treatments, e.g.
seeding of grasses and legumes combined with continuous grazing, could result in increased soil organic carbon (SOC) of pastures but that this did not translate into improved net returns.
A research was conducted by Mortenson and Schuman (2004) in northwestern South Dakota to evaluate the role of inter seeding a legume, Medicago sativa ssp. falcata, in northern mixed-grass rangelands on carbon sequestration. Sampling was undertaken on a chrono sequence of sites interseeded in 1998, 1987, and 1965 as well as immediately adjacent untreated native rangeland sites. Soil organic carbon exhibited an increase of 4% in the 1998, 8% in the 1987, and 17% in the 1965 interseeding dates compared to their respective native untreated rangeland sites. Nitrogen fixation by the legume led to
14
significant increases in total soil nitrogen and increased forage production in the interseeded treatments. Increases in organic carbon mass in this rangeland ecosystem can be attributed to the increase in soil organic carbon storage and the increased aboveground biomass resulting from the increased nitrogen in the ecosystem.
The carbon fixation or carbon concentration estimated in certain trees and shrubs indicated that there are certain tree species with high ability to fix atmospheric carbondioxide into their biomass. The trees and shrubs selected with high carbon concentration were Eugenia caryophyllata 51.66%, Litsea glauscensens 51.34 %, Rhus virens 50.35%, Forestiera angustifolia 49.47%, Gochantia hypoleuca 49.86%, Forestiera angustifolia 49.47%, Pinus arizonica 49.32%, Cinnamomum verum 49.34%, Bumelia celastrina 49.25%, Tecoma stans 48.79%, Acacia rigidula 48.23%, Eryobotria japonica 47.98 %, Rosamarinus officinalis 47.77%. Few of these species may be selected for plantation in highly carbon dioxide polluted areas in cities, road sides and factory areas with high emisssion of carbon dioxide (Maiti et al., 2015).
Wang et al. (2013) studied variability of Larix olgensis in different organs in North- Eastern China. The results showed that the weighted mean carbon concentration by biomass was approximately 48.15%. In this study, the carbon concentration of aboveground tree organs is ranked with descending order as living branch> bark>
foliage>dead branch>stem; and in the belowground, it is ranked as large roots>
stumps>thick roots>medium roots>small roots. The carbon concentration differed significantly between tree organs, while there was no significant difference between trees with different ages
With respect to the role of plants in capturing CO2, Jiménez Pérez et al. (2013), investigated carbon concentration in pine-oak forest species of the Sierra Madre Oriental. The components of the above-ground biomass considered were stem, branches, bark and leaves of the species Pinus pseudostrobus, Juniperus flaccida, Quercus laceyi, Quercus rysophyla, Quercus canbyi and Arbutus xalapens. The species with the highest carbon concentration was Juniperus flaccida(51.18%), while Q.
rysophylla had the lowest (47.98%). Among the different components of the tree the component i.e., leaves of Arbutus xalapensis (55.05%) had the highest carbon concentration. There were highly significant differences between the various components by species group; the highest concentration was found in the bark of
15
conifers (51.91%), compared to the bark of the broadleaf species, which had the lowest (45.75%).
Enhancing C sequestration by increasing forested land areas has been suggested as an effective measure to lower atmospheric carbon dioxide (CO2) concentration contributing towards the prevention of global warming (Watson, 2000).
Nevertheless, conservation of forests having large amounts of C stocks is also a valuable way to reduce CO 2 emissions which is more beneficial than reforestation in the short run (Sharma et al. 2010).
It is imperative to improve understanding of the processes regulating C sequestration in order to manage landscapes, maximizing their potential to store C in the future (Jones and Donnelly 2004) and plan policies to mitigate desertification, especially in arid and semiarid lands (Iglesias et al. 2012).
The Mediterranean forests and shrublands are heavily utilized by man (Boix-Fayos et al., 2009) with a possible increase in the near future of degraded areas due to coastal urbanization, landscape fragentation, overgrazing and excessive wildfires (Wessel et al., 2004; Boix-Fayos et al.,2009).
Cannell and Milne (1995) reported the amounts of carbon in different vegetation types and tree species. About 80 per cent of the carbon in British vegetation is in forests and woodlands (92 MtC) although occupying only 11.2 per cent of the rural land area.
Broadleaved woodland alone accounts for 47 per cent of the total of 114 MtC because those woodlands are older and contain, on average, 62 tC ha –1 compared with 21 tC ha –1 in conifer forests. Conifers cover 6.1 per cent of the land area, compared with 4.1 per cent by broadleaved woodlands, but contain only 25.3 per cent of the total of 114 MtC.
2.8 Pigeon pea yield
According to Parbery (1967), the unfertilized pigeon pea which is grown for 372 days has yielded 25.45 t/ha of dry matter while 37.96 t/ha was harvested when fertilized with 100 kg N/ha on Cunnunurra clay and 1,071 kg/ha was produced on unfertilized pigeon pea on Cockatoo sand in the Kimberley district of northern Australia. It was also revealed that 100 kg N/ha depressed the crop yield on Cockatoo sand.
16
A study was conducted to investigate the highest pod yielding percentage of wild and cultivated genotypes of pigeon pea (Cajanus cajan) on the basis of intensity of raceme and flower production, pod production and floral abscission. Results showed that total number of racemes and flowers plant-1 varied between 84.66 to 140.11 and 707.67 to 1564.70 respectively. Total number of pods plant-1 and the reproductive unit existed between 90.80 to 165.30 and 1721.79 to 2753.98 among the wild and cultivated genotypes. (Rahman et al., 2011).
2.9 Low yield of Pigeon pea
Pigeon pea has not achieved its production potential largely due to limited use of appropriate inputs and crop management practices (Smith et al. 2001).
The low productivity is a major barrier in improving trade forecast. Under small-scale management, yields of local pigeon pea varieties have been found to be significantly lower at 350kg/ha of usable seed weight and inconsistent across areas and seasons (Ritchie et al.,2000).
Global yield mainly reflects the situation in Asia especially India, the major producing country, where yields are low at 700 kg/ha (Saxena, 2009). The low productivity was attributed to the following factors, particularly, the crop’s low status in the cropping system, its being often relegated to marginal soils, its intercrop with cereals and cotton, its receipt of little or no inputs, and the fact that it attracts much of farmers’ crop management attention (Troedson et al., 1990, Müller et al.,1990). However, the lack of high yielding cultivars appears to be the major factor for its low productivity (Saxena, 2009).
2.10 Constraints of pulse production in Bangladesh
Among the biotic stresses diseases, pests, seed dormancy and weeds are the main ones.
So far 126 diseases have been recorded in these crops of which botrytis gray mold, Fusarium wilt and collar rot in chickpea; foot rot, stemphylium blight and rust in lentil;
powdery mildew and downy mildew in lathyrus; yellow mosaic virus, cercospora leaf spot and powdery mildew in blackgram and mungbean (Talukder, 1974; Fakir and Rahman, 1977; Fakir, 1986; Fakir and Rahman, 1991; and Rashid et al., 2007).
17
Among the 30 insect pests, Helicoverpa armigera of chickpea and blackgram;
Diacrisia obliqua of blackgram, mungbean and groundnut; Aphids of lentil, lathyrus and mungbean; Euchrysops cnejus, Monolepta signata, Bemisia tabaci of mungbean and blackgram are the major pests (Rahman et al., 1982). Among the storage pests Callosobruchus chinensis and C. maculates are important. Weeds are very common problem in all legume crops (Rahman et al., 1982).
Among the abiotic constraints, drought causes severe yield reduction. Excess rain and high humidity usually favour vegetative growth but also encourage diseases and pests infestation causing yield reduction. Terminal heat stress, excess rainfall and soil inundation due to tidal flood also cause substantial yield loss or crop failure. In some areas micronutrient deficiency, soil salinity and soil acidity limit pulse production.
(Rashid et al., 2007).
Socio-economic constraints like low profit, instability in market price, lack of credit that prohibit adopting improved production technologies that leads to poor yields (Rashid et al., 2007).
2.11 GGE-biplot technique
The plant breeding community’s aim is to conduct multi-environmental trials on different genotypes, to identify the most superior genotype for wide or specific cultivated zones based on yield and stability. Growing genotypes in diverse environments can be used as a tool to identify high yielding and most stable genotypes (Luquez et al., 2002; Fan et al., 2007).
Seed yield, an economically important trait and quantitative in nature, routinely exhibits genotype environment interactions (GEI), which necessitates genotypes ×evaluation in multi-environment trials (MET) at advanced stages of selection (Annicchiarico 2002;
Kang et al., 2004).
Estimation of stability performance becomes an important tool to identify consistently high-yielding genotypes (Kang, 1998). Graphical display of different genotypes for desirable parameters and traits of interest is helpful, easily understandable and even attractive with less hesitation (Yan 2001; Ullah et al., 2007, 2011).
18
G ×E interaction cannot be avoided, as it is an important limiting factor for testing the efficiency of any breeding program. GGE biplot refers to the genotype main effect (G) and the genotype×environment interaction (GE), which has two sources of variation that are relevant to genotype evaluation. It can be used to identify superior genotypes and target environments that make possible the identification of such genotypes (Gwanama et al., 2000; Fan et al., 2007).
GEI are often described as inconsistent variation among genotypes across different environments. Furthermore, lack of consistency in performance across environments complicates genotype selection, which could generate useful information for researchers (Busey 1983; Kang 1998; Fan et al., 2007).
Genotype × Environment interaction (GEI) is an important aspect of plant breeding programs. It may arise when certain genotypes are grown in diverse set of environments. A significant G × E interaction for a quantitative trait such as seed yield can seriously limit the efforts on selecting superior genotypes for both new crop production and improved cultivar development (Kang and Gorman, 1989).
The GGE biplot also has a usage in selecting superior cultivars and test environments for a given mega-environment. Provided the genotypic PC1 scores have a near-perfect correlation with the genotype main effects, ideal cultivars should have a large PC1 score (high yielding ability) and a small (absolute) PC2 score (high stability). Similarly, ideal test environments should have a large PC1 score (more discriminating of the genotypes in terms of the genotypic main effect) and small (absolute) PC2 score (more representative of the overall environment) (Yan, 1999; Yan et al., 2000).
Many stability statistics have been used to determine whether or not cultivars evaluated in MET are stable. Because the most stable genotype(s) may not be the highest yielding, the use of methods that integrate yield performance and stability to select superior genotypes becomes important (Kang, 1988; Pham and Kang, 1988;
Kang and Pham, 1991; Kang, 1993; Kang and Magari, 1996).
More recently, GGE biplots which show both genotypes and environments as based on Site Regression (SREG) model have been advocated to describe GEI pattern (Yan and Tinker, 2006; Yan et al., 2007).
19
GGE biplot captures both genotype main effects and genotype × environment interaction effects, which are two important sources of variations relevant to genotype evaluation (Yan and Hunt, 2001).
Phenotypes are a mixture of genotype (G) and environment (E) components and the interactions (G×E) between them. G×E interactions complicate the process of selecting genotypes with superior performance. Consequently, multi-environment trials are widely used by plant breeders to evaluate the relative performance of genotypes for target environments (Delacy et al., 1996).
The grain yield measured for a cultivar in a given environment is obtained due to the effect of genotype (G), environment (E) and the G × E interaction (Yan and Kang, 2003).
The progress of a breeding program is therefore limited due to the G × E interaction, especially where genotypes are selected in one environment and used in another (Kearsey and Poony, 1998; Giauffret et al., 2000).
GEI are often described as inconsistent differences among genotypes across different environments. GEI in multi-location trials complicates the identification of superior genotypes for a single location, because of the larger magnitudes of genotype-by- location interactions than genotype-by-year interactions (Badu et al., 2003).
2.12 Application of GGE-biplot technique on some crop
Pagi et al. (2017) conducted an experiment in western India with fifty six pigeon pea genotypes comprising fourteen parents, forty hybrids and two standard checks were evaluated at four environments during kharif season of 2013 and 2014. A significant difference was obtained for yield and yield contributing characters among genotypes in individual as well as pooled environments except for pod length, 100 seed weight and seed protein content (%). For traits like days to maturity, plant height, pods per plant, pod clusters per plant, seeds per pod, 100 seed weight and seed yield per plant Genotypes × Environments (linear) values were significant when tested against pooled deviation.
Kamau (2013) conducted an experiment in Eastern and Southern Africa on medium duration pigeon pea was analyzed for genotype performance. Different stability
20
parameters gave different genotype rankings. Eberhart and Russell model ranked genotypes ICEAP 00550 as the most stable genotypes, AMMI model ranked ICP 6927 as the most stable genotype while ICEAP 00068 was ranked as the most stable genotype by GGE biplot. Considering ranking by the three models the three most stable genotypes were found to be ICEAP 00550, ICP 12734 and ICP 6927.
An experiment was conducted in five pulse growing regions of Bangladesh viz. Ishurdi, Gazipur, Jessore, Barisal and Madaripur during the year 2013-14. Significant differences were observed for all the tested genotypes against days to flowering, days to maturity, plant height, pods plant-1 and 100 seeds weight among the environments except Gazipur and Madaripur. BARI Chickpea-5, BCX 06004-10 and BARI Chickpea-9 took lowest mean minimum days (70) to flower but BCX 06004-10 got maturity (124 days) earlier than the others. BCX 06004-10 was the tallest one and BARI Chickpea-5 was the dwarf one. Highest mean of pods plant-1 was obtained from BARI Chickpea-5 followed by BARIChickpea-9 and BCX 06004-10. The entry BCX 06004- 10 was the highest yielder genotype while BCX 06001-11 showed moderate stability across the environments. (Rahman et al., 2016).
Rahman et al. (2017) conducted an experiment at Pulses Research Centre, Ishwardi, Pabna, Regional Agricultural Research Station Jessore and Jamalpur, Regianal Pulse Research Station, Madaripur, Onfarm Research Division, Barind, Rajshahi and Pulses Research Sub Centre, Gazipur during kharif-II, 2015 to find out desirable lines of Blackgram. The genotypes 86337 gave highest average yield (1206 kg ha-1) among the genotypes followed by BBLX-06002-10(1089 kg ha-1) and BBLX-07002-5 (1076 kg ha-1). It also produced highest seed yield in Joydebpur (1334 kg ha-1) across the locations. Out of six locations 86337 genotypes produced a good yield (1206 kg ha-1) on the other hand, the lowest average yield was obtained from the genotypes BBLX- 07002-1 (1043 kg ha-1).
The study was carried out in 13 villages under three Upazila’s namely Hathazari, Fatikchari and Satkania of Chattogram District, Bangladesh during 2017-2018 covering 210 farmers in the selected locations. Results revealed that the rate of adoption of cowpea (BARI Cowpea-1) was found to be higher (71%) than that of the local and mixed varieties. The highest number of the respondents came to know about BARI
21
Cowpea-1 from DAE (58.6%) followed by seed dealers (31.7%), research stations (19.0%) and NGO’s (17.0%) (Uddin et al., 2020).
Farshadfar (2013) carried out an experiment of 20 chickpea genotypes under two different rainfed and irrigated environments for four consecutive growing seasons (2008–2011) in the Campus of Agriculture and Natural Resources of Razi University, Kermanshah, Iran. The estimated results showed that genotypes G3, G16 and G10 were highly stable with high grain yield.
An experiment was done among 20 genotypes of chickpea under two different environmental conditions of Pakistan (karak and Peshawar) during 2007 to 2008.
Results showed that genotypes at Karak produced significantly greater seed yield than at Peshawar. GGE biplot analysis ranked genotypes on above average seed yield across environments as Lo-3, Lo-2, Pk-2, Lo-4 and Pk-3 as top five genotypes, while the bottom five genotypes were identified as Sy-7, Pk-1, Sy-4, Sy-5 and Pk-5. For stability of performance across environments, Pk-4, In and Pk-3 were identified as most stable genotypes followed by Lo-2, Pk-2, Pk-3 and Lo-3. On the basis of both stable performance and mean seed yield across environment, the GGE biplot ranked genotypes Lo-3 as the best among all, followed by Lo-2, Pk-2, Pk-3 and Lo-4, while the rest of the genotypes were identified as inferior. Karak was identified as representative environment as compared to Peshawar. (Hamayoon et al., 2010)
The experiment was done to explore the effect of genotype; and genotype × environment interaction; on grain yield of mungbean genotypes using GGE (genotype plus genotype by environment) biplots. Based on both grain yield and stability performance NFM113 ranked 1st, followed by NFM713, NFM126 and NM98. In contrast, the worst performing genotypes were NFM145 and NFM 147. Based on discrimination and representation, PR07 was identified as the ideal environment for mungbean genotypes. GGE biplot analysis indicated that genotype NFM113 could be used for cultivation in the plains areas of Peshawar and surroundings of Shabqadar, whereas, genotype NFM713 was site specific but might be used in the upper areas of Swat for general cultivation. (Ullah et al., 2011).