National Conference in Mechanical Engineering Research and Postgraduate Studies (2ndNCMER 2010) 3-4 December 2010, Faculty of Mechanical Engineering, UMP Pekan, Kuantan, Pahang, Malaysia; pp. 755-761 ISBN: 978-967-0120-04-1; Editors: M.M. Rahman, M.Y. Taib, A.R. Ismail, A.R. Yusoff, and M.A.M. Romlay ©Universiti Malaysia Pahang
THERMAL COMFORT IN TECHNICAL SCHOOL: PHYSICAL MEASUREMENT APPROACH
N.K. Makhtar1, A.R. Ismail2, N. Jusoh3and A.P. Puvanasvaran4
1Department of Mechanical and Manufacturing Engineering
Faculty of Engineering, Universiti Putra Malaysia 43400 Serdang, Selangor, Malaysia
Email: [email protected] 2
Faculty of Mechanical Engineering, Universiti Malaysia Pahang 22600 Pekan, Pahang, Malaysia
3
Department of Mechanical and Material Engineering
Faculty of Engineering and Build Environment, Universiti Kebangsaan Malaysia 43600 UKM Bangi, Selangor, Malaysia
4Faculty of Manufacturing Engineering
Universiti Teknikal Malaysia Melaka (UTeM) Ayer Keroh, 75450 Melaka, Malaysia
ABSRACT
A field study on the relationship between thermal comfort and students’ performance was carried out in a technical school in Selangor. The buildings were mechanically ventilated by fans. The measured environmental parameters were air temperature (ºC), mean radiant temperature (ºC), relative humidity (%) and air velocity (m/s) of the surrounding classroom area. The environmental factors were measured using Thermal Comfort Equipment, which is capable to measure simultaneously all the environmental factors. All the windows were left open for natural ventilation. Subjective measurements were also conducted using survey questionnaire on the same days when the environmental factors were measured. The Predicted Mean Vote (PMV) was calculated using ASHRAE Thermal sensation scale which has been proposed earlier by Fanger (1970) for the measured data. Further Predicted Percentage Dissatisfied (PPD) was used to estimate the thermal comfort satisfaction of the occupant. The study revealed that 70% of the students’ population at the classroom is dissatisfied with the thermal comfort.
Keywords: Thermal comfort, school, PMV, PPD
INTRODUCTION
improve school performance by 14.5% while reducing the temperature by 1 _C would improve it by 3.5%. In addition, an ongoing study on ventilation rates in schools aims to determine the effect of indoor air quality on pupils’ performance by monitoring nine schools in Southern England (Clements et al., 2008). The preliminary results of this study based on eight different primary school buildings strengthen the evidence that improved ventilation has beneficial effects on pupils’ learning performance and that without intervention the existing ventilation rates remain below the minimum recommended levels (Bako et al., 2007). The provision of adequate ventilation is likely to become more difficult with the introduction of carbon reduction strategies in school buildings (i.e. increased air tightness). The present study measured thermal comfort and student performance in technical school. The study also tried to identify the students’ performance due to the environmental condition in a classroom.
METHODOLOGY
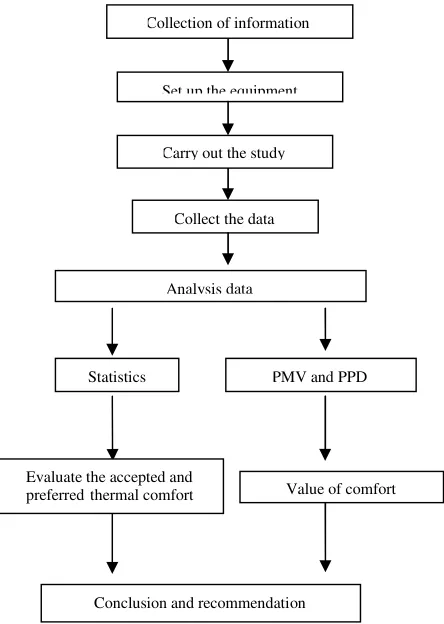
The field study was conducted at a selected technical school in Malaysia. Built in 2004, the school occupies a land area of 45 acre. The school is surrounded by oil palm and rubber plantations. Academic and management block are the classroom blocks, each of which is three-storey high. Every storey has 9 classrooms with total of 36 classrooms in that academic block. The classroom blocks are oriented such that their longer facades face the north and the south. The orientation of the classroom is an important consideration when assessing the suitability of the school for this field study. This study was conducted in eight level namely problem definition, data collection, measurement equipment coordination, study implementation, data collection, data, decision and conclusion analysis. The brief description is as in Figure 1.
Figure 1: Flow chart of methodology in the study Set up the equipment
Carry out the study
Analysis data
Statistics
Collect the data
PMV and PPD
Evaluate the accepted and preferred thermal comfort among the students
Value of comfort
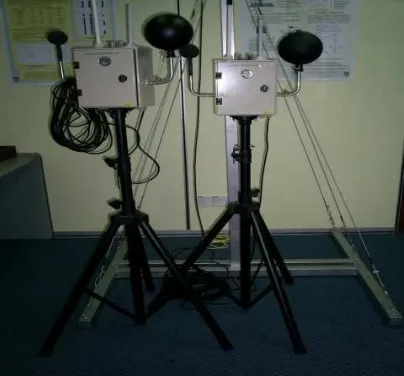
An objective physical measurement was performed at the centre points of the classroom. Figure 2 shows the approximate locations (x) of the sampling points. The environmental factors such as indoor air temperature, relative humidity and air velocity were measured using Thermal Comfort Equipment as presented in Figure 3. Measurements were carried out with the sensors at a height of 2 m, which corresponds to the height recommended in ISO 7726-1985 (Thermal environments – instruments and methods for measuring thermal comfort) for head level for a sedentary occupant. While measuring the environmental parameters, the two personal parameters, metabolic rate and clothing insulation are estimate in accordance with ASHRAE Standard 55–92.
Figure 2: Sampling locations for physical objectives measurement in the classrooms.
Figure 3: Thermal comfort equipment use for the study
RESULTS AND DISCUSSION
checklist according to ISO 7730. Generally, the female respondent has a slightly higher insulation value than the male respondents.
Figure 4: Relative humidity, wind speed, temperature and mean radiant temperature measured in the classroom on the first day of measurement
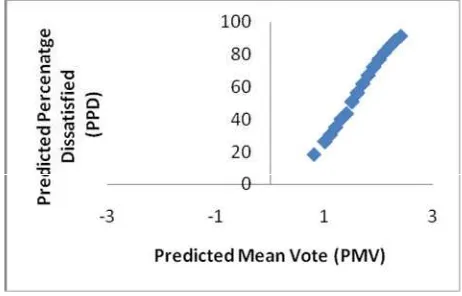
Starting with values of around 82% relative humidity, the tendency is decreasing. The relative humidity level decreasing as the temperature in the classroom starts to increases. The humidity decreases to 44% due to the dry weather. What was interesting is the humidity pattern of fluctuation decrease to humidity. By refering to the ISO 7730, a statistical summary of overall thermal comfort indices is presented in Figure 4. The day measurement started sunny and dry. However, the influence of the outside environment is stronger. Figure 5 shows Predicted percentage of dissatisfied (PPD) as a function of predicted mean vote (PMV). The result illustrated the station PMV index in the morning was 0.8 and after lesson PMV was slightly increased to 2.3, indicating slightly warm and almost warm. Meanwhile, the PPD is around 18% to 88%.
Figure 5: Predicted percentage of dissatisfied (PPD) as a function of predicted mean vote (PMV) in the classroom on the first day of measurement
Figure 6: Relative humidity, wind speed, temperature and mean radiant temperature measured at the classroom on the second day of measurement
Same as the first day, the humidity decreases consistently which is starting with at 74% relative humidity. During the time 11.30 am a little bump is visible in the graph. The humidity decreases to 50% due to the dry weather.
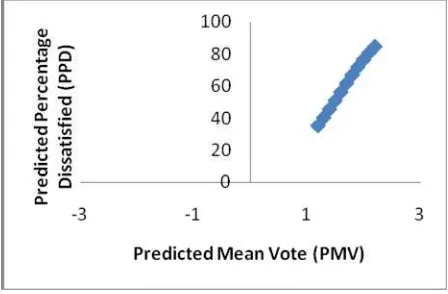
By refering to the ISO 7730, a statistical summary of overall thermal comfort indices is presented in Figure 7. The day measurement started sunny and dry. However, the influence of the outside environment is stronger. Figure 7 shows Predicted percentage of dissatisfied (PPD) as a function of predicted mean vote (PMV). The result illustrated the station PMV index at the morning was 1.2 and after lesson PMV increase to 2.2, indicating slightly warm and warm. Meanwhile, the PPD is around 35% to 84%.
Figure 7: Predicted percentage of dissatisfied (PPD) as a function of predicted mean vote (PMV) in the classroom on the second day of measurement
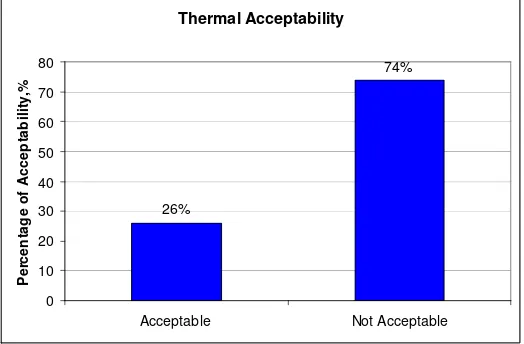
98% percent of people who voted that they preferred to be cooler also voted that they feel the thermal condition is not acceptable. As reported by other researchers, many subjects responding in the neutral zone, as having thermal comfort, also voted that they prefer to be cooler (Nyuk and Shan, 2003). Nevertheless, the preferable condition could be qualitative instead of a direct factor to be utilized for the thermal design or building evaluation. Designing based on the preferable temperature instead of the ambient condition can neglect the positive effect the adaptive opportunities have on thermal comfort. Based on these findings, the performance of the students were evaluated based on their ability to focus on their lessons as being good, followed with less focused and unable to focused at all.
Thermal Acceptability 74% 26% 0 10 20 30 40 50 60 70 80
Acceptable Not Acceptable
P e rc e n ta g e o f A c c e p ta b il it y ,%
Figure 8: Thermal acceptability in the classroom
CONCLUSION
From the obtained result in the two classrooms, the strong interdependence among environmental comfort factors was verified. Also the influence of the outdoor environment on the occupants was analyzed (climate and solar), which presented the importance of considering these factors as a whole in the design stage. The environmental conditions in the schools monitored did not satisfy all recommended criteria, the impact of this is on the students’ learning. There is a need for better guidance to help designers improve the environmental performance such as by using air conditioner in classroom. Therefore the mindset and paradigm should be change among engineers, designer as well as policies maker in order to create the comfort living among the students in order for them to stimulate their potential positive cognitive and later contributed to better performance during their study.
REFERENCES
ASHRAE Standard 55-1992: Thermal environment conditions for human occupancy. ASHRAE, Atlanta.
Bako-Biro Z, Kochhar N, Clements-Croome DJ, Awbi HB, Williams M. Ventilation
rates in schools and learning performance. In: CLIMA 2007, 10–14th June,
Coley DA, Greeves R. 2004. The effect of low ventilation rates on the cognitive function of a primary school class. Report R102 for DfES. Exeter University. Clements-Croome DJ, Awbi HB, Bako-Biro Z, Kochhar N, Williams M. 2008.
Ventilation rates in schools. Building and Environment 43(3):362–7.
Fanger, P.O. 1970. Thermal Comfort: Analysis and Applications, New York: McGraw Hill Book Company.
Fisk WJ. 2000. Health and productivity gains from better indoor environments and their relationship with building energy efficiency. Annual Review of Energy and the Environment 25(1):537–66.
H. W. Nyuk, and S. K. Shan. 2003. Thermal Comfort in Classrooms in the Tropics, Energy and Buildings, 3
International Organization for Standardization (ISO 7726 – 1985), Thermal
environment – instrument and method for measuring physical.
Kameda K, Murakami S, Ito K, Kaneko T. 2007. Study on productivity in the classroom. Nationwide questionnaire survey on the effects of IEQ on learning performance. In: CLIMA 2007, 10–14th June, Helsinki, Finland.
Shendell DG, Prill R, Fisk WJ, Apte MG, Blake D, Faulkner D. 2004. Association between classrooms carbon dioxide concentrations and student attendance in Washington and Idaho. Indoor Air 14(5):333–41.