i
PERFORMANCE EVALUATION OF OPTICAL AMPLIFIER IN WDM SYSTEM
PEH PO ING
This report is submitted in partial of the requirement for the award of Bachelor of Electronic Engineering (Telecommunication Electronics) With
Honours
Faculty of Electronic and Computer Engineering Universiti Teknikal Malaysia Melaka
ii
UNIVERSTI TEKNIKAL MALAYSIA MELAKA
FAKULTI KEJURUTERAAN ELEKTRONIK DAN KEJURUTERAAN KOMPUTER
BORANG PENGESAHAN STATUS LAPORAN
PROJEK SARJANA MUDA II
Tajuk Projek : PERFORMANCE EVALUATION OF OPTICAL AMPLIFIER IN
WDM SYSTEM
Sesi Pengajian : 1 1 / 1 2
Saya PEH PO ING
mengaku membenarkan Laporan Projek Sarjana Muda ini disimpan di Perpustakaan dengan syarat-syarat kegunaan seperti berikut:
1. Laporan adalah hakmilik Universiti Teknikal Malaysia Melaka.
2. Perpustakaan dibenarkan membuat salinan untuk tujuan pengajian sahaja.
3. Perpustakaan dibenarkan membuat salinan laporan ini sebagai bahan pertukaran antara institusi pengajian tinggi.
4. Sila tandakan ( √ ) :
SULIT*
*(Mengandungi maklumat yang berdarjah keselamatan atau kepentingan Malaysia seperti yang termaktub di dalam AKTA RAHSIA RASMI 1972)
TERHAD** **(Mengandungi maklumat terhad yang telah ditentukan oleh organisasi/badan di mana penyelidikan dijalankan)
TIDAK TERHAD
Disahkan oleh:
iii
DECLARATION
“I hereby declare that this report is result of my own effort except for works that have been cited clearly in the references.”
Signature : ……….
Name : PEH PO ING
iv
“I hereby declare that I have read this report and in my opinion this report is sufficient in terms of scope and quality for the award of Bachelor of Electronic
Engineering (Telecommunication Engineering) with Honours”
Signature : ……….
Supervisor’s Name : MR. CHAIRULSYAH B. ABDUL WASLI
v
DEDICATION
Special dedicated to my beloved father, Peh Kim Pong and
vi
ACKNOWLEDGEMENT
First and foremost, I would like to convey my sincere appreciation to my supervisor Mr. Chairulsyah B. Abdul Wasli for his assistance and guidance toward the progress of this thesis project. In the other hand, I also would like to extend my sincere gratitude to my ex-supervisor, Puan Zaiton Abdul Mutalip for her patience, concern and encouragement throughout the preparation of this thesis.
Besides that, I would like to dedicated my deepest thank to my beloved family members for their moral and financial support while completing my tertiary education. Furthermore, thanks to all the lectures and my fellow course mate for their cooperation, opinion and sharing.
vii
ABSTRACT
viii
ABSTRAK
Laporan ini menghuraikan tentang bagaimana untuk menilai prestasi penguat optic “Erbium-Doped Fiber Amplifier (EDFA), Raman Amplifier, and Hybrid Raman
and Erbium-Doped Fiber Amplifier (HFAs)” yang merupakan teknologi
“wavelength-division-multiplexing (WDM)” sistem multiterabit untuk masa depan.
ix
CONTENT
CHAPTER TITLE PAGES
TITLE i
STATUS VERIFICATION FORM ii
STUDENT DECLARATION iii
SUPERVISOR DECLARATION iv
DEDICATION v
ACKNOWLEDGEMENT vi
ABSTRACT vii
ABSTRAK viii
CONTENT ix
LIST OF TABLE xiii
LIST OF FIGURE xv
LIST OF APPENDIX xvii
LIST OF ABBREVIATIONS xviii
I INTRODUCTION 1.0 Project Background 1
1.1 Objectives of Project 2
1.2 Scopes of Work 2
1.3 Problems Statement 2
1.4 Methodology 3
x
II LITERATURE REVIEW
2.1 Fiber Optic is Green Technology 4
2.2 Wavelength-Division-Multiplexing 5
2.3 Optical Cables Fiber 7
2.3.1 Core Index Profile 8
2.3.2 Single-Mode Step-Index Optical Fiber 9 2.3.3 Multimode Step-Index Optical Fiber 9 2.3.4 Multimode Gradient-Index Optical Fiber 10 2.3.5 Advantages and Disadvantages of
Single-mode Step-index, Multimode Step Index, and Multimode Gradient-Index 11
2.4 Performance of Optical Amplifier 12
2.4.1 Gain 12
2.4.1.1 Attenuation Loss 12
2.4.1.2 Attenuation Coefficient 12
2.4.1.3 Return Loss 12
2.4.1.4 Insertion Loss 13
2.4.2 Noise Figure 13
2.4.3 Optical Signal-to-Noise Ratio 14
2.4.4 Bit Error Rate 14
2.4.5 Eye-Pattern 14
2.5 Optical Amplifier 15
2.5.1 Erbium-Doped Fiber Amplifier 15
2.5.2 Raman Amplifier 17
2.5.3 Semiconductor Optical Amplifier 18
2.5.4 Comparison of EDFA, Raman Amplifier
and SOA 19
2.5.5 Advantages and Disadvantages of EDFA,
Raman Amplifier and SOA 20
2.5.6 Hybrid Raman and Erbium-Doped
xi
III METHODOLOGY
3.1 Project Flow Chart 23
3.2 Project Block Diagram 25
3.3 Calculation of Gain, Noise Figure 25 3.4 Design Parameter for Erbium Doped Fiber
Amplifier 27
3.5 Design Parameter for Raman Amplifier 28
3.6 Design Parameter for Hybrid Amplifier 29
3.7 Wavelength-Division Multiplexing (WDM) Lab
Test 30
IV RESULT
4.1 Calculation Result of Design Parameter for Erbium
Doped Fiber Amplifier 32
4.2 Simulation Result of Design Parameter for Erbium
Doped Fiber Amplifier 32
4.3 Calculation Result of Design Parameter for Raman
Amplifier 33
4.4 Simulation Result of Design Parameter for Raman
Amplifier 34
4.5 Simulation Result of Design Parameter for Hybrid
Amplifier 35
4.6 Simulation Result by Comparing The Gain, Noise Figure and OSNR of EDFA and Raman
Amplifier by Using The same Length 36
4.7 Gain comparison between EDFA, Raman &
Hybrid amplifier 36
4.8 Noise Figure Comparison between EDFA, Raman
xii
4.9 BER Comparison between EDFA, Raman &
Hybrid Amplifier 45
4.10 Lab Test Result for WDM 48
V CONCLUSION
5.1 Discussion 51
5.2 Conclusion 54
REFERENCES 55
APPENDICES
xiii
LIST OF TABLES
TABLE TITLE PAGE
2.1 Transmission windows (wavelength bands) 6
2.2 Typical value for Mux/DMux Parameter in WDM 7
2.3 Advantages and disadvantages of Single-mode step-index,
Multimode step-index, and Multimode gradient-index 11
2.4 Characteristic of EDFA, Raman and SOA 19
2.5 Advantages and disadvantages of EDFA, Raman and SOA 20
2.6 Typical values observed in Hybrid amplifier (EDFA-Raman) 21 4.1 Calculated Gain, Noise Figure and OSNR of EDFA from 8m to 12m
with input signal 0dBm 32
4.2 Simulated Gain, Noise Figure and OSNR of EDFA from 8m to 12m
with input signal 0dBm 32
4.3 Simulated Gain, Noise Figure and BER of EDFA from 8m to 12m with input signal 0dBm at different frequency spacing 33 4.4 Calculated Gain, Noise Figure and OSNR of Raman from
20km to 25km with input signal 0dBm 33
4.5 Simulated Gain, Noise Figure and BER of Raman from 20km
to 25km with input signal 0dBm at different number of channel 34
4.6 Simulated Gain, Noise Figure and BER of EDFA from 20km
to 25km with input signal 0dBm at different frequency spacing 34
4.7 Simulated Gain, Noise Figure and BER of Hybrid (EDFA=8m, Raman=25km) with input signal 0dBm at different number of
xiv
4.8 Simulated Gain, Noise Figure and BER of Hybrid (EDFA=8m, Raman=25km) with input signal 0dBm at different frequency
spacing 35
4.9 Simulation result by comparing the Gain, Noise Figure and OSNR by
using the same length 36
4.10 Gain comparison between EDFA, Raman & Hybrid amplifier with
0dBm input signal 36
4.11 Gain comparison between EDFA, Raman & Hybrid amplifier with
-10dBm input signal 38
4.12 Gain comparison between EDFA, Raman & Hybrid amplifier
with 10dBm input signal 39
4.13 Noise Figure comparison between EDFA, Raman & Hybrid
amplifier with 0dBm input signal 41
4.14 Noise Figure comparison between EDFA, Raman & Hybrid amplifier
with -10dBm input signal 42
4.15 Noise Figure comparison between EDFA, Raman & Hybrid amplifier
with -10dBm input signal 44
4.16 BER comparison between EDFA, Raman & Hybrid amplifier with
0dBm input signal 45
4.17 BER comparison between EDFA, Raman & Hybrid amplifier with
-10dBm input signal 46
4.18 BER comparison between EDFA, Raman & Hybrid amplifier with
10dBm input signal 47
4.19 Received Power for an optical cable with length of 1m and 3m 48
4.20 Output Power for different value of Output Frequency by using
WDM (set 1) 48
4.21 Output Power for different value of Output Frequency by using
xv
LIST OF FIGURES
FIGURE TITLE PAGE
2.1 Wavelengths-Division-Multiplexing (WDM). 5
2.2 Core Index Profiles. 8
2.3 Eye-pattern 15
2.4 Schematic diagram of EDFA 15
2.5 Energy level of Er3+ ions in EDFA 16
2.6 Schematic of an optical communication system employing Raman
Amplification. 18
2.7 Semiconductor Optical Amplifier. 19
2.8 Schematic diagram of HFAs. 21
3.1 Project Flow Chart 24
3.2 Project Block Diagram 25
3.3 Schematic Diagram of single EDFA with 0dBm input signal 27
3.4 Schematic diagram of single Raman amplifier with 0dBm input
signal 28
3.5 Schematic diagram of Hybrid (EDFA + Raman) amplifier with 0dBm
input signal 29
3.6 Lab Test of WDM by using 1m and 3m cable 30
4.1 Comparison of Gain between EDFA, Raman & Hybrid amplifier
at 0dBm input signal 37
4.2 Comparison of Gain between EDFA, Raman & Hybrid amplifier at
xvi
4.3 Comparison of Gain between EDFA, Raman & Hybrid amplifier
at 10dBm input signal 40
4.4 Comparison of Noise Figure between EDFA, Raman &
Hybrid amplifier at 0dBm input signal 42
4.5 Comparison of Noise Figure between EDFA, Raman &
Hybrid amplifier at -10dBm input signal 43
4.6 Comparison of Noise Figure between EDFA, Raman &
xvii
LIST OF APPENDIX
APPENDIX TITLE PAGE
A Eye diagram for EDFA at 8m to 12m with input signal
at 0dB 56
B Eye diagram for Raman at 20km to 25km with input signal
at 0dB 59
C Eye diagram for Hybrid Amplifier at different wavelength 63
D Calculation of EDFA for different length 67
E Calculation of Raman Amplifier for different length 71
F Calculation of Hybrid Amplifier at length of 8m (EDFA)
and 25km (Raman) 77
G Datasheet for WDM 79
xviii
LIST OF ABBREVIATIONS
ASE - Amplified Spontaneous Emission
BER - Bit Error Rate
DMux - Demultiplexer
DRA - Distributed Raman Amplifier
EDFA - Erbium-Doped Fiber Amplifier
HFAs - Hybrid Fiber Amplifiers
Mux - Multiplexer
NF - Noise Figure
OSA - Optical Spectrum Analyzer
OSNR - Optical Signal-to-Noise Ratio
PH - Power High
PM - Power Medium
SNR - Signal-to-Noise Ratio
SOAs - Semiconductor Optical Amplifiers
1
CHAPTER I
INTRODUCTION
In optical fiber network, amplifiers are used to regenerate an optical signal, amplify and then retransmitting an optical signal. In a long-haul optical systems, the amplifiers are needed to compensate the attenuation occurred.
The main purpose of this project is to investigate and determine the characteristic of Erbium-Doped Fiber Amplifier (EDFA), Raman Amplifier, and Hybrid Raman and Erbium-Doped Fiber Amplifier (HFAs) and its performance in telecommunication by using the Optisystem software. After that, the best optical amplifier will be chosen among these amplifiers. Since the performance of the amplifier is influenced by the parameter of gain, Noise Figure (NF), Bit Error Rate (BER), and Optical-Signal-to-Noise Ratio (OSNR), the problem encounter in this project is to find the best design parameter for maximum reachable transmission distance.
2
1.1 Objectives of Project
The objectives of this project are:
1) To identify the best optical amplifier that can be used in the WDM system. 2) To suggest a new design of optical WDM transmission by using the best
optical amplifier characteristic.
3) To analyze the simulated data obtained from the Optisystem software.
1.2 Scopes of Works
This project will be focused primarily on the simulation of Erbium-Doped Fiber Amplifier (EDFA), Raman Amplifier, and Hybrid Raman and Erbium-Doped Fiber Amplifier (HFAs) by using the Optisystem software. The performance of the amplifiers will be evaluated depend on the amplifier’s gain, Noise Figure (NF), Bit Error Rate (BER), Optical Signal-to-Noise Ratio (OSNR), and eye-pattern. After that, comparison of result between the simulation result and theoretical result will be analyzed.
1.3 Problems Statement
Optical amplifiers have become a necessary component in long-haul fiber optic systems due to the demand for longer transmission lengths. The effect of dispersion and attenuation can be minimized in long-haul optical systems due to the invention of Erbium-Doped Fiber Amplifier (EDFA), Raman Amplifier, and Semiconductor Optical Amplifier (SOAs).
3
1.4 Methodology
This project will starts with the searching of source and information regarding to the EDFA, Raman amplifier, and HFA. The source and information are acquired from journal, reference books, e-Books, and internet. The circuit schematic diagrams of these amplifiers are determined from the journal and simulate by using the Optisystem software. All the parameters such as gain, Noise Figure (NF), Bit Error Rate (BER), Optical Signal-to-Noise Ratio (OSNR), and eye-pattern that determine the performance of these amplifiers are analyzed.
1.5 Thesis Outlines
Chapter 1: The first chapter will provide a general inspiration for the project. It
includes the objectives of the project, scopes of works, problems statement and the methodology.
Chapter 2: In this chapter, the research of background related to the project will be
discussed. The concept and theory of the circuit schematic diagram of Erbium-Doped Fiber Amplifier (EDFA), Raman amplifier, and Hybrid Raman and Erbium-Doped Fiber Amplifier (HFA) that is used in the simulation will be explained.
Chapter 3: The third chapter is the methodology. In this chapter, the procedure and
project flow of this project will be shown.
Chapter 4: This chapter will present all the simulation result from the Optisystem
software. All the graphs and tables obtained from the simulation will be compared with the theoretical results.
Chapter 5: The last chapter of this thesis is the conclusion and recommendation.
4
CHAPTER II
LITERATURE REVIEW
2.1 Fiber Optic is Green Technology
For instance, when a solar company improves energy conversion rate by a couple of percents, it is a market-breaking result! Slow improvements seem to be characteristic of energy production. But it is time we use technology innovation and put the best minds to work in order to improve energy efficiency across the board. It is possible. One example: first experiments in emitting diodes started in early nineties with very small efficiency. Fifteen years later, semiconductor lights are surpassing incandescent lights thanks to improvements typical of the semiconductor industry (performance doubling roughly every 2 years aka. as Moore’s law).
5
In contrast, fiber optics is a very “green” technology compared to semiconductor electronics. It dissipates a lot less energy than copper based cables and it saves a lot of materials: one single strand of glass can carry as much data as many thousands of copper cables and it can do over a longer distance without using electronic equipment to regenerate it. The oceans for example are a lot less crowded with more efficient fiber-optic submarine cables while supporting an ever growing need for international communications. In the other hand, fiber optics does not create any environmental polluting waste or byproducts or do not emit any harmful radiations etc.
2.2 Wavelengths-Division-Multiplexing (WDM)
[image:23.595.131.536.564.651.2]Wavelengths-division-multiplexing (WDM) is the basic technology of optical networking. It is a technique for using a fiber (or optical device) to carry many separate and independent optical channels as shown in Figure 1. The wavelength division multiplexing (WDM) is one of the most efficient techniques for increasing the information carrying capacity of an optical fiber communication system. The number of multiplexed channels is increased by reducing the channel spacing. The reduction in channel spacing increases the crosstalk and hence the performance of the system degrades considerably. There is continuous effort in scientific community to devise methods to decrease it [1].
Figure 2.1: Wavelength-Division-Multiplexing (WDM)
6
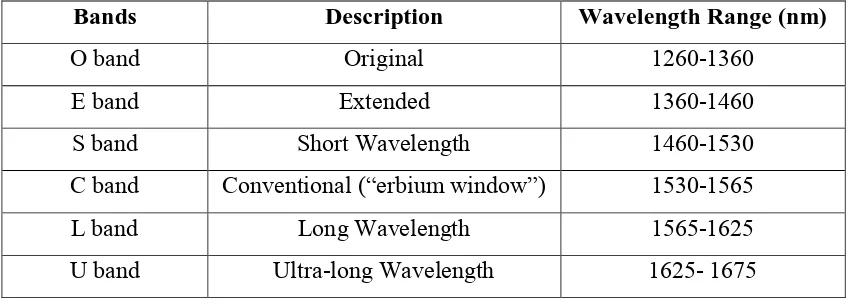
[image:24.595.108.531.255.407.2]the same band). Some systems are using a single fiber bidirectional for each direction. Each channel is allocated its own wavelength or rather range wavelength. A typical optical channel might be separate in 1nm wide. This channel is really a wavelength range within which the signal must stay. Normally, it’s much wider the signal itself. The width of the channel depends on many things such as the modulated line width of the transmitter, its stability and the tolerances of the other components in the system. Table 2.1 shows the transmission windows for different wavelength bands.
Table 2.1: Transmission windows (wavelength bands)
Bands Description Wavelength Range (nm)
O band Original 1260-1360
E band Extended 1360-1460
S band Short Wavelength 1460-1530
C band Conventional (“erbium window”) 1530-1565
L band Long Wavelength 1565-1625
U band Ultra-long Wavelength 1625- 1675
In most of telecommunication system, C band is chosen because C band has the lowest attenuation losses and achieves the longest range, compatible with fiber amplifiers.
[image:24.595.107.532.256.409.2]