POWER QUALITY SIGNALS DETECTION AND CLASSIFICATION USING
LINEAR TIME FREQUENCY DISTRIBUTION
N. H. T. H.Ahmad1,, A. R. Abdullah2and M. H. Jopri3
1,2Universiti Teknikal Malaysia Melaka,Malaysia. Faculty of Electrical Engineering, Malacca,Malaysia
[email protected], [email protected]
3Universiti Teknikal Malaysia Melaka, Faculty of Engineering Technology, Malacca,Malaysia. [email protected]
Abstract- Power quality has become a great concern to all electricity consumers. Poor quality can cause equipment failure, data and economical. An automated monitoring system is needed to ensure signal quality, reduces diagnostic time and rectifies failures. This paper presents the detection and classification of power quality signals using linear time-frequency distributions (TFD). The power quality signals focus on swell, sag, interruption, transient, harmonic, interharmonic and normal voltage based on IEEE Std. 1159-2009. The time-frequency analysis techniques selected are spectrogram and Gabor transform to represent the signals in time-frequency representation (TFR). From the time frequency representation (TFR) obtained, the signal parameters are estimated to identify the signal characteristics. The signal characteristics are the average of root means square voltage (Vave,rms), total waveform distortion (TWD), total harmonic distortion (THD) and total non harmonic distortion (TnHD) and duration of swell, sag, interruption and transient signals will be used as input for signals classification. The results show that spectrogram with the half window shift (HWS) provides better performance in term of accuracy, memory size, and computation complexity
KeywordsüLinear time frequency distribution; Time frequency representation; Power quality; Spectrogram; Gabor transform
I. INTRODUCTION
Power quality is the availability of pure sinusoidal voltage and current waveforms at 5 0 Hz (frequency power-line in Malaysia) without any disturbances at the incoming point of the supply system. Power quality problem is any problem manifested in voltage, current or frequency deviations with results in the failure or disoperation of end-use equipment [1 -3 ]. With the rapid advance in industrial applications that rely on sophisticated electronic devices, a demand for power quality and reliability has become a great concern. Power quality problems can cost business billions of dollars each year in lost revenue, process improvement and scrapped product. Major causes of power quality related revenue losses are interrupted manufacturing processes and computer network downtime [4 ].Conventional techniques that are currently used for power quality monitoring are based on visual of voltage and current waveforms [5]. The available equipment in the market for the inspection can capture and print the power quality data only at the current time. Therefore, a computerized and automated technique for monitoring and analysis of power quality
Many techniques were presented by various researchers for analyzing or classifying power quality problems [6-8]. However, this paper focuses on time-frequency analysis techniques to analyze power quality problems. Spectrogram and Gabor transform algorithms are proposed to identify the signals in time frequency domain. The spectrogram is squared magnitude of STFT where this technique very popular in many application. The spectrogram technique provides a good time resolution for narrow window while the large window is useful for good frequency resolution. The Gabor technique required very much computation compared spectrogram because it used the discrete Fourier transform; meanwhile spectrogram used the fast Fourier transform which it proposed to minimize the computation complexity.
In this paper the spectrogram and Gabor transform technique is used to represent the signals in time frequency representation (TFR).This technique will be analyzed with three different window shifts which is one sample window shift (OSWS), half window shift (HWS), and one window shift (OWS). From the TFR parameters of the signal are estimated and then, characteristics of signal are calculated from the signal parameter. The MAPE result use to identify the accuracy, memory size, and computation complexity of the signal characteristics that are calculated from TFR for each window. Lastly to verify the performance of this system, 100 signals with different characteristics for each type of power quality signal are generated and classified at signal noise to ratio (SNR) from 0db to 40 db and percentage of correct classification is identified.
II. POWER QUALITY SIGNAL
The parameters of the signal are estimated from the TFR to identify the signal information in time. This information is important to detect the power quality signal.
A. Signal model
The signals divide into three categories: voltage variation, waveform distortion and transient signal. Swell, sag and interruption are under voltage variation, harmonic and interharmonic are for waveform distortion and transient is for transient signal. The signal models of the categories are formed as a complex exponential signal based on IEEE Std. 1159-2009 [9] and can be defined as
å
=
-P =
3
1
1
2 ( )
)
( 1
k
k k k t f j
vv t e A t t
z p (1)
waveform distortion and ztrans(t) represents transient
signal. k is the signal component sequence, Ak is the
signal component amplitude, f1 and f2 are the signal frequency, tis the time while P(t)is a box function of the signal. In this analysis, f1,t0andt3are set at 50 Hz, 0 ms and 200 ms, respectively, and other parameters are defined as below :- [10]
1. Swell: A1=A3= 1,A2= 1.2, t1= 100 ms, t2= 140 ms
III. LINEAR TIME FREQUENCY ANALYSIS TECHNIQUES
Time-frequency analysis techniques present a three-dimensional plot of a signal in terms of the signal energy or magnitude with respect to time and frequency [1 1 ]. This study focused on spectrogram and Gabor transform to perform time-frequency of power quality signals.
A. Spectogram
The spectrogram is the result of calculating the frequency spectrum of windowed frames of a compound signal [9 - [1 0 ] . The spectrogram time frequency representation is calculated as
follows:-(4 )
B. Gabor transformFor signal x(t), the Gabor transform is defined as
:-(5)
where x(t) is the signal under analysis and w(t) is the observation window, while Tw and f0 are time and frequency sampling interval that must satisfy the Heisenberg uncertainty relation [11]
(6)
for analysis purposes, the Gabor transform is squared similar to the spectrogram.
IV. SIGNAL ESTIMATION
Parameters of the signal are estimated from the time frequency representation (TFR) to identify the signal information in time. This information is important to detect the power quality signal
A. Instantaneous RMS voltage
The instantaneous RMS voltage [17] is :
the maximum frequency of interest.
B. Instantaneous RMS fundamental voltage
Instantaneous RMS fundamental voltage is defined as the RMS voltage at power system frequency [12]. It can be
where f1is the fundamental frequency that corresponds to the power system frequency and Dfis the bandwidth. In this paper,Dfis set at 50Hz.
C. Instantaneous Total Waveform Distortion
Waveform distortion represents all deviations of the voltage waveform from the ideal sinusoidal waveform in terms of magnitude or frequency the signal [12, 15]. The instantaneous total waveform distortion can be expressed
as:-voltage and Vrms(t) is the instantaneous RMS voltage.
D. Instantaneous Total Harmonic Distortion
Total harmonic distortion, THD is used to measure of
highest measured harmonic component.
E. Instantaneous Total Nonharmonic Distortion
Voltage often contains interharmonic components that are not multiple integer of the power system frequency. For example, a 50 Hz signal distorted with a 155 Hz interharmonic [14,15]. It can be written
()
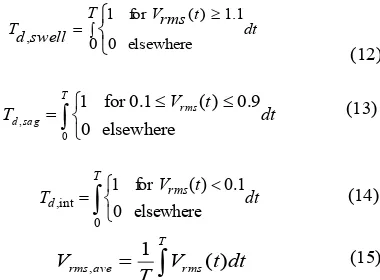
Signal characteristics are calculated from the signal parameters. The characteristics present the information of the signal and are used as input for signal classifier to classify power quality signals. By using the instantaneous RMS voltage, four signal characteristics can be calculated such as duration of swell, sag, interruption and average of RMS voltage and can be respectively defined
meanwhile, duration of transient can be identified from the instantaneous total waveform distortion and can be expressed
as:-where TWDtrans,thres is the total waveform distortion
threshold for transient. In this study, the threshold is set at 0.05.Total harmonic distortion average and total interharmonic distortion average are also important characteristics. They can be calculated, respectively from the instantaneous total harmonic distortion and instantaneous total interharmonic distortion as
ò
IV .SIGNAL CLASSIFICATION
Rule-based classifier is a deterministic classification method which it is simple and easy to implement . Since the signal characteristics provide good prior knowledge of the power quality signal, the rule-based is suitable to be used for signal classification.
The following pseudo code describes a rule based classifier of the power quality signal based on the signal characteristics [16]. The threshold settings are set based on IEEE std. 1159-2009.
Function[z]=rule_based_classifier(Td,swell,Td,sag,Td,int,
Td,tran,Vrms,ave,THDaveand TnHDave)
elseif(Td,tran>=0.3ms) & (Td,tran<50ms)
z=Transient signal;
elseif (THDave>=THDthres) & (TnHDave<TnHDthres)
z=Harmonic signal;
elseif (TnHDave>=TnHDthres) & (THDave<THDthres)
z=Interharmonic signal;
elseif (Vrms,ave>0.9pu) & (Vrms,ave<1.1pu)
z=Normal signal; else
z=unknown
V. RESULT
Power quality signals are represented in TFD using spectrograms and Gabor Transform.Analysis results were obtained from the time frequency distributions of power quality signals using both technique. The parameters that are analyzed are RMS, THD, TWD and TnHD values.
A. Signal analysis using spectogram
The spectrogram is used to analyzed the signals and
Figure 1a.Transient signal
Figure 1b.Time Frequency Representation using spectogram The example of the signals from spectrogram technique and their TFRs is shown in Fig. 1. Fig. 1a shows signal parameters of transient signal which the magnitude of the signal increases at 100 ms for duration of 15ms. This signal are estimated from the TFR using spectrogram with one sample window shift (OSWS) as per illustrated in Fig.1b.The highest power is represented
60 80 100 120 140 160 180 0
50
Instantaneous Total Harmonic Distortion
Time (msec)
Instantaneous Total Waveform Distortion
P
Instantaneous RMS Fundamental Voltage
Time (msec)
by red and lowest in blue color. TFR show that the signal consist of fundamental frequency 50 Hz along the time axis meanwhile the momentary power increase at transient frequency 1000 Hz.
Figure 1c.Instantaneous RMS voltage
Figure 1d.Instantaneous RMS fundamental voltage Fig. 1c shows that the RMS voltage increases from normal voltage 1.0 pu to 1.05 pu, starting at 95ms for duration of 20ms. The RMS fundamental voltage remains constant at 1.0 pu as shown in Fig. 1d, it happen because the transient frequency is at 1000Hz and it does not happen at fundamental frequency.
B. Signal analysis using Gabor transform
The power quality signals were also tested using Gabor transform and it also evaluated with OSWS, HWS and OWS window.The signal transient is generate similar to spectrogram technique which occurs at 100ms for duration of 15ms.The TFR using Gabor transform technique evaluated with different three window which detects two frequency component which is fundamental frequency 50Hz and transient frequency 1000 Hz at time frequency axis However, each TFR gives different duration because the higher number of the window shift reduces the time resolution of TFR.
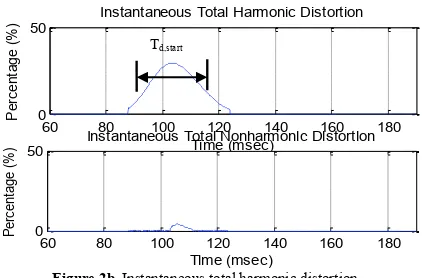
The example of transient signal and its results with OSWS in Fig 2a-c.As shown in Fig. 2a, 2b and 2c, RMS voltage, total waveform distortion and total harmonic distortion, respectively, increase from normal magnitude between 97 ms and 116 ms. It indicates that, the duration of the transient signal using this technique is 19 ms and is more accurate compared to spectrogram which is 22 ms while for total nonharmonic distortion, the magnitude maintains at zero percent. Thus, these parameters clearly show that the transient signal only consists of harmonic frequency components.
Figure 2a. Instantaneous total waveform distortion
Figure 2b. Instantaneous total harmonic distortion
Figure 2c.Instantaneous total nonharmonic distortion
C. Performance comparison of spectogram and Gabor Transform analysis
To determine the optimal technique, time-frequency analysis by using spectrogram and Gabor transform have been compared in terms of accuracy, memory size and computation complexity of the analysis. Several set of signals have been used to analyze the accuracy of signal characteristics. Each set was tested and the simulation results were collected by using simulation software, MATLAB. In order to assess accuracy of the simulation results, mean absolute percentage error (MAPE) was used as index. Smaller value of MAPE offers more accurate results. It can be define as [17,19].
(19)
wherexi(n) is actual value, xm(n) is measured value and
Nis number of data.
Instead of measured the accuracy, the computation complexity is determined for spectrogram and Gabor transform to
Instantaneous Total Nonharmonic Distortion
(21)
In addition, the memory size of data processing also analyzed to represent the signal in TFR is dependent on duration of the signal, number of window length and number of sample shift [18,19]. It can be expressed as
(22)
where Nw, Nx and Ns are number of window length signal length and sample shift.
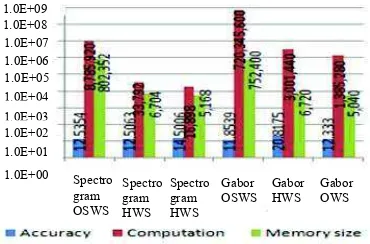
Figure 3.Comparison of the time-frequency distributions in terms of accuracy, computation complexity and memory size of the analysis Figure 3 shows the bar graph for average of accuracy, computation complexity memory size. The bar graph shows that Gabor OSWS gives the smallest MAPE value which means, it provides the most accurate results compared to the others. In term of computation complexity the graph indicates that spectrogram with OWS gives the lowest computation complexity whereas Gabor transform with OSWS is the highest. Gabor transform with OWS gives the smallest memory size and for OSWS is the highest.
D. Classification of power quality signal
By using the best TFD, power quality signals are analyzed and then classified by using rule-based classifier as discussed in section IV. Similar to the comparison process, 100 signals with different characteristics for each type of power quality signal are generated to identify the performance of the system. These signals are classified at SNR from 0 to 40 db and the graph of the correct classification signal versus SNR for each type of signal is plotted as shown in Fig. 4. The result shows that the system gives the correct classification for all signals starting point at 34 db of SNR. Interruption signal presents the best performance amongst the other signals where it gives 100% correct at 10 db. Meanwhile, the worst performance is normal signal which gives 100% correct at 34 db of SNR.
Figure 4. The performance of the classifier for all power quality signals
VI. CONCLUSIONS
As a conclusion, this paper presents the analysis of power quality signals using spectrogram and Gabor transform. The results prove that the spectrogram with HWS provides optimal performance in terms of accuracy, memory size and computation complexity of the analysis which means, it is the best technique to be implemented for power quality classification system as compared to the other techniques.
ACKNOWLEDGMENT
The authors would like to thank Universiti Teknikal Malaysia Melaka (UTeM) for its financial support Malaysia for providing the resources for this research.
REFERENCES
[1] Sallehhudin Y., Abu H. A., et al., A Guide Book on Power Quality, Tenaga Nasional Berhad, Malaysia, 1995
[2] Dugan R.C., McGranaghan M. F., Beaty H. W., Electric Power Systems Quality, New York: McGraw-Hill, 2002
[3] Khan, A.K., “Monitoring Power for the Future”, Power
Engineering Journal, Vol 15, Issue 2, April 2001, pp 81-85. [4] W. G. Morsi and M. E. El-Hawary, "Fuzzy-Wavelet-Based
Electric Power Quality Assessment of Distribution Systems
Under Stationary and Nonstationary Disturbances”, IEEE Transactions on Power Delivery, vol. 24, no. 4, pp. 2099-2106, 2009
[5] Y. Krisda, P. Suttichai and O. Kasal, “A Power Quality Monitoring System for Real-Time Fault Detection”, IEEE International Symposium on Industrial Electronics (ISIE 2009), pp. 1846-1851, July 2009.
[6] Ribeiro, M.V., Romano, J.M, et al., “An improved method for signal processing and compression in power quality
evaluation” , IEEE Trans. On Power Delivery, Delivery, vol
19, Issue 2,April 2004.
[7] Ghafour A.M., Azah M., “Classifying Short Duration Voltage Disturbances Using Fuzzy Expert System”, IEEE Trans on 4th Student Conference on Research and Development (SCOReD)
[8] Hasniaty, Azah M., et al., “Automating Power Quality Disturbance Analysis Using the IPQDA Software Tool”, IEEE Trans on 4th Student Conference on Research and Processing A Comprehensive Reference, Elsevier,London, 2003.
[9] IEEE, “IEEE Recommended Practice for Monitoring Electrical Power Quality,” IEEE Std. 1159-2009
[10] A R Rahim Abdullah, A.Z. Sha’meri, N.A. Mohd Said, N. Mohd Saad, A. Jidin, “ Bilinear Time-Frequency Analysisi techniques for Power Quality Signals”, Proceedings of the International MultiConference of Engineers and Computer Scientists 2012,IMECS 2012.
[11] A. Kusko, T. Thompson, Power Quality in Electrical Systems.
McGraw Hill, 2007
1.0E+00
Spectro gram HWS 1.0E+01
1.0E+02 1.0E+03 1.0E+04 1.0E+05 1.0E+06 1.0E+07 1.0E+08 1.0E+09
Spectro gram OSWS
Spectro gram HWS
Gabor OSWS
Gabor HWS
Gabor OWS
[12] N. Urasaki, T. Senjyu, K. Uezato and T. Funabashi, “Adaptive
Dead-Time Compensation Strategy for Permanent Magnet
Synchronous Motor Drive”, IEEE Trans. on Energy Conversion, Vol. 22, Issue. 2,pp. 271-280, June 2007 [13] H. J. Bollen and Y. H. Gu, Signal Processing of Power Quality
Disturbances, Wiley-Interscience, 2006
[14] A. R. Abdullah and A. Z. Sha’ameri, “Power quality analysis
using linear time-frequency distribution”, Proceedings of IEEE International Conference on Power and Energy (PECON 2008), pp.313-317, Johor, Malaysia, December 2008
[15] A. R. Abdullah, A. Z. Sha’ameri and A. Jidin, “Classification
of power quality signals using smooth-windowed Wigner-Ville
distribution”, Proceedings of IEEE International Conference on Electrical Machines and System (ICEMS 2010), pp.1981-1985,Incheon, Korea, Oct. 2010
[16] A.R. Abdullah, N.M. Saad, A.Z. Sha’ameri, “Power Quality
Monitoring System Utilizing Periodogram and Spectrogram
Analysis Techniques,”in Proc. 2007 IEEE International Conference on Control,Instrumentation and Mechatronics Engineering., pp. 770-774.
[17] A. R. Abdullah and A. Z. Sha’ameri, “Power Quality Analysis
using Smooth-Windowed Wigner-Ville Distribution”,
International Conference on Information Science, Signal Processing and their Applications (ISSPA 2010), pp. 798-801, 2010