iDECON 2012 – International Conference on Design and Concurrent Engineering Universiti Teknikal Malaysia Melaka (UTeM)
15-16 October 2012
WORK STUDY TECHNIQUES EVALUATION AT BACK-END
SEMICONDUCTOR MANUFACTURING
Abd.Rahman, M.N.
1, Abdullah, R.
2and Kamarudin, N.J.
31Faculty of Manufacturing Engineering,
Universiti Teknikal Malaysia Melaka, Durian Tunggal, 76100 Melaka, Malaysia Phone: +606-331 6512, Fax: +606-234 6524, Email: [email protected]
2
Faculty of Engineering Technology,
Universiti Teknikal Malaysia Melaka, Durian Tunggal, 76100 Melaka, Malaysia
3Industrial Engineering Department,
ON Semiconductor (M) Sdn Bhd, 122-123 Kawasan Perindustrian Senawang, 70450 N.Sembilan, Malaysia
Abstract – With the ever increasing labor cost and high labor turnover, performing labor productivity study is imperative for the back-end semiconductor manufacturer to stay competitive. However, an effective technique to perform the work study on the operators is required before any productivity improvement initiatives can be performed. This paper discusses the various techniques being evaluated based on the preset criteria
established by the company’s management. Results from the
method evaluation will be used to determine the suitable work study technique to be used to perform labor productivity study.
Keywords – Work Study, Labor Productivity, Technique Evaluation
I. INTRODUCTION
The key to any given investigation is to select the most appropriate method for the study based on the identified set of key factors to be improved [1]. Therefore, in the search of the effective tool to perform labor productivity study at the back end semiconductor manufacturing line, the key criteria will need to be defined. Based on the semi-structured interview with the management and the manufacturing line personnel, eight key criteria were identified for the evaluation of a suitable work study technique. These criteria are:
1. Able to measure labor utilization 2. Able to determine ideal man-machine
configuration
3. No cost required to purchase special software 4. Ease of use and maintained
5. Easy to be communicated to any levels 6. Easy to train production personnel. 7. Should be able to produce accurate result
8. Flexible to be used on both production and non-production operators
Once the key criteria have been set, extensive literature review were done to select the work study techniques to be evaluated. The common techniques found were Process Mapping, the Multi-Machine chart, Simo Chart, Work Sampling and etc. More recent techniques found include the computer simulation, the Yamazumi Chart and the Touch Time Analysis.
For the evaluation purpose, the process mapping and the multi-machine chart were chosen since these techniques were the most common techniques used by the founders of IE and other work study practitioners to measure labor productivity and determine the manning ratio of a process. In addition, the computer simulation technique, the Yamazumi Chart and the Touch Time analysis were also evaluated since these techniques were the more recent techniques used in the industries to measure labor productivity.
The wafer sawing process was chosen to be used for the methods evaluation purpose. The researchers together with the company’s Industrial Engineers (IEs) conducted the study. All techniques were evaluated based on the eight pre-set criteria and a table was constructed to summarize the result findings.
II.WORK STUDY
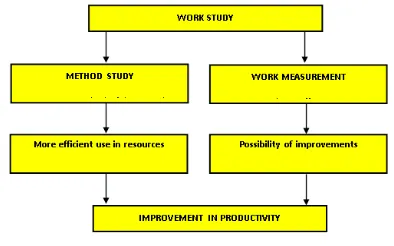
Work study can be defined as the systematic examination of activities in order to improve the effective use of human and other material recourses. Sometimes, the actual term of “work study” has been replaced by phrase of
“continuous improvement of work”. This is due to the on-
going monitoring improvement and quantifies work on a continuous basis [2].
314 Figure 1 shows the relationship between work method study and work measurement.
Fig. 1. Relationship between work Study and Work Measurement
The three keys to any problem solving is the identification of major factors to be improved, selection of method that specifically focus on the factors and the measurement of the results [4]. His statement highlighted the importance of method selection in performing work measurement study. Currently, there are various techniques being employed by the industrial engineers and the professional practitioners. Among the well-known traditional techniques being used are the process flow charts, man to machine charts, simo charts, work sampling and work activity analysis [5,6,7]
With the development of sophisticated computer technology and the drive to develop methods which can efficiently solve a particular investigation, more recent methods like Touch-Time Analysis, Yamazumi Chart, Balancing Factor, Linear Programming and Simulation Modeling are being employed for labor productivity measurement [8,9,10,11,12]
III. METHODS EVALUATION
In order to achieve the objective of measuring operator utilization and determine optimum man-machine configuration, a suitable work study technique will need to be selected from the various tools and techniques available. Thus, five techniques were identified to be selected such as the Process Mapping, Multi Machine Chart, Computer Simulation, Yamazumi Chart and Touch Time Analysis. The wafer sawing process operator activities were chosen to be used for the method evaluation study.
A.Process Mapping
The first method evaluated was the process mapping or the process chart. An operator’s activities performing work at the wafer sawing was chosen to be mapped in the back-end semiconductor manufacturing. Detail work elements from the beginning of the shift until finishing a unit of product or the in this case, the wafer is recorded into the simplified process mapping chart. From the analysis of the data, the utilization of the operator can be divided into two parts:
(a) The activities which were done only once during the shift. This non repetitive activity time will be divided with the total working time in a shift which was 7.2 hours or 432 minutes. The non-repetitive activities are highlighted in blue in Figure 2. The operator utilization while performing the non-repetitive activity is:
Non repetitive activity utilization = [47 min / 432 min] x 100% = 11%
(b) Next, the total time for activities which were repeated every time a wafer was handled was calculated. The repetitive task was performed on every wafer involved loading the wafer onto the saw machine, testing the saw machine until storing the completed wafer in the kanban area (Figure 2). From the analysis, the total time taken for repetitive task is 4.05 min and data from the output log showed that average of 25 wafers were processed in a shift. Therefore, the repetitive activity utilization can be calculated as:
Repetitive activity utilization
= [(4.05 min x 25) / 432 min] x 100% = 24%
35%. Figure 2 shows the data on the process mapping study done at the wafer sawing process.
Fig. 2. Process Mapping Chart on Wafer Saw Operator
The process mapping method is a fast and easy method to be used to chart the operator’s detail activity and obtaining the labor utilization. Existing Microsoft application can be used and therefore, the cost to perform this technique is practically low. Data accuracy is dependent on the work measurement technique being employed such as using the stop watch or the predetermined time standards. However, the existing Process Mapping Chart format is not designed for the use of the predetermined time standard data. This method can be easily trained to the line personnel even though the person is not highly educated. The disadvantage of this method is that it is not apparent on how the man to machine ratio can be obtained.
The process mapping method has the potential to be used at the back-end semiconductor manufacturing line. However, the method will need to be enhanced in order to utilize the predetermined time standard method to increase data accuracy and also to be able to obtain the man to machine ratio.
B.Multi Machine Chart
The Multi Machine Chart is also a well-known method being utilized to determine the operator’s utilization. This chart is useful when studying the interrelationship of the two resources. However, the man to machine chart is easy to be used when one operator operates one machine only and can get to be very complicated when more than one operator or machines are involved. In the semiconductor manufacturing environment, it is common for an operator to man more than one machine and therefore, the multi-machine chart is a more appropriate chart to be used. In Figure 3, the multi-machine chart is able to capture both the machines and operator working intermittently and showing what each is doing at every moment in time.
Fig. 3. Multi Machine Chart on Wafer Saw Operator
The approach to calculate the operator utilization is the same as the process mapping technique. However, the activities belonging to each machine will need to be identified. The repetitive work and non-repetitive work will also need to be segregated and added together in order to get the total utilization of the operator when manning two machines. With the Multi Machine Chart technique, the man to machine ratio for this operator can be obtained. For this case, the total utilization of the operator is 62.5% (Error! Reference source not found.1) and there is a chance to add another machine to this operator to increase her utilization to the ideal utilization of 85%.
a
316
Table 1. Data Analysis for Multi Machine Chart
When applied at the same wafer saw operation, this chart is twice as complicated as the process mapping technique as this method captures two types of activities which are the saw operator and the wafer saw machine. The complexity will increase when more machines are added to the operator.
The multi machine chart is able to provide the measurement of the manning utilization and the man machine ratio. In addition, this technique also utilizes the Microsoft office application and therefore, there is no issue in terms of cost. The method is also flexible to be used at both the manufacturing and non-manufacturing operator. Although can be easily taught to the manufacturing personnel, the study can be very tedious and complicated because it requires more than one observer to study and record the resource’s activities. The data recording and analysis can also be very lengthy and cumbersome especially when more detail activities are to be recorded or predetermined time standard is to be utilized to improve data accuracy. Hence, this method is not favorable for the back-end semiconductor production line.
C.Computer Simulation
The Multi Machine Chart is also a well-known Computer Simulation is a technique of constructing a computer model that describes the behavior of a real world system. The result of the model will then be used to test the difference in the performance when several operating conditions are applied to the system. In this case, a simulation model using Witness (Figure 4) is developed to model the operator’s activities in order to obtain the operator’s utilization while manning a certain set of equipment.
To keep the model simple, only the wafer saw operator’s repetitive activities are being used in the model. Part001 is pulled into the system through a dummy machine before entering the buffer1 and being pulled into the wafer saw machine to be processed. The wafer saw machine will only require the operator to assist the machine or to perform minor repair activities. Otherwise, the operator will be called to the workbench ‘machine’ for activities such as wafer preparation, inspection and data recording. These operator’s activities are necessary to be modeled in order to collect the statistics for the labor utilization.
Fig. 4. Simulation Model of Wafer Saw Operator
The model is run for a shift of 432 minutes. The result in Figure 5 shows the labor utilization while manning one machine is at about 20%. If 11% value of non-repetitive work is added to this value, the result obtained from the simulation model is close to the result obtained through the Process Mapping technique and thus, the model is a valid model to be used.
Fig. 5. Simulation Model of Wafer Saw Operator
The simulation technique is also another technique that can be used to measure labor utilization and determine man to machine ratio of a process. However, the time taken to obtain a result from the simulation model is triple of the process mapping technique since additional time is required to build, verify, debug and validate the model result. In addition, the model run time will be much slower if more detail activity elements are added into the model. The advantages with simulation are that once modeled, it is easy and fast to update and can yield accurate result.
management wanted a technique that can be easily trained to the manufacturing personnel and utilized using the existing Microsoft office application.
D.Yamazumi Chart
The Yamazumi Chart is a technique used to identify unproductive activity or waste in the production. The steps to develop this chart involve:
i. Familiarizing with the process area ii. Writing down the work element
iii. Measuring the time for each work element
iv. Identifying actual work, auxiliary and waste part of the work elements
v. Charting out the measurements
The process mapping technique will still need to be employed in order to record the work element, to measure the time for each activity and to segregate each activity into value added and non-value added activities. This chart is also good to graphically present the result of the work study (Figure 6).
Fig. 6. Yamazumi Chart of Wafer Saw Operator
E.Touch Time Analysis
This technique was designed by the McKinsey Consultants initially to measure the labor utilization for the front-end semiconductor manufacturing environment or the Wafer Fabrication facility where the nature of the process is very different from the back-end semiconductor assembly process. However, the method was then extended at ON Semiconductor back-end manufacturing for inter-sites benchmarking exercise. The data input included the number
of equipment, maximum batch size, batch processing time, transport time and maintenance time by the operators. The touch time analysis will show the total number of activities or touch times per week performed by the operator and the operator utilization percentage.
Fig.7. Yamazumi Chart of Wafer Saw Operator
Error! Reference source not found.7 showed the
318
IV. SUMMARY
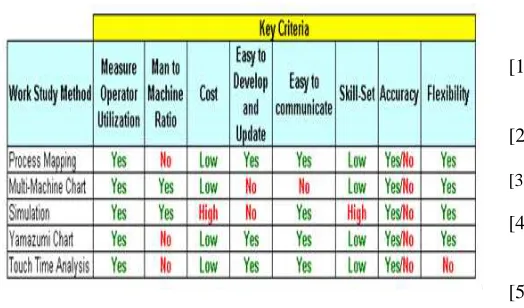
The summary of all the methods evaluated is presented in Table 2.
Table 2. Summary Result of Work Study Technique Evaluation
The Process Mapping technique is an easy technique containing important elements such as activity mapping and the job category that can be utilized in the development of a suitable work study technique for the back-end semiconductor production line. The Multi Machine Chart, although can get to be very complicated if more machines are added, provided important information on how the man to machine ratio can be calculated.
As for the more recent techniques, computer simulation took longer to develop, very costly and require a skilled person to build the model. However, once the model is developed, it can be very fast to update and maintain. The Yamazumi Chart has the advantage to be easily communicated to show the labor utilization per each activity element but can be very tedious to update. Last but not least, the Touch Time Analysis is only suitable for a high-level analysis since the detail element of each process is not captured thus affecting the result accuracy. The accuracy level can be increased depending on the type of work measurement techniques being used.
From the study, the Process Mapping and Multi Machine Chart are low cost and easy to learn techniques that can be used to determine the operator utilization and man-machine configuration.. Through both techniques, the researchers were able to identify some key variables required for the development of the suitable work study technique to be used to study operator activities at back-end semiconductor manufacturing. The researchers will also need to determine a work measurement technique suitable to be used to ensure an acceptable level of accuracy for the study.
ACKNOWLEDGMENT
The authors gratefully acknowledged the Universiti Teknikal Malaysia Melaka for the support provided during the course of this study. The authors also wish to thank ON Semiconductor (M) Sdn Bhd Industrial Engineering and Management Team for providing the facility, expertise and great support to ensure the success of this project.
REFERENCES
[1] Grunberg, Thomas (2003). “A review of Improvement Methods in Manufacturing Operations”. Work Study. Vol 52. No 2. 89-93. [2] Brown, Stephen (1994). “Role of Work Study in
TQM”. The TQM Magazine. Vol.16, No3.9-15. [3] Baines, Anna (1995). “The Basic Principle Revisited”.
Work Study. Vol 44.No 7.10-14
[4] Denton, Keith D. (2005). “Measuring Relevant Things”. International Journal of Productivity and Performance Management. 278-287
[5] Meyers, Fred E., Stewart, James. R (2002). Motion and Time Study for Lean Manufacturing. Prentice Hall. 3rd Edition. 26-30.
[6] Aft, L.S. (2000). Work Measurement and Method Improvement. John Wiley. 105-145
[7} Daniels, Shirley (1997). “Back to Basics with Productivity Techniques”. Work Study. Vol 46. No 2. 52-57
[8] Dengiz, Berna, Bektas, Tolga, Ultanir, Eren A. (2006). “Simulation Optimization Based DSS Application: A Diamond Tool Production Line in Industry”. Simulation Modeling, Practice and Theory. Elsevier B.V Science Direct. Vol 14. Issue 3. 296-312.
[9] Ong, H.H (2007). “Establishing Man-Machine Ratio
using Simulation”. 2007 Winter Simulation Conference. 1663-1666
[10] McKinsey Consulting (2004). ON Semiconductor Benchmarking Exercise.
[11] Motorola (2003). TPM Balancing Factor Presentation slides.
[12] Yamazumi Chart. [Online]. Available at