i
DNA BARCODING OF THE FRESHWATER FISHES
FROM JAVA AND BALI ISLAND, INDONESIA
HADI DAHRUDDIN
GRADUATE SCHOOL
BOGOR AGRICULTURAL UNIVERSITY
BOGOR
iii
STATEMENT ABOUT THESIS, INFORMATION SOURCES,
AND ACT OF SPILLING OVER COPYRIGHTS*
By this writing I clarify that the thesis entitled DNA Barcoding of the freshwater fishes from Java and Bali island, Indonesia is my own work under the supervisions of the advising committee and hasn’t been proposed for any institution. Copied information source of published and unpublished writing of other author has been mentioned in the text and incorporated in the references at the last part of this thesis.
By this writing I hand over the copyright of my thesis to Bogor Agricultural University.
Bogor, August 2015
Hadi Dahruddin
iv
SUMMARY
HADI DAHRUDDIN. DNA Barcoding of the freshwater fishes from Java and Bali island, Indonesia. Supervised by BAMBANG SURYOBROTO, NICOLAS HUBERT dan ACHMAD FARAJALLLAH.
Among the 899 species of freshwater fishes reported from Sundaland biodiversity hotspot, nearly 50% are endemics. The functional integrity of aquatic ecosystems is currently jeopardized by human activities and landscape conversion led to the decline of fish populations in several part of Sundaland. Java Island, for instance, experienced an exponential growth of human population reaching 130 millions of people currently sharing 130,000 km2. The inventory of the Javanese ichthyofauna has been discontinuous and the taxonomic knowledge is scattered in the literature.
The present study provides a DNA barcode reference library for the inland fishes of Java and Bali with the aim to streamline the inventory of fishes in this part of Sundaland. Owing to the lack of available checklist for estimating the taxonomic coverage of the present study, a checklist was compiled based on online catalogs.
A total of 95 sites were visited and a library including 1049 DNA barcodes for 159 species was assembled. Nearest neighbor distance was 28-fold higher than maximum intra-specific distance on average and a DNA barcoding gap was observed. The list of species with DNA barcodes displayed large discrepancies with the checklist compiled here as only 36% and 60% of the known species were sampled in Java and Bali, respectively. This result was contrasted by a high number of new occurrences and the ceiling of the accumulation curves for both species and genera. Implications of the present studies for the ongoing inventory of the Java and Bali ichthyofauna are discussed.
v
RINGKASAN
HADI DAHRUDDIN. DNA Barcoding of the freshwater fishes from Java and Bali island, Indonesia. Dibimbing oleh BAMBANG SURYOBROTO, NICOLAS HUBERT dan ACHMAD FARAJALLLAH.
Diantara 899 spesies ikan air tawar yang dilaporkan dari hotspot keanekaragaman hayati Sundaland, hampir 50% adalah endemik. Integritas fungsional ekosistem perairan saat ini terancam oleh aktivitas manusia dan konversi lanskap yang menyebabkan penurunan populasi ikan di beberapa bagian dari Sundaland. Pulau Jawa, misalnya, mengalami pertumbuhan eksponensial dari populasi manusia mencapai 130 juta orang yang sekarang berbagi 130.000 km2. Persediaan ichthyofauna Jawa telah terputus dan pengetahuan taksonomi tersebar dalam literatur.
Penelitian ini menyediakan perpustakaan referensi DNA barcode untuk ikan perairan di daratan Pulau Jawa dan Bali dengan tujuan untuk merampingkan persediaan ikan di bagian Sundaland. Karena kurangnya checklist yang tersedia untuk memperkirakan cakupan taksonomi dari penelitian ini, checklist disusun berdasarkan katalog online.
Sebanyak 95 situs yang dikunjungi dan perpustakaan termasuk 1.049 DNA barcode untuk 159 spesies berkumpul. Jarak tetangga terdekat adalah 28 kali lipat lebih tinggi dari jarak rata-rata maksimum intra-spesifik dan kesenjangan DNA barcode diamati. Daftar spesies dengan DNA barcode ditampilkan perbedaan besar dengan daftar yang disusun di sini karena hanya 36% dan 60% dari spesies yang dikenal yang terkoleksi masing-masing di Jawa dan Bali. Hasil ini kontras dengan sejumlah besar kejadian baru dan grafik kurva akumulasi untuk kedua spesies dan genera. Implikasi dari studi untuk persediaan berkelanjutan dari ikhtiofauna Jawa dan Bali ini dibahas.
vi
© Copy Right owned by IPB, year 2015
All right reserved
vii
HADI DAHRUDDIN
GRADUATE SCHOOL
BOGOR AGRICULTURAL UNIVERSITY
BOGOR
2015
ThesisIn partial fullfilment of Master degree in Animal Bioscience
Faculty of Mathematics and Natural Science
viii
i
FOREWORDS
All praise to ALLAH SWT for all the hope and give I have got this far.
My study and thesis research would not have been accomplished without the help of many people.
Special thanks to Dr Drs Bambang Suryobroto, Nicolas Hubert PhD and Dr Ir Achmad Farajallah MSi as supervisory committee, for all guidance and encouragement as well as invaluable academic advices for the whole period of my study and research.
Thanks to Biro Organisasi Kepegawaian – LIPI for Karyasiswa LIPI, Bidang Zoologi and Pusat Penelitian Biologi – LIPI, staff of Laboratorium Reproduksi, Iktiologi, Genetika, Prof Dr Rosichon Ubaidillah MPhil, Prof Dr Gono Semiadi, Ir Wirdateti MSi, Dr Wartika Rosa Farida and Umar Sofyani in Bidang Zoologi, Pusat Penelitian Biologi – LIPI.
I sincerely thanks to Mrs Purwanti and H Agus Putrajaya (H Tino) thanks for support and friendship. I also thanks to my friends Arief Aditya Utama, Rena Tri Hernawati, Mihwan Sataral, Novita Anggraeni and all my friends in BSH 2013.
Further, I am highly indebted to my beloved family parents, Alm H Muslim bin H Kosim (my father), Hj Rosidah (my Mother), my brothers and sister are Mohammad Sopyan, Yani Maryani, Dede Nurjaya and my nephew-niece for their love and support who always inspire and encourage me for higher education. I express my gratitude to Maryati (my wife), Aditya Ramadhan D and Halya Khairunnisa D (my son and daughter) for their support and patience to rarely together.
May this paper is usefull for all who study on DNA barcoding of fishes.
Bogor, August 2015
ii
CONTENT LIST
LIST OF FIGURES vi
LIST OF TABLES vi
INTRODUCTION 1
MATERIAL AND METHODS 2
Specimen collections and identification 2
Assembling a checklist of the Javanese and Balinese freshwater fishes 2
DNA barcode sequencing 3
DNA barcode analysis 4
RESULTS 4
DNA barcode analyses and BIN splits 4
Species diversity and exotic species 7
DISCUSSIONS 10
CONCLUSIONS 13
REFERENCES 13
iii
LIST OF FIGURES
1 Map of collection sites 2
2 Distribution of genetic distances below and above species boundaries 5 3 Accumulation curves and size class distributions of the 159 species 9
LIST OF TABLES
1 Summary statistics of the genetic distances (K2P) 5
2 Summary statistics of the 18 species 5
1
1)
A biodiversity hotspot is an area presenting an exceptional concentration of endemic species and facing an exceptional loss of ecological habitats (Myers 1988, 1990; Myers et al. 2000)
2)
Cryptic species refers to a lineage that is morphologically indistinguishable from its sister-species but have achieved reproductive isolation (Bickford et al. 2006)
INTRODUCTION
Among the 25 biodiversity hotspots1) identified worldwide for their remarkable levels of endemism and anthropogenic threats, four are observed in Southeast Asia (SEA), including Indo-Burma (Thailand, Cambodia, Laos, Vietnam and Myanmar), Sundaland (Malaysia, Indonesia), Wallacea (Indonesia) and Philippines (Myers et al. 2000). The Sundaland and Indo-Burma hotspots exhibit the highest species richness and endemism in SEA that rank them as some of the world most speciose together with the Brazil’s cerrado or West African Forests (Lamoureux et al. 2006). These high levels of endemism and species richness may be seen as the result of the complex history of the Indo-Australian Archipelago (IAA) that has been repeatedly fragmented during its ontogenesis through tectonic events (Lohman et al. 2011) and eustatic fluctuations (Woodruff 2010). The Sundaland hotspot, however, is currently one of the world’s most endangered and aquatic ecosystems exemplify the diversity of anthropogenic pressures faced by its biotas (Hoffman et al. 2010). Their functional integrity is currently jeopardized by interactions among ecological (e.g. mining, logging, land conversion, organic and inorganic contaminations) and biotic perturbations (e.g. alien species, overexploitation by inland fisheries), resulting in the destruction of foraging and spawning grounds and the decline of populations (Schilthuizen et al. 2005; Clements et al. 2006; Fraser 2006; Clements et al. 2008; Normile 2010; Sodhi et al. 2010).
Indonesia exhibits one of the world highest densities of freshwater fish species (i.e. 0.6 species per 1000 km2) ahead of Brazil (0.37 species per 1000 km2) and the Democratic Republic of Congo (0.48 species per 1000 km2) (Hubert et al.
in press). In Sundaland, nearly 900 species and 430 endemics have been reported, a diversity that accounts for 74% and 48% of the global and endemic diversity, respectively (Hubert et al. in press). Among the three major islands of Sundaland, Java exhibits the highest density of species with 1.7 species per 1000 km2 (ca. 213 species) ahead of Kalimantan (1.2 species per 1000 km2 for a total of 646 species) and Sumatra (1.7 species per 1000 km2 for a total of 460 species). During the last decades, the exponential growth of the human population in Java – 130 millions of people sharing 130,000 km2 - had dramatic consequences on Javanese ecosystems and Javanese biotas are currently some of most threaten in Sundaland.
2
De Bruyn et al. 2013). The objective of the present study is to provide a DNA barcode reference library of the freshwater fishes of Java and Bali islands with the aim to streamline the ongoing inventory of the Javanese and Balinese ichthyofaunas and to promote more sustainable practices for further taxonomic studies (Hubert & Hanner 2015). The checklist of the Javanese and Balinese freshwater fishes has been assembled from several online catalogs and implications of the present study on the inventory of the Java and Bali ichthyofauna are discussed.
MATERIAL AND METHODS
Specimen collections and identifications
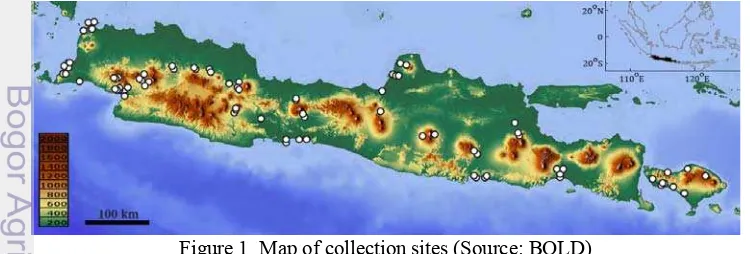
A total of 3310 specimens, including 163 species, 110 genera and 53 families, have been collected across 95 sites in Java and Bali islands between November 2012 and May 2015 (Figure 1). Specimens were captured using various gears including electrofishing, seine nets, cast nets and gill nets across sites encompassing the diversity of freshwater lentic and lotic habitats from outlets (i.e. sea level), floodplains, lakes and ponds to upstream tributaries (i.e. 1068m). Specimens were identified following available monographs (Kottelat et al. 1993; Rachmatika 2003; Larson 2009, 2010; Keith et al. 2010, 2013) and species names were further validated based on several online catalogs (Froese & Pauly 2011; Eschmeyer & Fricke 2014;). Specimens were photographed, individually labeled and voucher specimens were preserved in a 5% formalin solution. A fin clip or a muscle biopsy was taken for each specimen and fixed in a 96% ethanol solution for further genetic analyses. Both tissues and voucher specimens were deposited in the national collections at the Muzeum Zoologicum Bogoriense (MZB) in the Research Centre for Biology (RCB) from the Indonesian Institute of Sciences (LIPI).
Figure 1 Map of collection sites (Source: BOLD)
Assembling a checklist of the Javanese and Balinese freshwater fishes
3
2011) and Eschmeyer catalog of fishes (Eschmeyer & Fricke 2014) as detailed in Hubert and colleagues (Hubert et al. in press) Occurrences were further refined based on available monographs (Kottelat et al. 1993; Kottelat 2013). This checklist was used to estimate the taxonomic coverage of the present DNA barcoding campaign and flag potential new occurrences. Additional information was included as follows: (1) authors of the original description, (2) maximum observed length, (3) type of length measurement, (4) status of the species namely native or introduced, (5) source references for the distribution, (6) status of the distribution including endemic, occurring in other countries or original distribution range for introduced species, (7) occurrence in Java, (8) potential new occurrence in Java, (9) occurrence in Bali, (10) potential new occurrence in Bali. The database is provided as an online supplementary material.
DNA barcode sequencing
A total of 1406 specimens were selected for sequencing in order to cover as much as possible of: (1) the intra-specific genetic diversity by selecting specimens throughout the occurrence range, (2) the ontogenetic stages for each species by including juveniles, sub-adults and adults. Genomic DNA was extracted by a Qiagen DNeasy 96 tissue extraction kit following the manufacturer's specifications. The standard 652-bp segment from the 5’ region of the cytochrome oxidase I gene (COI) was amplified using primer cocktail C_FishF1t1/ C_FishR1t1 including a M13 tails are M13F-5ʹ TGTAAAACGACGGCCAGT3ʹ and M13R-5ʹCAGGAAACAGCTATGAC3ʹ (Ivanova et al. 2007). PCR amplifications were done on a Veriti 96-well Fast thermocycler (ABI-AppliedBiosystems) with a final volume of 10.0μl containing 5.0μl Buffer 2X, 3.3μl ultrapure water, 1.0μl each primer (10μM), 0.2μl enzyme Phire® Hot Start II DNA polymerase (5U) and 0.5μl of DNA template (~50 ng). Amplifications were conducted as follow: initial denaturation at 98°C for 5 min followed by 30 cycles denaturation at 98°C for 5s, annealing at 56°C for 20s and extension at 72°C for 30s, followed by a final extension step at 72°C for 5 min. The PCR products were purified with ExoSap-IT® (USB Corporation, Cleveland, OH, USA) and sequenced in both directions. Sequencing reactions were performed using the “BigDye® Terminator v3.1 Cycle Sequencing Ready Reaction” and sequencing was performed on the automatic sequencer ABI 3130 DNA Analyzer (Applied Biosystems).
4
DNA barcode analysis
DNA sequence divergence was calculated using the Kimura 2-parameter (K2P) model (Kimura 1980). The mid-point rooted Neighbour-Joining (NJ) tree of K2P distances was constructed to provide a graphic representation of the species divergence as implemented in the Sequence Analysis module of BOLD (Ratnasingham & Hebert 2007). Sequence divergence was considered below and above species boundaries by calculating the maximum intra-specific distance and the distance to the closest phylogenetic neighbor in the data set. The distribution of both distances was examined through sequence divergence class of 1% in order to check for a potential overlap between intra-specific and inter-specific sequence divergence. We further checked for a DNA barcoding gap in our data (Meyer & Paulay 2005). Instead of considering potential overlap in the distribution of sequence divergences, we examined the relationships between the maximum intra-specific distance and the distance to the nearest neighbor as it display potential overlap on an individual basis considering potential overlap for each species (Blagoev et al. 2015). Sequence divergence within species, and the potential occurrence of cryptic diversity, was further explored through the Refined Single Linkage (RESL) algorithm to reach decision on the number of Operational Taxonomic Units (OTUs) referenced as Barcode Index Numbers (BIN) in BOLD (Ratnasingham & Hebert 2013).
The taxonomic coverage of the present DNA barcoding campaign was estimated according to the checklist assembled here and its completeness was further explored through the accumulation curve analysis implemented in the Sequence Analysis module in BOLD (Ratnasingham & Hebert 2007). Accumulation curves were established independently for species and genera across 100 iterations. The taxonomic coverage was further explored through the distribution of the percent of sampled and non-sampled species across 10cm size class for euryhaline and amphidromous or primary freshwater families independently.
RESULTS
DNA barcode analyses and BIN splits
A total of 1,049 sequences belonging to 159 species, 107 genera and 50 families were successfully obtained. All the sequences were above 500bp of length and no codon stops were detected suggesting that the DNA barcodes collected represent functional coding regions. Although the cocktail of primers failed to amplify 357 specimens (i.e. 25%), they were effective in amplifying and sequencing 159 of the 162 species sampled (i.e. 98%) as no DNA barcodes were recovered for only three species, including Lethrinus fulviflamma, Megalops cyprinoides and an unidentified South American Loricariid assigned to the genus
Ancistrus.
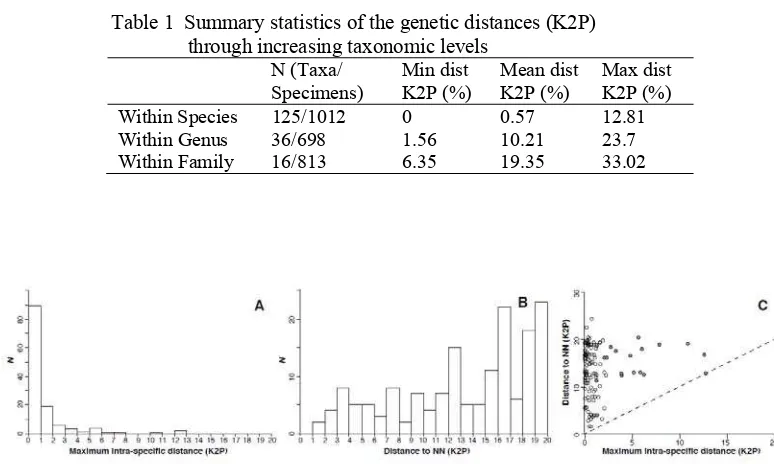
Intra-specific distances ranged from 0 to 12.81% and averaged 0.57%, while inter-specific distance within genus was 18-fold higher, ranging from 1.56 to
5
Table 1 Summary statistics of the genetic distances (K2P) through increasing taxonomic levels
Figure 2 Distribution of genetic distances below and above species boundaries
23.7% and averaging 10.21% (Table 1). Although the distribution of the maximum intra-specific distance and the distance to the nearest neighbor overlapped (Figure 2A & 2B), nearest neighbor distances were 28-fold higher on average than maximum intra-specific distances. Their relationship indicated that maximum intra-specific distances only exceeded nearest neighbor distance in a single species pair and a barcoding gap was generally observed (Figure 2C). Several species exhibited high maximum intra-specific distances and BIN counts were higher that species count in 18 cases (Table 2). The highest BIN divergences were observed in Eleotris fusca with 12.81% between two BINs and Giuris margaritacea with 12.56% between two BINs. The lowest BIN divergences were observed in Acentrogobius caninus (two BINS, 1.58%) and Trichopodus trichopterus (two BINS, 1.2%). The highest number of BIN was observed in
Channa gachua with 5 BINS with a maximum divergence of 5.63% (Table 2).
Table 2 Summary statistics of the 18 species
No. Family Species N of BIN
Max dist (K2P) % BIN
*)
1. Gobiidae Acentrogobius caninus 2 1.58 BOLD:ACE4188
BOLD:ACT1041
2. Cyprinidae Barbodes binotatus 3 5.13 BOLD:ACP5712
BOLD:ACP6025
BOLD:ACP6290
3. Eleotridae Belobranchus belobranchus 2 3.82 BOLD:ACQ5484
BOLD:ACQ5485
4. Channidae Channa gachua 5 5.63 BOLD:ACQ0290
6
BOLD:ACQ0292
BOLD:ACQ6939
BOLD:ACQ6940
5. Clariidae Clarias gariepinus 2 2.03 BOLD:AAB2256
BOLD:ACF4787
6. Hemiramphidae Dermogenys pusilla 3 2.28 BOLD:ACH7708
BOLD:ACH7709
BOLD:ACT1438
7. Eleotridae Eleotris fusca 2 12.81 BOLD:AAF0108
BOLD:ACQ5280
8. Eleotridae Eleotris melanosoma 2 6.2 BOLD:AAF0109
BOLD:AAK9481
9. Gerreidae Gerres filamentosus 2 10.83 BOLD:AAC0381
BOLD:AAY1477
10. Eleotridae Giuris margaritacea 2 12.56 BOLD:AAV6427
BOLD:ACP9929
11. Sisoridae Glyptothorax platypogon 5 5.99 BOLD:AAY1028
BOLD:ACP5850
BOLD:ACP5898
BOLD:ACP6223
BOLD:ACP6224
12. Cobitidae Lepidocephalichthys hasselti 2 3.25 BOLD:ACT2693
BOLD:ACT6514
13. Mastacembelidae Macrognathus maculatus 4 3.87 BOLD:ACT1648
BOLD:ACT1649
BOLD:ACT1650
BOLD:ACT1890
14. Synbranchidae Monopterus albus 2 7.83 BOLD:AAF8880
BOLD:ACT5080
15. Adrianichthyidae Oryzias javanicus 2 2.71 BOLD:ACT2454
BOLD:ACT6896
16. Gobiidae P. argentilineatus 2 5.82 BOLD:AAY1920
BOLD:ACQ9240
17. Cyprinidae Rasbora lateristriata 2 1.79 BOLD:ACQ7159
BOLD:ACQ7160 18. Osphronemidae Trichopodus trichopterus 2 1.2 BOLD:AAE8555
BOLD:AAW0021
*)
7
Species diversity and exotic species
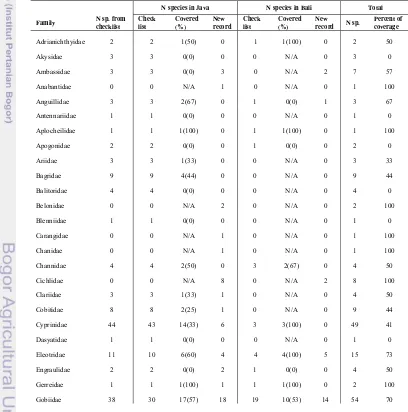
The checklist of the freshwater fishes of Java and Bali yielded a total of 227 species belonging to 181 genera and 66 families among which, 216 and 40 have been reported from Java and Bali, respectively (Table 3). The species list obtained from the present DNA barcoding campaign, however, poorly matched the checklist compiled from online catalogs. Among the 159 species of the reference library, 85 species have been previously reported from Java and Bali while 74 species correspond to new records for both islands. In Java, DNA barcodes of only 77 species were recovered of the 227 species previously reported (i.e. 36%) while 75 species with DNA barcodes correspond to new records, increasing the species richness of Java by 130%. A similar trend is observed for Bali as among the 40 species previously reported, DNA barcodes were recovered for 24 species (i.e. 60%) while 34 species with DNA barcodes correspond to new records, increasing the diversity by 185%.
Table 3 Summary statistics per families of the taxonomic coverage
9
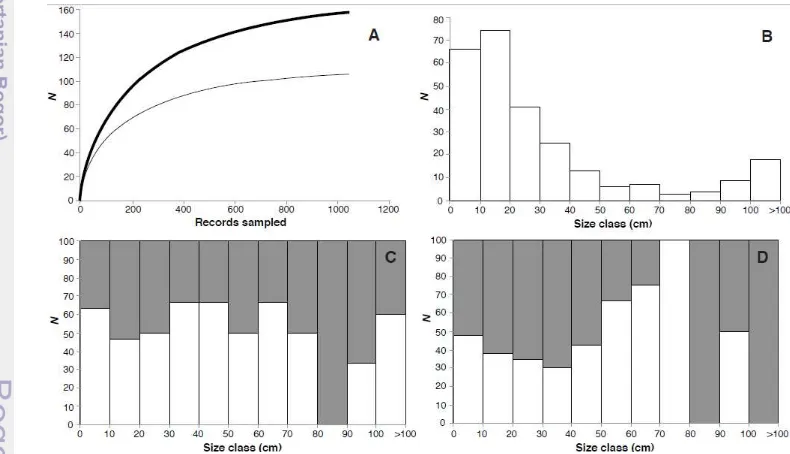
The accumulation curves displayed an asymptotic trend indicating that the present sampling was representative of the Java and Bali ichthyofauna, whatever the taxonomic level considered (Figure 3A). We further examined the distribution of the taxonomic gap in the present library through size class of 10cm. The Javanese and Balinese ichthyofauna are dominated by species smaller than 20cm, representing nearly 70% of the overall species pool (Figure 3B). The distribution of the taxonomic gap through size class varied between euryhaline or amphidromous and primary freshwater families (Figure 3C & 3D). A poor taxonomic coverage was recovered at the largest size classes for primary freshwater family (Figure 3D), as 12 of the 19 species exceeding 70cm of maximum length were not sampled (i.e. 73%). Although, nearly 45% of the largest species (i.e. >70cm) for euryhaline and amphidromous families were not sampled, the taxonomic coverage was more evenly distributed across size classes, excepting the 80-90cm size class with a single species that was not sampled (Figure 3C). The influence of species size on taxonomic coverage, however, was not significant either for euryhaline and amphidromous families (2=6.22; p=0.79) or primary freshwater families (2=11.38; p=0.33), despite that more heterogeneity was observed for the later.
Figure 3 Accumulation curves and size class distributions of the 159 species
10
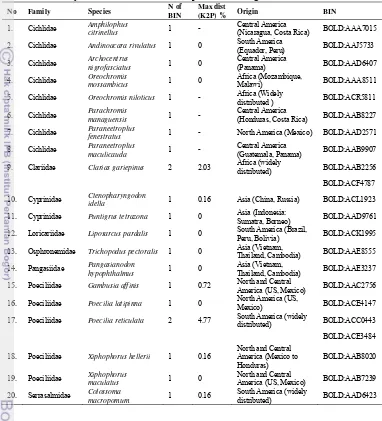
5 species respectively. Among the 20 introduced species, 4 species originate from South America, 9 from North and Central America, 3 from Africa and 4 from Asia.
Table 4 Summary statistics of the 20 exotic species including the number of BIN
No Family Species N of
(Nicaragua, Costa Rica) BOLD:AAA7015
2. Cichlidae Andinoacara rivulatus 1 0 South America
(Equador, Peru) BOLD:AAJ5733
5. Cichlidae Oreochromis niloticus 1 - Africa (Widely
distributed ) BOLD:ACR5811
6. Cichlidae Parachromis
managuensis 1 -
Central America
(Honduras, Costa Rica) BOLD:AAB8227
7. Cichlidae Paraneetroplus
fenestratus 1 - North America (Mexico) BOLD:AAD2571
8. Cichlidae Paraneetroplus
maculicauda 1 -
Central America
(Guatemala, Panama) BOLD:AAB9907
9. Clariidae Clarias gariepinus 2 2.03 Africa (widely
distributed) BOLD:AAB2256
BOLD:ACF4787
10. Cyprinidae Ctenopharyngodon
idella 1 0.16 Asia (China, Russia) BOLD:ACL1923
11. Cyprinidae Puntigrus tetrazona 1 0 Asia (Indonesia:
Sumatra, Borneo) BOLD:AAD9761
12. Loricariidae Liposarcus pardalis 1 0 South America (Brazil,
Peru, Bolivia) BOLD:ACK1995
13. Osphronemidae Trichopodus pectoralis 1 0 Asia (Vietnam,
Thailand, Cambodia) BOLD:AAE8555
14. Pangasiidae Pangasianodon
hypophthalmus 1 0
Asia (Vietnam,
Thailand, Cambodia) BOLD:AAE3237
15. Poeciliidae Gambusia affinis 1 0.72 North and Central
America (US, Mexico) BOLD:AAC2756
16. Poeciliidae Poecilia latipinna 1 0 North America (US,
Mexico) BOLD:ACE4147
17. Poeciliidae Poecilia reticulata 2 4.77 South America (widely
distributed) BOLD:ACC0443
BOLD:ACE3484
18. Poeciliidae Xiphophorus hellerii 1 0.16
North and Central
America (US, Mexico) BOLD:AAB7239
20. Serrasalmidae Colossoma
macropomum 1 0.16
South America (widely
distributed) BOLD:AAD6423
DISCUSSION
11
intra-specific maximum distances suggesting that the present library is useful for the identification of Javanese and Balinese freshwater fishes. The average distance among congeneric, however, was 18-fold higher than the average intra-specific distance (0.57% vs. 10.21%), a range lower than that observed for maximum intra-specific and nearest neighbor distances. This difference was not unexpected considering the geographic focus of the present study. Nearest neighbor distances were estimated based on a geographically focused sampling. Considering that the Java and Bali islands include 227 species of the 900 species in Sundaland, the closest phylogenetic relatives have been probably sampled in only a few cases, thereby inflating estimates of nearest neighbor distances. This observation is also consistent with the importance of allopatric speciation during the diversification of Sundaland ichthyofauna as a consequence of the Pleistocene eustatic fluctations (Voris 2000; Nguyen et al. 2008; Woodruff 2010; De Bruyn et al. 2013). Although the barcoding gap was large in many species, expanding the spatial coverage of the present library will yield an increasing amount of closely related species, calling for its reassessment based on a more comprehensive spatial and taxonomic sampling. Along the same line, expanding the spatial coverage may be expected to reassess upward maximum intra-specific distances as previously demonstrated (Bergsten et al. 2012), particularly in fragmented landscapes (Geiger et al. 2014). Considering that very large maximum intra-specific distances were observed at the island level, even in numerous species consisting of a single BIN, the bias toward underestimated intra-specific distances may be high when incorporating a more comprehensive coverage of the distribution range for species straddling across the islands of Sundaland. The extent of this bias, however, is tightly linked to the dynamic that generated these high levels of intra-specific genetic diversity. If intra-specific divergence result from admixtures after secondary contacts of ancient populations previously isolated in allopatry, the bias may be limited. If intra-specific divergence results of the isolation of populations throughout fragmented landscapes, this bias may be expected to be high. Considering the intricate history of merging and isolation of populations, as a consequence of the Pleistocene eustatic fluctuations (Voris 2000; Woodruff 2010), both dynamics are likely to be involved and warrant further assessment of the barcoding gap at larger spatial scales in Sundaland. This hypothesis happens to be likely considering that the present study revealed 18 species with several BINs displaying a large extent of maximum divergence (1.2% to 12.81%).
The present study provided surprising results if considering the taxonomic coverage. Among the 227 species previously reported from Java and Bali, only 36% and 60% were sampled, respectively. This observation is dramatically contrasted by the 74 new records, among which, 54 likely correspond to native species. Considering that most native species in Java and Bali correspond to old descriptions and that no comprehensive inventories of the Java and Bali ichthyofauna have been conducted during the last decade, new records were not unexpected, particularly for exotic species.
12
Archocentrus nigrofasciatus, Puntigrus tetrazona) or aquaculture trade (e.g. Oreochromis spp., Pangasianodon hypophthalmus, Clarias gariepinus). Considering that Indonesia rank as one of the major contributor of the international ornamental fish trade (Ling & Lim 2005), this result highlights that avoiding escaping from fish farms or releasing in nature by fish hobbyist is challenging, particularly for species with high adaptive abilities in terms of breeding such as Oreochromis spp., Xiphophorus spp. or Poecilia spp. This situation is further amplified by the lack of knowledge by local populations of the geographic origin of most ornamental fish species traded in Indonesia and the impact of artificial introduction of exotic species. During the present survey, restocking with exotic species for recreational purposes was frequently observed in both Java (e.g. Lake Rawa Pening) and Bali (e.g. Lake Batur).
The observation of 54 new occurrences of species with no obvious economic interest for the ornamental trade is more challenging in terms of basic knowledge about the taxonomic composition of the Java and Bali ichthyofauna. This is particularly evident considering that this high number of new occurrences is drastically contrasted by the poor taxonomic coverage of the present campaign for the previously reported species according to online catalogs. Identifications were performed independently by several of the co-authors based on available monographs and later cross validated, including based on DNA barcode data available in BOLD. Misidentifications are unlikely to account alone for this apparent discrepancy, an assertion further supported by the asymptotic trend of the accumulation curve for both species and genera. Among the 16 species endemic of Java, for instance, only 3 were sampled, including Nemacheilus chrysolaimos, Rasbora aprotaenia and Sicyopterus parvei. By contrast, the two endemic species of Bali were sampled, (i.e. Lentipes whittenorum and Rasbora baliensis) as well as the three species endemic of Java and Bali, (i.e. Lentipes ikeae, Sycopus rubicundus and Stiphodon aureofuscus). The validity of several endemic species of Java has been previously discussed as a substantial proportion of them correspond to old descriptions based on a single specimen such as Barbodes platysoma, Mystus abbreviates, Ompok javanesis, Puntius aphya and Puntius bramoides (Kottelat 2013; Eschmeyer & Fricke 2014). The contrasted coverage of the campaigns conducted in Java and Bali further question their validity as sampling have been conducted nearby the type locality for several of them. Nomenclatural issues, however, are not sufficient per se to account for the large gap in the present taxonomic coverage and extirpation are also likely considering the exponential increase of human populations, and associated anthropogenic perturbations, in Java. Despite that the influence of species maximum size on taxonomic coverage was not significant, either for euryhalin and amphidromous or primary freshwater families, many large-sized and emblematic primary freshwater species are missing from Java, as for instance Pangasius djambal
(90cm of SL), Chitala chitala (122cm of SL), Chitala lopis (150cm of SL),
Bagarius bagarius (200 cm of TL), Wallago attu (240cm of TL), Tor tambra
(100cm of TL) and Tor soro (100cm of TL). Considering that several inland fisheries have been visited several times during the course of the study, including the Mojokerto fish market aggregating fisheries of the largest Javanese river (i.e.
13
Java is derived from the early ichthyological exploration of Javanese inland waters several decades or centuries ago (Roberts 1993).
CONCLUSIONS
The present study highlights the difficulty to develop accurate DNA barcode reference libraries in Sundaland. Despite two centuries of ichthyological exploration of the inland waters of Java, the build up of the taxonomic knowledge has been scattered in the literature and as a consequence, the taxonomy of Javanese fishes has been accessible to only but a few specialists (Kottelat 2013). Considering the large discrepancies between the checklist established here and those available on online catalogs, the inventory of Javanese fishes is still far from comprehensive and is currently plagued by uncertainties in the validity and occurrence of many species. The development of this DNA barcode library will allow more researchers to explore the ichthyodiversity in this part of Sundaland, what will without doubt help refine the checklist of Javanese fishes and probably shed a new light on the validity of the endemic species of Java. The Sundaland ichthyofauna is one of the world’s most endangered and establishing accurate checklist of the inland species of its major islands is an absolute priority. This library is a primer to that end.
REFERENCES
Bergsten J, Bilton DT, Fujisawa T, Elliott M, Monaghan MT, Balke M, Hendrich L, Geijer J, Herrmann J, Foster GN et al. 2012. The effect of geographical scale of sampling on DNA barcoding. Systematic Biology 61:851-869. Bickford D, Lohman DJ, Sodhi NS, Ng PKL, Meier R, Winker K, Ingram KK,
Das I. 2006. Cryptic species as a window on diversity and conservation.
TRENDS in Ecology and Evolution 22(3):148-155.
Blagoev GA, DeWaard JR, Ratnasingham S, DeWaard SL, Lu L, Robertson J, Telfer AC, Hebert PDN. 2015. Untangling taxonomy: a DNA barcode reference library for Canadian spiders. Molecular Ecology Resources. 15(5):doi.10.1111/1755-0998.12444.
Blanchet S, Grenouillet G, Beauchard O, Tedesco PA, Leprieur F, Dürr HH, Busson F, Oberdorff T, Brosse S. 2010. Non-native species disrupt the worldwide patterns of freshwater fish body size: implications for Bergmann's rule. Ecology Letters 13:421-431.
Clements R, Ng PKL, Lu XX, Ambu S, Schilthuizen M, Bradshaw CJA. 2008. Using biogeographical patterns of endemic land snails to improve conservation planning for limestone karsts. Biological Conservation
141:2751-2764.
14
De Bruyn M, Rüber L, Nylinder S, Stelbrink B, Lovejoy NR, Lavoué S, HeokHui T, Nugroho E, Wowor, D, Ng PKL et al. 2013. Paleo-drainage basin connectivity predicts evolutionary relationships across three Southeast asian biodiversity hotspots. Systematic Biology 62:398-410.
Eschmeyer WN, Fricke R. 2014. Catalog of fishes - electronic version. [internet]. [Accessed updated on 2014 October 6]. In: Sciences CAo, San Francisco. Fraser S. 2006. Threats to biodiversity. In: Marshall AJ, Beehler BM, editors. The
ecology of Indonesia. Singapura (SNG): Periplus Editions. 1199-1229 pp. Froese R, Pauly D. 2011. Fishbase - Worldwide web electronic publication.
[internet]. [Accessed on 2011 June 6]. Avalaible in
http://www.fishbase.org.
Geiger MF, Herder F, Monaghan MT, Almada V, Barbieri R, Bariche M, Berrebi P, Bohlen J, Casal-Lopez M, Delmastro GB. et al. 2014. Spatial heterogeneity in the Mediterranean Biodiversity Hotspot affects barcoding accuracy of its freshwater fishes. Molecular Ecology Resources 14:1210-1221.
Hoffman M, Hilton-Taylor C, Angulo A, Böhm M, Brooks TM, Butchart SHM, Carpenter KE, Chanson J, Collen B, Cox NA. et al. 2010. The impact of Conservation on the status of the world's vertebrates. Science 330:1503-1509.
Hubert N, Hanner R. 2015. DNA barcoding, species delineation and taxonomy: a historical perspective. DNA Barcodes. In press.
Hubert N, Kadarusman, Wibowo A, Busson F, Caruso D, Sulandari S, Nafiqoh N, Rüber L, Pouyaud L, Avarre JC. et al. DNA barcoding Indonesian freshwater fishes: challenges and prospects. DNA Barcodes. In press. Hubert N, Meyer CP, Bruggemann HJ, Guerin F, Komeno RJL, Espiau B, Causse
R, Williams JT, Planes S. 2012. Cryptic diversity in Indo-Pacific coral reef
fishes revealed by DNA barcoding provides new support to the centre of overlap hypothesis. PLoS ONE 7(3):e28987.
doi:10.1371/journal.pone.0028987.
Ivanova NV, Zemlak TS, Hanner RH, Hebert PDN. 2007. Universal primer cocktails for fish DNA barcoding. Molecular Ecology Notes 7:544–548.. Jaafar TNAM, Taylor MI, Nor SAM, De Bruyn M, Carvalho GR. 2012. DNA
barcoding reveals cryptic diversity within commercially exploited Indo-Malay Carangidae (Teleosteii: Perciformes). Plos One 7(11):e49623. doi:10.1371/journal.pone.0049623.
Kadarusman, Hubert N, Hadiaty RK, Sudarto, Paradis E, Pouyaud L. 2012. Cryptic diversity in Indo-Australian Rainbowfishes revealed by DNA barcoding: implications for conservation in a biodiversity hotspot candidate. PLoS One 7(7):e40627. doi: 10.1371 / journal.pone.0040627. Keith P, Marquet G, Gerbeaux P, Vigneux E, Lord C. 2013. Poissons et crustacés
d'eau douce de Polynésie. Paris (FR): Société Française d'Ichthyologie. Keith P, Marquet G, Lord C, Kalfatak D, Vigneux E. 2010. Poissons et crustacés
d'eau douce du Vanuatu. Paris (FR): Société Française d'Ichthyologie. Kimura M. 1980. A simple method for estimating evolutionary rates of base
15
Kottelat M. 2013. The fishes of the inland waters of Southeast Asia: a catalog and core bibliography of the fishes known to occur in freshwaters, mangroves and estuaries. The Raffles Bulletin of Zoology Supplement 27:1-663.
Kottelatt M, Whitten AJ, Kartikasari SN, Wirjoatmodjo S. 1993. Freshwater Fishes of Western Indonesia and Sulawesi. Singapore (SNG): Periplus Editions Limited.
Lamoureux JF, Morrison JC, Ricketts TH, Olson DM, Dinerstein E, McKnight M, Shugart HH. 2006. Global tests of biodiversity concordance and the importance of endemism. Nature 440:212-214.
Larson HK. 2009. Review of the gobiid fish genera Eugnathogobius and
Pseudogobiopsis (Gobioidei: Gobiidae: Gobionellinae), with descriptions of three new species. The Raffles Bulletin of Zoology 57:127-181.
Larson HK. 2010. A review of the gobiid fish genus Redigobius (Teleostei: Gobionellinae); with descriptions of two new species. Ichthyological Exploration of Freshwaters 21:123-191.
Leprieur F, Beauchard O, Blanchet S, Oberdorff T, Brosse S. 2007. Fish invasions in the world's river systems: when natural processes are blurred by human activites. PLos Biology 6:404-410.
Ling KH, Lim LY. 2005. The status of ornamental fish industry in Singapore.
Singapore J Pri Ind 32:59-69.
Lohman K, De Bruyn M, Page T, Von Rintelen K, Hall R, Ng PKL, Shih HT, Carvalho GR, Von Rintelen T. 2011. Biogeography of the Indo-Australian archipelago. Annual Review of Ecology, Evolution and Systematics
42:205-226.
Meyer C, Paulay G. 2005. DNA barcoding: error rates based on comprehensive sampling. PLoS Biology 3(12):2229-2238.
Milton M, Pierossi P, Ratnasingham S. 2013. Barcode of Life Data Systems Handbook. Ontario (CND): Biodiversity Institute of Ontario.
Myers N. 1988. Threatened biotas: “Hotspots” in tropical forests. The Environmentalist 8(3):187-208.
Myers N. 1990. The Biodiversity Challenge: Expanded Hot-Spots Analysis. The Environmentalist 10(4):243-256.
Myers N, Mittermeier RA, Mittermeier CG, DaFonseca GAB, Kent J. 2000. Biodiversity hotspots for conservation priorities. Nature 403:853-858. Nguyen TTT, Na-Nakorn U, Sukmanomon S, ZiMing C. 2008. A study on
phylogeny and biogeography of mahseer species (Pisces: Cyprinidae) using sequences of three mitochondrial DNA gene regions. Molecular Phylogenetics and Evolution 48:1223-1231.
Normile D. 2010. Saving forests to save biodiversity. Science 329:1278-1280. Pouyaud L, Sudarto, Paradis E. 2009. The phylogenetic structure of habitat shift
and morphological convergence in Asian Clarias (Teleostei, Siluriformes: Clariidae). J. Zool. Syst. Evol. Res. 47:344-356.
Rachmatika I. 2003. Fish fauna of the Gunung Halimun national park, West Java. Jakarta (ID): Biodiversity Conservation Project LIPI-JICA-PHKA.
Ratnasingham S, Hebert PDN. 2007. BOLD: the barcode of life data system (http://www.barcodinglife.org). Molecular Ecology Notes 7(3):355-364. Ratnasingham S, Hebert PDN. 2013. A DNA-based registry for all animal species:
16
Roberts TR. 1993. The freshwater fishes of Java, as observed by Kuhl and van Hasselt in 1820-23. Zoologische Verhandelingen 285:3-94.
Schilthuizen M, Liew TS, Bin Elehan B, Lackman-Ancrenaz I. 2005. Effects of karst forest degradation on pulmonate and prosobranch land snail communities in Sabah, Malaysian Borneo. Conservation Biology 19:949-954.
Smith MA, Fisher BL, Hebert PDN. 2005. DNA barcoding for effective biodiversity assessment of a hyperdiverse arthropod group: the ants of Madagascar. Phil. Trans. R. Soc. B. 360:1825–1834.
Sodhi NS, Koh LP, Clements R, Wanger TC, Hill JK, Hamer KC, Clough Y, Tscharntke T, Posa MRC, Lee TM. 2010. Conserving southeast asian forest biodiversity in human-modified landscapes. Biological Conservation
143:2375-2384.
Voris HK. 2000. Maps of Pleistocene sea levels in Southeast Asia: shorelines, river systems and time durations. Journal of Biogeography 27:1153-1167. Woodruff DS. 2010. Biogeography and conservation in Southeast asia: how 2.7
17