USING IMAGE PROCESSING AND QUANTITATIVE TECHNIQUE
TO DETERMINE THE ONSET OF GEAR FAILURE
TENGKU AHMAD HAFIZ BIN TENGKU DIN
SUPERVISOR DECLARATION
“I hereby declare that I have read this thesis and in my opinion, this thesis is sufficient in terms of scope and quality for the award of the degree of Bachelor
Mechanical Engineering (Plant and Maintenance)”
Signature: ...
Supervisor: DR. REDUAN MAT DAN
TECHNIQUE TO DETERMINE THE ONSET OF GEAR FAILURE
TENGKU AHMAD HAFIZ BIN TENGKU DIN
A thesis submitted to the Universiti Teknikal Malaysia Melaka
for the Bachelor of Mechanical Engineering in the
Faculty of Mechanical Engineering (Plant and Maintenance)
Faculty of Mechanical Engineering Universiti Teknikal Malaysia Melaka
DECLARATION
“I hereby declare that the work in this thesis is my own except for summaries and quotations which have been duly acknowledged.”
Signature: ...
Author: TENGKU AHMAD HAFIZ BIN TENGKU DIN
ACKNOWLEDGMENT
All Praise to Almighty Allah S.W.T for granting me confidence and determination in completing this work to its conclusion. Without His blessing and help, this thesis would not be completed successfully.
I am especially grateful to my beloved parents and family for their support in my studies throughout the three years.
I would like to highly praise my supervisor Dr. Reduan Mat Dan for his comprehensive guidance and constructive comments thorough advice, constant support and encouragement until completion of this thesis.
I would like to thank the staff of Universiti Teknikal Malaysia Melaka (UTeM), friends, colleagues and others for their assistance and support during the experiment.
ABSTRACT
ABSTRAK
TABLE OF CONTENT
CHAPTER TITLE PAGES
DECLARATION ii
DEDICATION iii
ACKNOWLEDGEMENT iv
ABSTRACT v
ABSTRAK vi
TABLE OF CONTENT vii
LIST OF TABLE xi
LIST OF FIGURE xii
NOMENCLATURE xiv
CHAPTER 1 INTRODUCTION
1.1 1.2 1.3 1.4
Background Problem Statement Objectives
Scope
CHAPTER 2 LITERATURE REVIEW
How gear generated wear debris Gear failure modes
Gear wear phenomena Classification of wear debris 2.7.1 Particle morphology 2.7.1.1 Particle shape
2.7.1.2 Quantitative basic shape analysis 2.7.1.3 Colour
2.7.1.4 Surface textures
Types of wear debris particles
General detecting particles techniques
5
CHAPTER 3 METHODOLOGY 3.1
CHAPTER 4 RESULT AND ANALYSIS 4.1
4.2
Introduction
4.1.1 Analysis of data
4.1.2 Assumptions in analysis
Quantitative measurement 4.2.1 Experimental result
32 32 33
CHAPTER 5 DISCUSSION Discussion on experimental work Discussion on result normalization
47 47 48 50
CHAPTER 6 CONCLUSION AND FUTURE WORK
6.1 Introduction 52
6.2 Achievement of objectives 52
6.3 Future work 54
REFERENCES 55
APPENDIX I
A simple MATLAB program for capturing images and establishing coordinates
58
APPENDIX II 60
APPENDIX III
Table App III-1: Experiment data wear rate for CHS Table App III-2: Experiment data wear rate for DLC Table App III-3: Experiment data wear rate for LCA
APPENDIX IV
GANTT CHART for PSM I GANTT CHART for PSM II
LIST OF TABLE
Wear particle shape and size descriptors Shape parameters
Effect colour with material compositions Relationship between type of particles with size and thickness ratio
Experiment data particles counts for CHS Experiment data particles counts for DLC Experiment data particles counts for LCA Images of gear damage and particle image for CHS
Images of gear damage and particle image for DLC
Images of gear damage and particle image for LCA
Measurement area, perimeter, roundness and size of the particle
LIST OF FIGURES
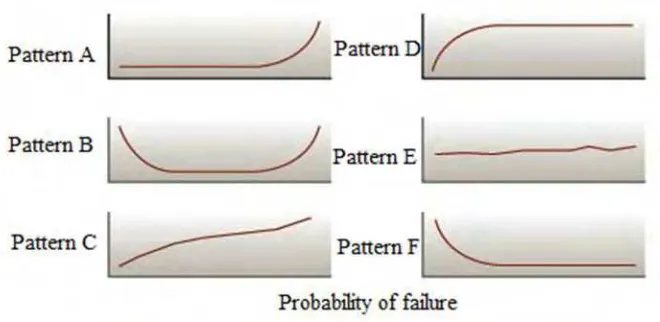
The six types of failure patterns Gear mesh contact points Part of the mesh cycle Types of gear wears failure Particle Morphology Chunk and slabs Sphere
Distorted smooth ovoid (pebbles) Platelets and flakes
Curls, spirals and slivers Rolls
Back to back oil test rig front view from front view Main component of test rig in schematic drawing NASA Dextron III Lubrication Oil
3-8
Debris image captured using Stereo Zoom Microscope Drag cursor to measure the longest length
Determination of the area of particle using AMS machinery Manager software
5200 Trivector Analyzer 52DV digital viscometer Misalignment device
Particle counts for carbon hardened steel versus time, hours by normalization method
Particle counts for diamond like coating versus time, hours by normalization method
Particle counts for low carbon alloy versus time, hours by normalization method
Gear setup Oil sump cover
NOMENCLATURE
WDA Wear Debris Analysis
LCA Low Carbon Alloy
DLC Diamond-like Coating Carbon
CHS Carbon Hardened Steel
CBM Condition Based Maintenance
CCD Charge Couple Device
REB Rolling Element Bearing
ATF Automatic Transmission Fluid
DC Direct Current
DV Digital Viscometer
LED Light Emitting Diode
CHAPTER 1
INTRODUCTION
1.1 BACKGROUND
comprehensive predictive maintenance program to monitor the signs of faults such as vibration analysis, thermography, wear debris analysis, oil analysis, ultrasonic testing and machine performance. Different condition monitoring techniques have their own advantages and disadvantages. Unfortunately, no single technique has been able to resolve all CBM requirements. Different of requirement in the plant is different based on selecting CBM techniques. The WDA technique has been developed in terms of wear debris size, shape, material composition, features of boundary and size distribution [5; 6]. The particles collected from lubricant oil are useful in machinery maintenance decisions for predicting and accessing machine condition. WDA is the most effective CBM strategy to detect and diagnosing the deterioration stage of machine component through the analysis of oil properties and wear particles. Furthermore, many good benefits can result from CBM practices when gear fault detection is preferred, although have not been applied widely in the industry due to lack of automation and time consuming. WDA can provide the detail of wear mode, wear severity, surface degradation rate and component source [7]. This motivates researcher to study the onset of gear failure related by using WDA.
1.2 PROBLEM STATEMENT
cause injury. Gear defect will further produce debris particles that are generated by wear processes. When the wear occurs, they can be classified as a type of failure occur by their shapes, sizes, edge details, colours, thickness ratios and surface textures. Wear debris is a characteristic of the condition under which it was formed and study of these wear particles can yield significant information about the state of the surface from which it is produced [5]. Wear is not only caused by two surfaces rubbing together, although it is a major cause. Wear condition is also due to vibration or multiple influence known as fatigue wear because of some other motion or external impact. Materials are lost from the surface of a component gear. Thus when wear occurs, it may not be able to be stopped, but it can be anticipated to a certain extent and action taken before wear-out [4].
1.3 OBJECTIVES
This research tries to accomplish the following objectives:
i. To use image processing to detect failure signs on wear debris particles generated from the gearbox.
ii. To use particle count for determining the onset failures of the gear.
1.4 SCOPE
i. Set up experimental work on back to back the gear test rig for collect wear debris particles.
ii. Use three types material of helical gear as tested gear, which is low carbon alloy (LCA), diamond-like carbon coating (DLC) and carbon hardened steel (CHS).
CHAPTER 2
LITERATURE REVIEW
2.1 INTRODUCTION
The research served in this thesis is principally based on theoretical and experimental. This chapter will review and discuss about generation and process of wear debris, wear debris analysis, wear mechanism, wear morphology and types of failure of gear. Furthermore, recognize how knowledge of wear debris features will help to monitor the health, condition and deterioration stage of component machine such as size, shape, material composition, features of the boundary and size distribution.
2.2 WEAR DEBRIS ANALYSIS
the condition and the health of the machine component by analysis shape, size, quantity and composition of particles. The particle characteristics are appropriately specific so that the operating wear modes within the machine may be determined and allowing prediction of the imminent behaviour of the machine [8]. WDA technique is even capable to determine wear from many processes namely sliding, rolling, rubbing and cutting wear. Every mechanism is producing a different morphology. Wear debris comes in a wide variety of sizes and shapes. Size wear debris may vary anywhere from a few microns to thousand microns.
2.3 WEAR DEBRIS GENERATION
Wear debris is a particle which have been shed or loss from the mechanical surface component [20]. Wear debris particle produced from the machine component like gears or bearing result of two surfaces rubbing, sliding or rolling together. Meanwhile the plastic flow or breakage occurs due excessive loading. It may also have some influences in developing a kind of wear. Wear debris generation is frequently illustrated based on a bathtub curve as shown in Figure 2.1. It is a statistical method used to demonstrate the general pattern of a machine system based on its operating time.
[10]. In the first period, also known as infant mortality it is decreasing rapidly of failure wear rate. This period is typically quite short interval. Wear is usually beneficial and provides an improvement for later running and particularly true for gears. Following the initial period the probability of failure is low and constant useful working life of the component for the normal life stage. At this period debris is produced quite small and minor in size and quantity. Lubrication is doing well in controlling the effect of wear of gears. The final stage is the disaster period because of the increasing failure rate. At this stage, fatigue starts to show with the result of large chunks of debris and increasing quantity of debris exponentially. The machine is so badly worn that there is serious misalignment and an overload of the component.
Figure 2-2: The six types of failure patterns

![Figure 2-1: The bathtub curve [9]](https://thumb-ap.123doks.com/thumbv2/123dok/506143.57174/23.595.176.491.527.743/figure-the-bathtub-curve.webp)