Abstract
The paper describes burst pressures of eight mild steel toriconical shells of laboratory scale. This is both a theoretical (numerical) and experimental study. All test models were initially loaded by external pressure until they buckled/collapsed. The toricones were subsequently internally pressurised until burst.
The details about the numerical process which simulates the two-stage loading profile, i.e., starting with buckling by external pressure being followed by re-loading using internal pressure for up to the burst, are given.
The paper concentrates on numerical procedure which allows computation of the burst pressure using extensive plastic straining as a possible superior approach. It is argued that burst pressure based on the excessive plastic straining is closer to reality than the alternative approach based on plastic instability. The ratio of experimental burst pressure to the finite element computed values was found to be [(1.35, 0.96), (0.89, 0.92), (0.93, 0.90), (1.07, 0.95)] for four nominally identical pairs, respectively. Alternative approach to the estimation of burst pressure, based on plastic instability, gives the above ratio as [(0.79, 0.83), (0.77, 0.76), (0.74, 0.74), (0.74, 0.75)]. Hence the plastic instability based burst significantly, and consistently, overestimated experimental values. The proposed algorithm gave safe predictions for two cases (1.35, 1.07) and in the remaining six the predictions were on unsafe side (0.96, 0.89, 0.92, 0.93, 0.90, 0.95) but the disparity was not as bad as for the plastic instability approach.
Keywords: buckling, collapse, burst, external pressure, internal pressure, steel
closures.
1 Introduction
Design of any structural element, or structure, is aimed at its safe performance during routine operation. Safe performance of pressure vessels, for example, is of
Paper 207
Toricones: Burst Pressures
J. B
ł
achut
1and O. Ifayefunmi
21
School of Engineering
University of Liverpool, United Kingdom
2
Faculty of Engineering Technology
Universiti Teknikal Malaysia Melaka, Malaysia
Civil-Comp Press, 2014
critical importance especially when they carry hazardous materials. In the latter situation, the magnitude of operational pressure is supplemented by an additional safety margin which can vary from application to application.
It is surprizing that little information is available on what might happen once pressure exceeds this supplemented safety margin. In this context the burst pressure is of great value from a practical point of view as it gives an indication of additional margin of safety for a single incremental loading. This is an important quantity, especially, at a design stage or at an emergency situation.
A number of studies which are relevant to the issue of burst pressure are available in the literature, and a brief summary can be found in reference 0. A procedure for numerical calculation of burst pressure, at tensile plastic instability for internally pressurized axisymmetric pressure vessels, has been developed in papers [2], [3], [4]. The proposed pressure is to be an upper bound to the burst pressure that could be achieved in real vessels. Whilst the failure mode caused by plastic instability has been studied analytically and experimentally, it is excessive plastic deformation which is a more probable mode of failure than bursting due to plastic instability - see reference [5]. A recent theoretical and experimental study into burst of internally pressurised domes can be found in 0. Here the burst pressure is based on excessive plastic deformation rather than on plastic instability. A series of calculations have been performed for mild steel shallow spherical caps, tested previously for buckling, and for torispherical heads tested previously for plastic loads. The latter were from mild steel. Also four torispheres were freshly machined from aluminium alloy AA6061-T1 to complement the series of tests. Hence burst tests were carried out on: six steel and four aluminium torispheres and six spherical caps. Computed burst pressures for steel spherical caps were between -21.1 % and -4.9% below experimental values. At the same time the errors between computed plastic instability pressures and the experiments were between +35.1% and +51.8% (overestimated experimental results). For steel torispheres the respective ranges of errors were: [+12.1%, +32.4%] and [+17.6%, 42.8%]. In aluminium torispheres the ranges were: [-0.4%, -14.0%] and [+12.7%, +20.8%]. It is seen here that the magnitudes of computed plastic instability pressures were always above experimental values for all tested models. Derivation of plastic instability load for internally pressurised stainless steel toroid, followed by burst tests of two models, can be found in [6], [7]. Seventeen, 45 litre, carbon steel toroidal tanks were burst-tested during qualifying procedure for the anticipated LPG usage [8], [9]. Water was the pressurisation media. Vessels burst when volume increased by about 11 %, and the standard deviation on average burst pressure of 8.56 MPa was about 0.220 MPa. The FE assessment of structural integrity was based on monitoring the maximum deflections at the apex and at outer equatorial plane. Other relevant work in this area can be found in [10], [11], [12].
were first buckled by external pressure. The next section briefly describes the tests with further details available in [13]. Subsequent parts of the paper detail numerical and experimental procedures leading to burst loads of toriconical vessel heads.
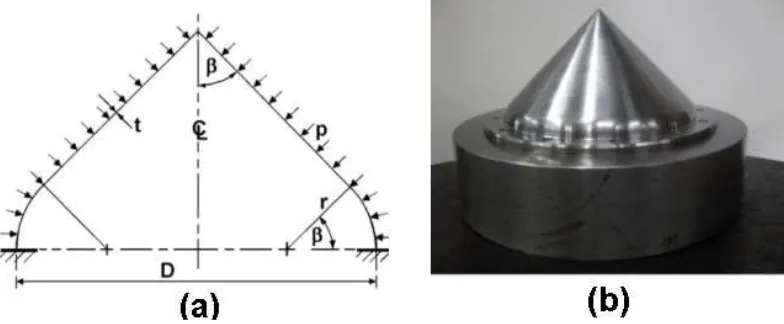
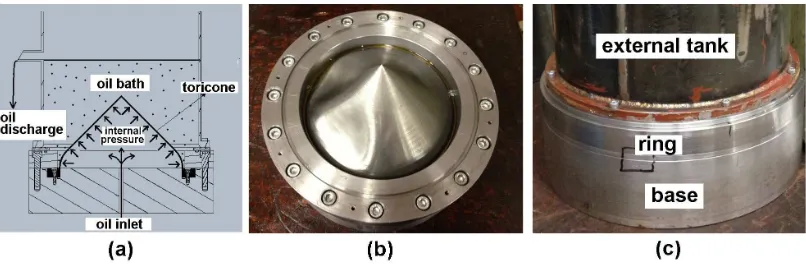
Figure 1: Geometry of a toriconical shell (a), and view of T2a model embedded into the base plate and before being bolted (b).
Model t D r/D
(mm) deg. T1, T1a 2.0 206.0 0.20 45.0
T2, T2a 2.0 206.0 0.10 45.0 T3, T3a 2.0 206.0 0.05 45.0 T4, T4a 2.0 206.0 0.0 45.0
Table 1: Nominal geometry of toriconical models (see Fig. 1 for notation).
2 Summary of buckling tests on externally pressurised
toricones
specimens had a number of lobes in the hoop direction, see Fig. 2. But the incipient buckling mode was not identified as shells were inside thick wall vessel.
Figure 2: Buckled models T1 and T1a.
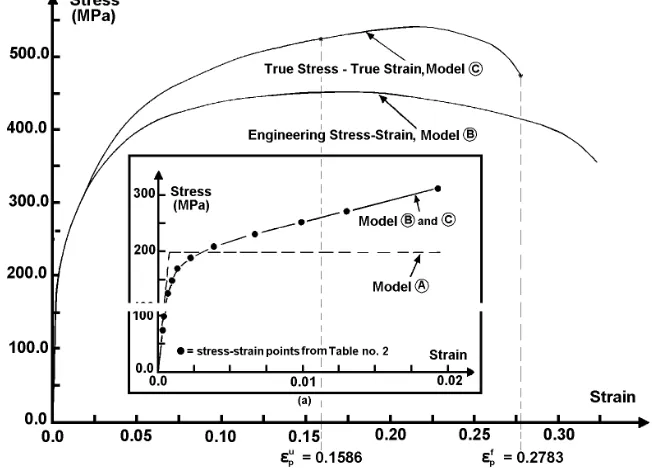
Material properties of the billet were established by testing round, 10 mm diameter and 200 mm long specimens cut along the billet length and in the perpendicular direction. Fig. 3 shows average engineering stress-strain curve obtained from experiments, and its true-stress true-strain equivalent. The properties of steel were established to be: Young’s modulus, E =198.56 GPa, Poisson’s ratio, ν = 0.28, and the yield point of material yp = 205.85 MPa (based on 0.2 % proof stress).
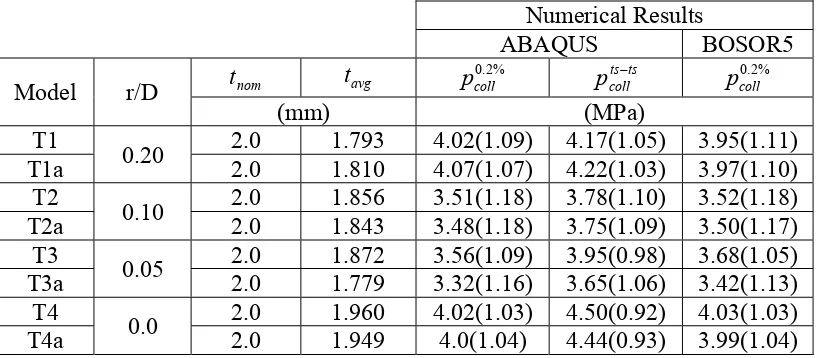
More details can be found in [14]. Comparison of experimental collapse pressures with numerically predicted values is given in Table 2. The latter were obtained using modelling in ABAQUS, ([15], S8R-shell elements), and BOSOR5, [16]. These analyses were based on overall average wall thickness and average geometry. Numerical estimates of buckling strength were also carried out using true-stress true-strain modelling of steel. It appears that the ‘0.2 % - yield’ gives safe estimates of buckling for all tested models. The ratio of experimental-to-computed collapse pressures ranges from 1.03 % to 1.18 % for ABAQUS and from 1.03 % to 1.18 % for BOSOR5. Measurements of geometry and wall thickness of all models were taken prior to buckling tests and analyses incorporating this data are to be carried out separately.
At the next stage, collapsed models were pressurised up to the burst. Prior to these tests, measurements of internal volume of collapsed models were carried out – as described next.
Table 2: Comparison of experimental collapse pressures with predictions given by ABAQUS and BOSOR5. Note: pcoll0.2% ≡ collapse pressure based on 0.2 % yield point and elastic perfectly plastic modelling of the stress-strain curve; pcolltsts ≡ collapse pressure based on true stress - true strain modelling; experimental-to-numerical ratios are in brackets.
3 Experimental burst pressures of buckled toricones
Fig. 4b. The measured change of volume allowed establishing the starting, deformed geometry for the subsequent FE calculations.
Initial design of toricones did not envisage their testing for burst by internal pressure. Changes had to be made to the way in which shells were to be fixed to the
Figure 4: Arrangements for measuring internal volume of buckled model, T1.
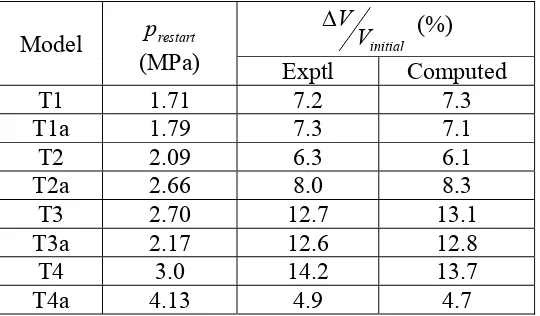
base in order to facilitate loading by substantial internal pressure. Heavy ring was designed, and manufactured, in order to clamp the collapsed models to a new base plate. Fig. 5a illustrates the test set up whilst Fig. 5b depicts buckled shell clamped by sixteen M10 bolts to the base, and Fig. 5c shows the external tank used to capture expelled oil due to the expansion of internally pressurised toricone. The amount of expelled oil was measured using a scale to +/- 0.5 mg accuracy. Loading by internal pressure was of single monotonic incremental profile until the model lost its structural integrity. Some models developed a small crack, or couple of cracks, and some ruptured with a single large tearing. Table 4 provides experimental values of burst pressures for all eight models.
Model prestart
(MPa) initial
V V
(%)
Exptl Computed
T1 1.71 7.2 7.3
T1a 1.79 7.3 7.1
T2 2.09 6.3 6.1
T2a 2.66 8.0 8.3
T3 2.70 12.7 13.1
T3a 2.17 12.6 12.8
T4 3.0 14.2 13.7
T4a 4.13 4.9 4.7
Table 3: Numerical values of external pressure, prestart, required for expelling
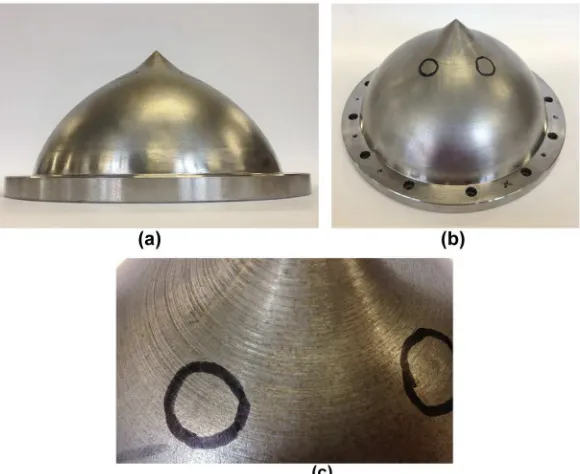
It also indicates whether the shell suddenly ruptured (R), or whether it developed a leak (C) - usually through a small through-thickness crack. The history of experimentation with model T3a is illustrated in Fig. 6. The model, as manufactured, is depicted in Fig. 6a whilst post-collapse shape is shown in Fig. 6b. Under the internal pressure, toricone T3a failed suddenly by a substantial tearing running meridionally – see Fig. 6c. It is seen here that prior to rupture the dome, T3a, has undergone large change in shape. Fig. 7, on the other hand, illustrates the model T2a after burst/leak through two, small cracks (Fig. 7b). Again, prior to the leak the model has undergone large change in shape. Photograph of the enlarged cracked area is depicted in Fig. 7c where the cracks are hardly seen. It is worth noting that the leak occurred within the dented area which had resulted from an earlier collapse by external pressure.
Figure 5: View of arrangements for burst tests (Fig. 5a). Model T2a bolted to the base plate – Fig. 5b, and the external tank attached to the base (Fig. 5c).
Figure 6: Photographs of toricone T3a: as manufactured (Fig. 6a), after buckling (Fig. 6b), and after burst (Fig. 6c).
4 Burst pressures – numerical methodology
approximated by fourteen linear segments – as detailed in [14]. The FE grid, after convergence studies, had 39 S8R elements along the meridian, and 120 S8R elements in the hoop direction. The apex layer was modelled using three-node triangular element, STRI3. Two types of burst analyses were carried out. In the first one, the starting geometry was an approximate representation of buckled models. In the second one, the starting geometry was assumed to be as manufactured. Both of these are described next.
Figure 7: Model T2a after burst/leak – side view (Fig. 7a). Two leak areas encircled and enlarged (Figs 7b, 7c).
4.1 Loading of buckled toricones
The first task here was establishing the initial, permanently deformed shapes of models which would resemble those obtained in buckling experiments. To this end, external pressure was applied to as manufactured models and the resulting change in volume, ΔV, was computed. As pressure increased the value of ΔV also grew for up to the collapse as seen Fig. 8 for the case of T2a model. On the post-collapse path the shell continued to be deformed for diminishing values of external pressure. As mentioned earlier, the only quantity available to quantify post-collapsed configuration for any given model was the volume change between as manufactured and post-collapsed configurations. Hence, the numerical process of loading continued until the computed change of volume was near-enough to experimentally measured value. In Figure 8 it is seen that experimentally measured volume change (8 %) corresponds, more-or-less, to the computed one (8.3 %) at pressure, prestart =
2.66 MPa, on the post-collapse path. Also, there is a good visual comparison of deformed geometries – as exemplified in Fig. 9 for the model T2a. Table 3 provides values of pressures for the remaining models which generated deformed profiles seen in experimentation. Computed values of collapse load are given in Table 2. The collapse loads were obtained using RIKS method, NLGEOM option in ABAQUS as well as the true-stress true-strain material data. Once shrinkage of pressurised toricone reached the level close to the experimentally measured magnitude, the stress-state was frozen, and the internal pressure was applied.
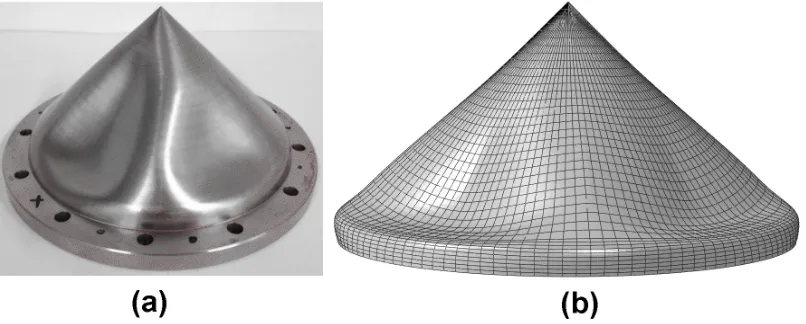
Figure 9: View of collapsed toricone T2a – Fig. 9a, and the FE simulated post-collapse shape with approximately the same deformed pattern and its volume – Fig. 9b.
4.2 Loading of as manufactured toricones
also carried out in order to ascertain any differences in burst pressures associated with both geometries at which the internal pressure was applied. As in the previous case, the FE models were incrementally loaded for up-to burst by internal pressure. The only differences were the initial geometries of pressurised models, and here the nominal geometries given in Table 1 were used. The FE grid and modelling of material was the same as in the case of dented models. Equally, the burst criteria were the same as for buckled models, and these are provided next.
4.3 Burst pressure - algorithm
Irrespective of initial geometry the following procedure has been adopted in order to obtain burst pressures for internally pressurised toriconical shells.
It is postulated to use the true plastic strain, up, corresponding to the ultimate tensile strength, UTS, for computing the magnitude of burst pressure. Experimentally obtained engineering stress-strain curve as plotted in Fig. 3, together with the equivalent true-stress true-strain, are to be used for the calculation of burst pressure. The latter curve is modelled by 14 linear segments (numerical values are available in [14]). One needs not only the magnitude of plastic strain but also a place where this strain is to be attained. Based on the above criterion for admissible magnitude of plastic strain, it is additionally postulated to define the burst pressure as follows: pbnumerical1UTS is the pressure at which the equivalent plastic strain, PEEQ, reaches the ultimate plastic strain, up, anywhere at the mid-surface of a structure. Another possibility would be to have the burst pressure, pbnumerical2fracture, corresponding to the failure plastic strain, pf .
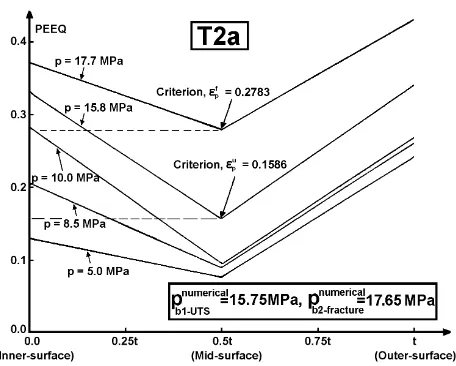
This means that after obtaining a converged solution for a given pressure level, one has to check the spread of PEEQ through the wall thickness at every Gauss point. If only at one of them the magnitude of PEEQ reaches the mid-surface then this pressure is called the burst pressure. The flow of PEEQ through the wall thickness is illustrated in Fig. 10 for the model T2a for both, up and pf , criteria. Both of these magnitudes were reached at different Gauss points but in both cases plastic straining progressed from inside wall towards the outer side. Figure 11 shows the deformed shapes of the model T2a at three load levels, i.e., (i) prestart = 2.66 MPa,
Figure 10: Distribution of equivalent plastic strains through the wall thickness at a number of internal pressure steps.
Figure 11: Side view of model T2a at: prestart (Fig. 11a), and at burst pressures (Figs
11b, 11c). Locations of mid-surface PEEQ corresponding to prestart, pb1,
and pb2 are marked.
Model t
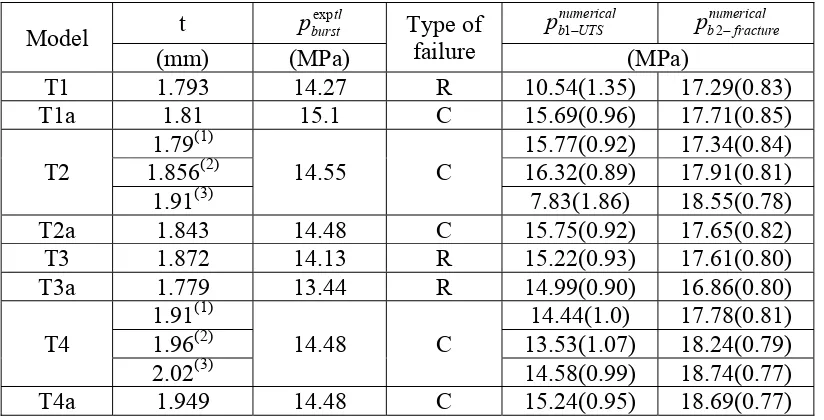
1.856(2) 16.32(0.89) 17.91(0.81)
1.91(3) 7.83(1.86) 18.55(0.78)
1.96(2) 13.53(1.07) 18.24(0.79)
2.02(3) 14.58(0.99) 18.74(0.77)
T4a 1.949 14.48 C 15.24(0.95) 18.69(0.77)
Table 4: Comparison of experimental and computed burst pressures. Note: (1) corresponds to the minimum wall thickness; (2) denotes overall average wall thickness; (3) denotes the maximum wall thickness; R ≡ rupture; C ≡ small crack/leak;
Model
‘dented’ models ‘as manufactured’ models numerical
UTS b
p1 pbnumerical2fracture numerical UTS
Table 5: Comparison of computed burst pressures for ‘dented’ models with computed results for ‘as manufactured’ models.
5 Discussion of results
Values of computed burst pressures, pbnumerical1UTS and pbnumerical2fracture, for dented and for as manufactured models are given in Table 4 and Table 5, respectively. It is seen from Table 5 that the burst pressures for ‘as manufactured’ geometries are all higher or equal to the corresponding burst pressures for ‘dented’ models. The ratio of
dented
1 varies between 1.00 and 1.54 whilst the ratio
varies between 1.00 and 1.05. The above values indicate that perfect, as manufactured models, can in some cases support larger internal pressure before their structural integrity is lost.
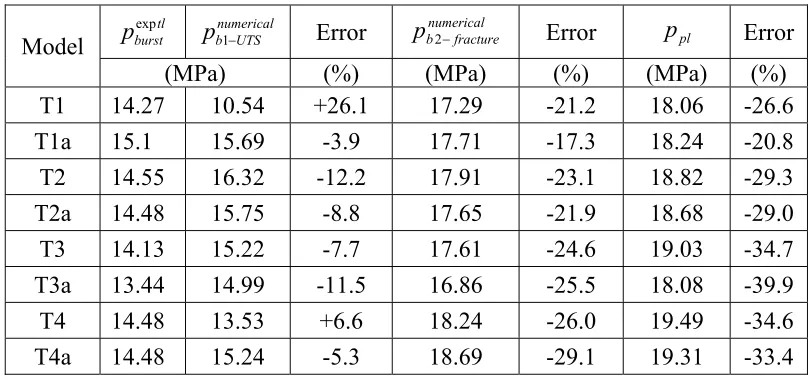
Finally, the burst pressures based on plastic instability, ppl, are provided in Table
6 where they are compared with experimental values and with magnitudes of burst pressures, (pb1, pb2) associated with the excessive plastic straining. It is seen here
that the plastic instability burst pressures significantly overestimate the experimental values. The latter are below the numerical values by -20% to -40%.
Model Table 6: Comparison of experimental burst pressures with computed burst
pressures pb1 and pb2, and with pressure at plastic instability, ppl.
6 Conclusions
Repeatability of experimental burst data was good. The errors within each pair were: 0%, 0.5%, 5%, and 6%. The smallest two errors were associated with burst by cracks. The other two corresponded to tearing mechanism at the burst, and there is no obvious explanation what were the causes behind the ultimate loss of structural integrity. Computed plastic instability pressures were significantly overestimating the experimental values by 20% to 40 %. A similar pattern has been recorded in previous studies for: (a) bursting steel spherical caps (with the errors between 35% and 50%), (b) bursting steel torispheres (with errors between 18% and 43%), and (c) bursting aluminium torispheres (with errors between 13% and 21%). Hence it can be said that the burst pressures based on plastic instability are likely to overestimate the experimental values. In practical terms, this means that such predictions are not safe. The proposed approach for computing the burst pressures does not give universally safe values. For some geometries and materials its predictions are safe but for others they are not. The unsafe predictions are however much closer to the experimental data than the plastic instability based estimates.
References
[1] J. Błachut, V.T. Vu, “Burst pressures for torispheres and shallow spherical caps”, Strain, An Intl Journal for Experimental Mechanics, 43, 26-36, 2007. [2] D.P. Updike, A. Kalnins, 1994, “Burst by tensile plastic instability of vessels
with torispherical heads”, In Recertification and Stress Classification Issues, ASME PVP 277, Petrinec J.N., (ed.), ASME, NY, 89-94, 1994.
[3] D.P. Updike, A. Kalnins, “Ultimate load analysis for design of pressure vessels” ASME PVP, 353, Pressure Vessel and Piping Codes and Standards, Proceedings of the 1997 ASME Pressure Vessels and Piping Conference, ASME, New York, NY, 289-293, 1997.
[4] D.P. Updike, A. Kalnins, “Tensile plastic instability of axisymmetric pressure vessels”, Journal Pressure Vessel Technology, Transactions of the ASME, 120, 6-11, 1998.
[5] B.F. Langer, “Design-stress basis for pressure vessels”, Experimental Mechanics, 11, 1-11, 1971.
[6] V.T. Vu, “Burst and Minimum Weight Design of Pressure Vessel Components
by Modern Optimisation Techniques”, PhD Thesis, The University of
Liverpool, U.K., 2008.
[7] V.T. Vu, J. Błachut, “Plastic instability pressure of toroidal shells”, Journal of Pressure Vessel Technology, Transactions of the ASME, 131, pp. 051203-1 – 051203-10, 2009.
[8] Y. Kisioglu, “Burst tests and volume expansions of vehicle toroidal LPG fuel tanks”, Turkish Journal Eng. Env. Sci., 33, 117-125, 2009.
[9] Y. Kisioglu, “Burst pressure determination of vehicle toroidal oval cross-section LPG fuel tanks”, Journal of Pressure Vessel Technology. Transactions of the ASME, 133, 031202-1 – 031202-5, 2011.
[10] R. Tong, X. Wang, “Simplified method based on the deformation theory for structural limit analysis – II. Numerical application and investigation on mesh density”, International Journal Pressure Vessels and Piping, 70, 51-58, 1997. [11] M. Wasicek, F.D. Fischer, I. Sabirov, O. Kolednik, “The burst pressure of a
cylindrical vessel with a conical bottom and a torispherical head”, Proc.
ICPVT-10, Zeman J.L., (ed.), Oesterreichische Gesellschaft fuer
Schweisstechnik, Vienna, 95-102, 2003 (ISBN 3-9501528-1-4).
[12] J. Błachut, “Experimental perspective on the buckling of pressure vessel components”, Applied Mechanics Reviews, Transactions of the ASME, 66, 1-51, 2014.
[13] J. Błachut, “Externally pressurized toricones – buckling tests”, in Shell Structures: Theory and Applications, 3, Pietraszkiewicz, W., Górski, J., (eds), Taylor & Francis, London, New York, 183-186, 2013, (ISBN 978-1-138-00082-7).
[14] J. Błachut, A. Muc, J. Ryś, “Plastic buckling of cones subjected to axial compression and external pressure”, Journal of Pressure Vessel Technology, Transactions of the ASME, 135, 011205-1 – 011205-9, 2013.