PROJECT SARJANA MUDA 1
ESTIMATE THE LIFE CYCLE OF ROLLER BY EXPERIMENT AND SIMULATION
NAME : AZLAN SOFFIAN BIN BORHAN NUMBER OF MATRIX : B041110023 COURSE : BMCL
1 SUPERVISOR DECLARATION
“I hereby declare that I have read this draft report and in my opinion this draft is sufficient in terms of scope and quality for the award of the degree of Bachelor of
Mechanical Engineering (Plant & Maintenance)’
Signature:………..
Supervisor:MR OMAR BIN BAPOKUTTY
DECLARATION
“I hereby declare that the work in this report is my own except for summaries and quotations which have been duly acknowledged.”
Signature: ...
Author: AZLAN SOFFIAN BIN BORHAN
3 ABSTRACT
4 ABSTRAK
5 ACKNOWLEDGEMENT
To Allah Almighty belong to all praises and glory. His peace and blessings be upon His chosen Prophet, Muhammad SAW, his family and companions. I wish to record my grateful knowledgeable to the institutions and individuals without whose kind assistance, concern and encouragement the humble effort would not have been possibly accomplished. In the writing of this dissertation.
I owe a great debt of gratitude to my supervisor, mr Omar bin Bapokutty and my co-supervisor, Dr Haryanti Samekto for his continuous help and unselfish concern. His wisdom, legal acumen and example of dedication and hard work have always served as a constant source of inspiration of the accomplishment of this research.
My appreciation also goes to Utem’s lecturer and friends for helping me out. Teach and sharing their knowleadge to me.
6 Table of Contents
SUPERVISOR DECLARATION ... 1
DECLARATION ... 2
ABSTRACT ... 3
ABSTRAK ... 4
ACKNOWLEDGEMENT ... 5
LIST OF FIGURE ... 8
LIST OF TABLE ... 9
CHAPTER 1 ... 10
INTRODUCTION ... 10
Background ... 10
Problem Statement ... 11
Objective ... 11
Scope of study ... 11
Gantt Chart ... 11
CHAPTER 2 ... 12
Introduction ... 12
2.1 Idler / roller ... 12
2.2.1 Idler/roller life ... 13
2.2 Predictive maintenance / Condition Based Maintenance ... 14
2.3 Fatigue... 19
2.3.1 Factor that affect fatigue ... 23
2.3.2 S-N graph ... 25
2.3.3 Crack formation... 26
2.3.4 Ductile fracture ... 27
2.3.5 Brittle fracture ... 27
CHAPTER 3 ... 29
Introduction ... 29
3.1 Literature review ... 30
3.2 Collecting data and information ... 30
3.3 Identify the objective, problem statement and scope of study ... 31
3.4 Methodology ... 31
CHAPTER 4 ... 33
7
4.1 Material properties ... 34
4.2 Rotation simulation ... 36
4.2.1 Stress ... 36
4.2.2 Resultant Displacement ... 37
4.2.3 Strain ... 38
4.2.4 Damage plot ... 39
4.2.5 SN curve ... 40
4.3 Static simulation ... 42
4.3.1 Deformation ... 42
4.3.2 Elastic strain ... 43
4.3.3 Stress ... 44
4.4 Calculation ... 45
CHAPTER 5 ... 46
Introduction ... 46
Discussion... 47
CHAPTER 6 ... 48
Introduction ... 48
Conclusion ... 49
Appendix ... 50
8 LIST OF FIGURE
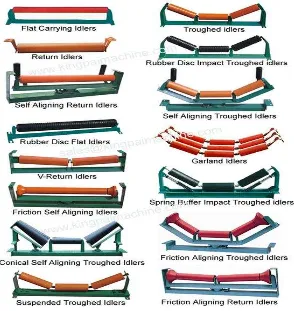
Figure 1 : Carrying roller/idlers ... 10
Figure 2: Type of conveyor ... 12
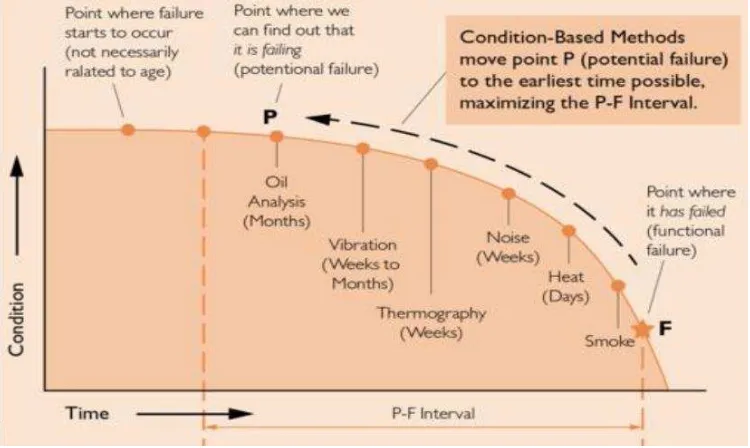
Figure 3 : P-F curve ... 16
Figure 4 : Thermography testing on conveyor’s roller ... 17
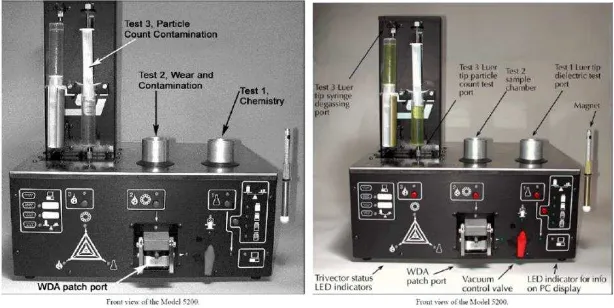
Figure 5 : Oil analysis equipment ... 17
Figure 6 : Ultrasonic equipment... 18
Figure 7 : Vibration analysis equipment ... 18
Figure 8 : Stress vs strain graph ... 20
Figure 9 : Stress vs strain diagram of different type of material ... 21
Figure 10 : S-N graph ... 25
Figure 11 : An an oyster shell apperance ... 27
Figure 12 : Different direction of force on material ... 28
Figure 13 : Process flow chart ... 29
Figure 14 : Type of research. General research approaches, data collection techniques and data analysis techniques ... 30
Figure 15: Roller ... 34
Figure 16: Dimension of roller... 34
Figure 17: Simulated roller on stress ... 36
Figure 18: Simulated roller on resultant Displacement ... 37
Figure 19: Simulated roller on strain ... 38
Figure 20: Simulated roller on damage plot ... 39
Figure 21: SN curve (linear interpolate) ... 40
Figure 22: SN curve (semi log interpolate) ... 40
Figure 23: SN curve (log-log interpolate) ... 41
Figure 24: Simulated roller on deformation ... 42
Figure 25: Simulated roller on elastic strain ... 43
9 LIST OF TABLE
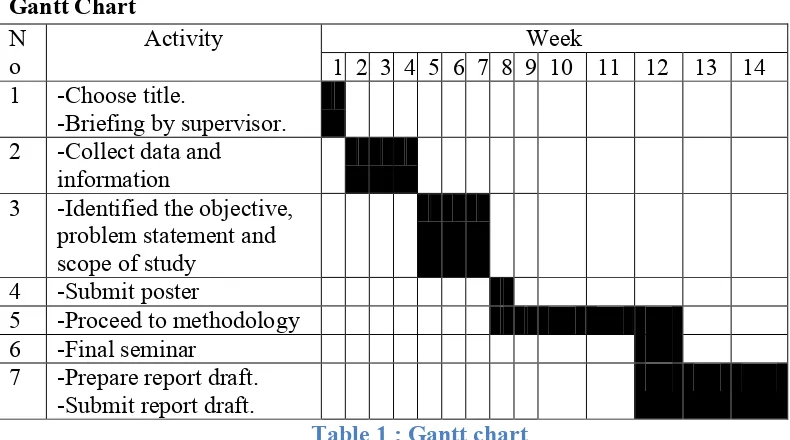
Table 1 : Gantt chart ... 11
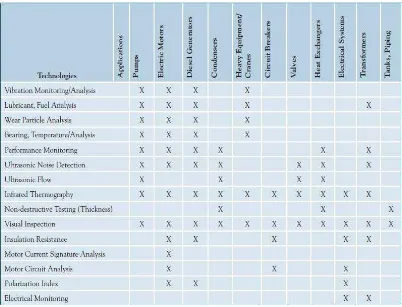
Table 2 : Example of prediction technology application ... 15
Table 3: Material properties and its value ... 35
10 CHAPTER 1
INTRODUCTION
This research will focus on the life cycle of the roller. By improve the life cycle of the roller, breakdown in plant can be reduce. Beside that, we also can planning on preventive maintenance from the result and the predictive maintenance.
Background
Coal mining is a huge industry and consume large of electricity. The correct way of materials-handling methods must be concern, therefore materials-handling selection must be take seriously and the decision-making process can be extremely hard. After the mined material pull out from the earth, it must be transfer to a processing site and then to the final location to be use. Depending on the type of mining, transportation in the mine itself can be by rail car, truck, or conveyor. The electrically powered conveyors are an important option for local and long distance materials handling in mining sector. They are highly used in and around mines, in lengths from 20 yards to 20 miles. For the conveyor that use in mining, the rollers used to backing the belt conveyors from fall apart and as the result of a three-body wear process to build abrasive wear under slight stress. Figure 1 show one of the type widely used in our country.
11 Problem Statement
There are many different parameters that have to be measured on roller and it should be considered in purpose to improve the mechanic of the roller such as fatigue of the material, saiz of the roller and type of material. This helps to prevent breakdown from happen and we can do preventive maintenance before the roller totally crack and not suitable to use anymore.
Objective
The objective are :
1. To investigate the maximum force that roller can sustain. 2. To estimate the life cycle of roller.
3. To determine the suitable maintenace to use.
Scope of study
The scope of this study are:
1. 3D model will be produced to represent the roller. 2. Analysis will cover aspects of mechanics.
3. Analysis the data using ANSYS and Solid Work software.
Gantt Chart N
o Activity 1 2 3 4 5 6 7 8 9 10 11 12 13 14 Week
1 -Choose title.
-Briefing by supervisor.
2 -Collect data and
information
3 -Identified the objective, problem statement and scope of study
4 -Submit poster
5 -Proceed to methodology
6 -Final seminar
7 -Prepare report draft.
-Submit report draft.
12 CHAPTER 2
Introduction
In this chapter, all the information related to the life cycle is elaborated. This literature review is importance step to get all the information related to this research.
2.1 Idler / roller
The idler or roller provides a basic radial support against gravity and belt tension in the case of curved belt, and to force belt bending and material cross section. In doing this the roll also allows longitudinal movement with only a small through accumulating belt tension increace part of which is attributable to the roll torsional resistance and matching the idler roll life to that of the conveyor are the primary design goals at a particular radial load beyond enabling a cost effective and well “behaved” rotating construction. (Alspaugh, 2008)There are many different type of idler. Figure 2 shows type of conveyor.
13 2.2.1 Idler/roller life
Life versus design can be thought of as the maximum possibe life of a loaded roll and the factors that contribute to not fully experiencing this life. The following descriptions of common idler components : (Alspaugh, 2008)
Bearing life
The bearing life is ultimately limited by the contact stresses between the rolling element and the races that they run. Several scenarios can develop that must be addressed in the design of the bearing set.
Seal for bearing life
Significant cost are commonly added for seal between the rotating
andstationary component to isolate the bearing from external contaminants so they can function as intended.
Labyrinth design
Labyrinth is a general term for non-contacting, frictionless isolation that creates a bending, narrow and usually long path making it more difficult to material to pass to the bearing. Alternating rotating and stationary element create axial and radial passages where the width of the passages is governed by the ability/cost tp prevent contact and whether they are grease filled.
Contact seals
14 Roll wear
The belt contact surface wear can also be the limit to idler life. The driving
influence should be considered the belt contact and alignment of belt movement normal to the roll centerline. This can be affected by installation, frame design, belt curves or idling spacing.
2.2 Predictive maintenance / Condition Based Maintenance
The goal of life-cycle design is to maximize the values of the manufacturer's line of products while containing the products' costs to the manufacturer, the user, and society. Engineers must consider performance, cost, and any environmental impact of their designs. Our research develops systematic methodologies that apply to the early stages of product development in integrating life-cycle quality (Ishii, 1995)
By knowing the estimation of the life-cycle, it easy to do the predictive maintenance. Also know as condition based maintenance (CBM). Predictive maintenance keeps us one step ahead of the problems. This because we already collecting and analyze the key parameter to optimize the maintenance schedule. This are some of the benifits :
Improved reliability and performance
Minimized downtime
Extended equipment lifetime
Reduced operating risks
Decreased replacement costs
Improved spares management
Increased maintainability
In the same time, it also has disadvantage which are :
15
Increases investment in staff training
Table 2 : Example of prediction technology application
When to use predictive maintenance:
Assets degrade over an unknown amount of time include cost effective to
monitor and repair rather than allow it to fail
The cost of monitoring is less than the cost of it failing or of carrying a preventive maintenance including the risk of infant mortality
Carried out on redundant machines, where failure directly impact
16 Figure 3 : P-F curve
As we can see from figure 3, before the machine or component get functional failure, it will gives warning. CBM is done to know the earliest time possible that can cause failure happen and to maximizing the P-F interval. CBM implemented to reduce the breakdown happen in industry. When breakdown happen, the industry will have a lot of loss of profit and waste time for waiting to be repair or the spare part to order.
There are various technologies are employed to monitor the sign of problem which are
Thermography
Wear debris and oil analysis
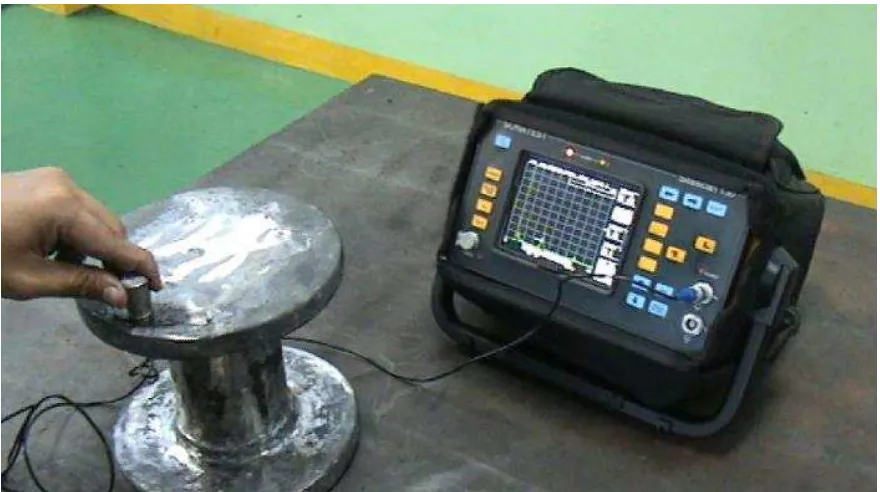
Ultrasonic testing
17 Figure 4 : Thermography testing on conveyor’s roller
18 Figure 6 : Ultrasonic equipment
19 2.3 Fatigue
The most major failure in engineering is cause by fatigue. Fatigue failure is defined as the posibility of a material to fracture by means of progressive brtittle cracking under repeated applied loads. Fatigue cracks are very slow to develop initially but their rate of growth increases dramatically as the crack grows. In essence, this acceleration results from a localised increase in the stress at the top of the expanding crack, which comes about quite naturally because the forces on the
object are supported by an ever-diminishing cross-sectional area. Some materials
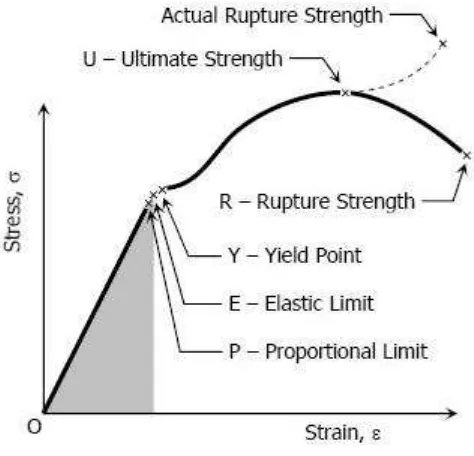
20 Figure 8 : Stress vs strain graph
Elastic Limit is
the abilty of material to return to it original shape after load is removed.
Yield Point
is the point at which the material will have an appreciable elongation or
yielding without any increase in load.
Ultimate Strength
the maximum ordinate in the stress-strain diagram is the ultimate strength or
tensile strength.
Rapture Strength
the strength of the material at rupture. This is also known as the breaking
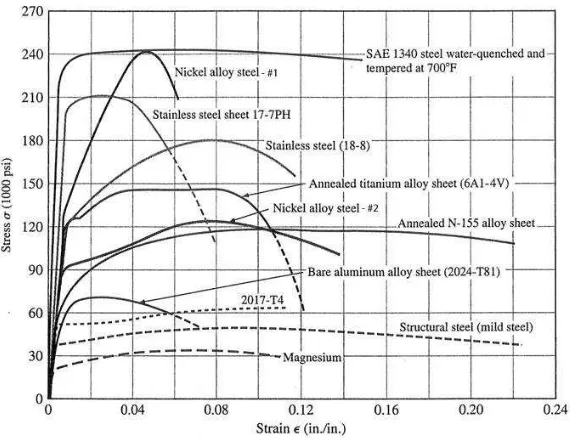
21 We can learn a lot about a substance from tensile testing. As you continue to pull on the material until it breaks, you will obtain a good, complete tensile profile. A curve will result showing how it reacted to the forces being applied. The point of failure is of much interest and is typically called its "Ultimate Strength" or UTS on the chart. Different type of material has different value of fatigue. Figure 9 show different type of material that has different value of fatigue.
Figure 9 : Stress vs strain diagram of different type of material
Hooke’s Law is measure of the stiffness of an elastic material and is a quantity used to characterize materials. It is defined as the ratio of the stress (force per unit area) along an axis to the strain (ratio of deformation over initial length) along that axis in the range of stress.
22 removed. At the point that the curve is no longer linear and deviates from the straight-line relationship, Hooke's Law no longer applies and some permanent deformation occurs in the specimen. This point is called the "elastic, or proportional, limit". From this point on in the tensile test, the material reacts plastically to any further increase in load or stress. It will not return to its original, unstressed condition if the load were removed.
One of the properties you can determine about a material is its ultimate tensile strength (UTS). This is the maximum load the specimen sustains during the test. The UTS may or may not equate to the strength at break. This all depends on what type of material you are testing. . .brittle, ductile, or a substance that even exhibits both properties. And sometimes a material may be ductile when tested in a lab, but, when placed in service and exposed to extreme cold temperatures, it may transition to brittle behavior.
The fatigue process is usually divided into three phase which is phase 1(crack initiation), phase 2( crack growth) and phase 3( final fracture).
Phase 1 which is the crack initiation usually takes place on the surface of the metal in the vicinity of a notch. The mechanism is explained by a slip band mechanism at a microscopic level driven by the maximum shear stress. When the load is imposed, some grains will be subjected to plastic deformation invilving the sliding of someof the crystallographic planes. The mechanism is limited to a few grains where these crystallgrophic planes have an unfavorable orientation with respect to the local maximum shear stresses. When the load is reserved, the planes will not slideback to their initial position due to the cyclic stain hardening effect. Hence, in the reserved part of the loadcycle, it is the neighboring planes that will suffer yielding by sliding in the opposite direction. The final result is microscopic extrusions and intrusion on the metal surface. The intrusion act as a micro-crack for further crack extension during the subsequent loading cycles.
23 governed by the cyclic shear stresses, the crack growth depends on the material as a bulk property and the crack is driven by the cyclic principal stresses.
In the growth phase, the crack growth process is explained by crack opening and front blunting mechanism followed by a subsequent crack losing and front sharpening mechanism during each load cycle. After one complete cycle, the crack front has advanced a small increment which may be traced by microscopy on the fatigue surface. This advancement corresponding to oneload cyclic is the distance between two so called striations. These striation are shown for a high strength steel. The advancement depends on the range of the range of the stress intensity factor.
The final fracture in phase 3 will take place when the crack becomes so large that the remaining ligament of the cross section is to small to transfer the peak of the load cycle, or when the local stresses and strain at the crack front inflict a local brittle farcture. (Tom Lassen, 2013)
2.3.1 Factor that affect fatigue
The factor are : (EPI inc.)
(a) Surface Condition (ka): such as: polished, ground, machined, as-forged, corroded,
etc. Surface is perhaps the most important influence on fatigue life
(b) Size (kb): This factor accounts for changes which occur when the actual size of
the part or the cross-section differs from that of the test specimens
(c) Load (Kc): This factor accounts for differences in loading (bending, axial, torsional) between the actual part and the test specimens;
(d) Temperature (kd): This factor accounts for reductions in fatigue life which occur