Jurnal Keuangan dan Perbankan
Journal
of
Finance
and
Banking
Volume 13, Womor 2, Desember 2011 ISSN 1410 8623
I
Jurnal Terakrediii BSK Direktur Jenderal Pendidikan Tinaai De~attemen Pendidikan Nasional ReDublik Indonesia Nomor : 8 1 / ~ 1 ~ ~ l ~ f e ~ / 2 0 l l Tanggal 15 November 201 1 '
DETEKSI DIN1 PERIODE BEARISH RETURN SAHAM SEKTOR PROPERTI PENDEKATAN SIGNAL
-
NONPARAMETRIC R. NurhidayatRlSlKO IDlOSlNKRATlK DAN IMBAL HASlL SAHAM PADA BURSA SAHAM INDONESIA
Prima Naomi
VOLATILITAS INFLASI Dl INDONESIA : FISKAL ATAU MONETER? Aloysius Deno H e ~ i n 0
PEMODEUN THRESHOLD VECTOR AUTOREGRESSIVE P A R ) UNTUK KURS JUAL DAN KURS BELl EURO
Heni Kusdarwati, Eni Sumarminingsih, Evi Mashita Arifin
THE SIGNIFICANCE OF LOYALN ON CONSUMER CREDIT RISK PROFlTABlLlN
Aditya Galih Prihartono, Ujang Sumarwan, Noer Azam Achsani, Kirbrandoko
FUNGSI PAJAK PENGHASILAN SEBAGAI AUTOMATIC STABILIZER Suska
KEPUTUSAN PENDANAAN: PlLlHAN KEPUTUSAN HUTANG DAN EKUITAS
Tettet Fiirijanti
Pusat Peneliian
dan
rengabclian Kepada Masyamkat Program Rnagister ManajemenlKPlA Perbanas Jakarta
Jurnal Keuangan dan Perbankan
J o u r n a l o f F i n a n c eand
B a n k i n gJurnal Terakreditasi B
SK Direktur Jenderal Pendidikan Tinggi Departemen Pendidikan Naslonal Republik Indonesia Nomor : 81IDIKTIIKepl2011 Tanggal 15 November 2011
Volume 13, Nomor 2, Desember 2011
DETEKSI DIN1 PERIODE BEARISH RETURN SAHAM SEKTO PROPERTI PENDEKATAN SIGNAL
-
NONPARAMETR. Nurhidayat
RlSlKO IDlOSlNKRATlK DAN IMBAL HAS11 BURSA SAHAM INDONESIA
Prima Naomi
VOLATlLlTAS INFLASI D l INDONESIA : FI! Aloysius Deno Hewino
.
SAHAM PADAAU MONl ETER?
PEMODELAN THRESHOLD VECTOR AUTOREGRESSIVE (TVAR) UNTUK KURS JUAL DAN KURS BELl EURO
Heni Kusdarwati, Eni Sumarmininosih. Evi Mashita Arifin
THE SII PROF11
Aditya Galih Prihartono, Ujang Sumanvan, Noer Azam Achsani, Kirbrandoko
FUNGS Suska
I PAJAK
KEPUTUSAN PE DAN EKUITAS Tettet Fil
NDANAA
-
LOYALTY ON COI VSUMER CREDIT RISK
AN KEPL
AUTOMP
E
disi kali ini, kami memilih dari berbagai tulisan yang masukdan cukup menarik dimana pembaca akan menikmati kera- gaman tulisan tersebut. Pada edisi ini kami mempersembahkan tulisan dari keuangan, ekonomi, pajak dan pemasaran bank. Metodologi yang dipergunakan pada tulisan yang ditampilkan edisi ini juga sangat sedikit lebih baru dipakai para peneliti dan sedikit diatas biasanya. Walaupun demi- kian, tulisan yang ditampilkan masih bisa dapat dicerna bagi mereka yang kurang kuat analisis kuantitiatifnya. Kami tetap konsisten menampilkan sebanyak tujuh tulisan pada edisi ini sehingga pembaca tetap tidak dirugikan karena tidak ada alasan kami untuk mengurangi tulisan tersebut, bahkan kami sedang mening- katkan jumlah tulisan tersebut.Pada edisi ini, tulisan pertama dimulai dengan Judul "Deteksi Dini Periode Bearish
Return Saham SeMor Properti: Pendekatan Signal - Nonparametric". Paper tersebut ditulis oleh Sdr. R. Nurhidayat dari Kemen- terian Keuangan Republik Indonesia. Penulis paper mempunyai tujuan untuk menulis paper tersebut yaitu menyelidiki atau mendeteksi periode bearish return saham dari saham-saham seMor properti dengan berbagai kondisi ekonomi. Periode penelitian yang dipergunakan pada Januari 1996 sampai Juni 2011 dengan data bulanan. Metodologi yang diperguna- kannya untuk mendeteksi periode bearish tersebut yaitu pendekatan signal secara non-parametrik dimana dipergunakan 18 leading indikator. Adapun hasil penelitian tersebut memberikan kesimpulan bahwa periode bearish dapat dideteksi oleh satu indikator yang terutama pada tahun 2008. Tetapi, penulis juga menemukan bahwa deteksi periode bearish tersebut dapat juga
terdeteksi oleh indikator lain.
Sdri Prima Naomi dari Universitas Paramadina menulis paper yang berjudul "Risiko ldiosinkratikdan lmbal Hasil Saham pada Bursa Saham Indonesia" menjadi tulisan kedua pada edisi kali ini. Tulisan ini mempunyai tujuan untuk melihat pengaruh risiko dari volatilitas idiosinkatrik dan beta terhadap imbal hasil saham dan juga size perusahaan. Periode penelitian dari tulisan tersebut dimulai 1 Januari 2008 sampai dengan 15 Maret 201 1 dengan data bulanan. Metodologi yang dipergunakan dalam paper tersebut yaitu model tiga factor Fama-French. Adapun hasil penelitian dari paper tesebut yaitu volatilitas idio- sinkratik yang diberikan simbol IVOL pada data obesewasi menunjukkan pola yang random walk. Baik risiko pasar (BETA) maupun risiko indiosinkratik (IVOL) berpe- ngaruh positifterhadap rata-rata imbal hasil. Risiko idiosinkratik memiliki pengaruh yang lebih kuat dibanding risiko pasar. Variabel
size BE/ME merupakan variabel yang
signifikan berpengaruh terhadap imbal hasil.
Tulisan ketiga kami tampilkan yang berjudul "Volatilitas lnflasi di Indonesia: Fiskal atau Moneter?". Tulisan ini ditulis Sdr Aloysius Deno Hervino dari Universitas Katolik lndonesia Atma Jaya, Jakarta. Tulisan tersebut mempunyai tujuan menganalisis volatilitas inflasi dari sisi fiskal atau moneter dan juga pengaruh subprime Mortgage pada tahun 2007. Periode penelitian dari paper tersebut yaitu periode 2000 hingga2010. Sehingga pada periode tersebut didapati adanya periode krisis dan pasca krisis 2007. Model yang dibangun pada penelitian adalah ECM Engle Granger
Finance and Banking Journal, Vol. 13 No. 2 Desember 2011
terkointegrasi. Tetapi, jika memiliki derajat integrasi yang beragam, maka model yang akan dibangun adalah Autoregressive Distributed Lag Error Correction Model
(ARDL-ECM). Hasil yang diperoleh peneli- tian ini yaitu dalam jangka pendek pening- katan utang luar negeri dan jumlah uang beredar justru akan menurunkan tingkat inflasi di lndonesia. Dalam jangka panjang, volatilitas tingkat inflasi di Indonesia dipengaruhi oleh dua sisi, yaitu sisi fiskal dan moneter.
Teman-teman peneliti dari Program Studi
loyalty cluters shows a significant value even when customers were underpresureddue to capacity topay issue. It was proven that customer in a different clusters. has lower average profitability "
Tulisan Sdr Suska dari Kementerian Keuangan Republik Indonesia, ditarnpilkan menjadi tulisan keenam pada edisi ini dengan judul "Fungsi Pajak Penghasilan sebagai Automatic stabilize^ " Tulisan ini
mernpunyai tujuan menganalisis fungsi pajak penghasilan sebagai stabilator otomatis. Periode penelitian yang diper- Statistika, Universitas Brawijaya Malang gunakan yaitu periode 1970 sampai 2010 yaitu Sdri HeniKusdarwat'; Eni Surnar- oimana metodologi yang dipergunakan miningsih dan Evi Mashita Arifin rnenuliskan regressi oiasa dan mengaitkannya aengan paper b e r j u d ~ l "Pernodelan Threshold peraturan pajak yang diterbitkan. Adapun
VectorAutoregressive(TVAR): Studi Kasus hasil penelitian yang diperoleh yaitu Data Kurs Jual dan Kurs Beli EURO" menjadi pergerakan PPh sejalan dengan PDB atau paper keempat pada edisi ini. Penelitian ini dapat dikatakan telah rnenunjukan fungsi mempunyai tujuan menyelidiki penggunaan automatic stabilizer. Pengaruh perubahan
Threshold Vector Autoregressive (TVAR) untuk tingkah laku hubungan non-linier pada data deret waktu. Adapun variable yang dipergunakan nilai tukar EURO (kurs Jual dan Beli) untuk periode 1 Februari 2002 sampai dengan 30 November 2009. Hasil yang diperoleh yaitu Model WAR yang dibentuk oleh kurs jual dan Beli EURO yaitu WAR (1)dengan y, = 13430.3 dan y, =
73980.7.
Tulisan kelima pada edisi.ini berjudul "Significance of Loyalty on Consumer Credit Risk Profitability" dimana penulisnya empat penulis yaitu Sdr Aditya Galih Prihartono; Ujang Sumarwan; Noer Azam Achsani; dan Kirbrandoko dari lnstitut Pertanian Bogor. Adapun tulisan ini mempunyai tujuan untuk rnenganalisis dan menguji efek loyalitas terhadap probabilitas kredit konsumen. Penelitian ini rnenggunakan periode data Oktober 2010 sampai dengan Maret 201 1 dimana analisis ANOVAdipergunakan untuk menguji efek loyalitas. Hasil yang diperoleh yaitu "The loyalty significantly influences profitability where ANOVA result to the 3
Undang-undang PPh selama beberapakali dari tahun 1984 berdasarkan hasil analisa tidak menunjukan pengaruh yang signifikan terhadap PDB.
Tulisan terakhir pada edisi ini ditulis Sdri Tettet Fitrijanti dari Universitas Padjajaran dengan judul "Keputusan Pendanaan: Pilihan Keputusan Hutang dan Ekuitas." Tulisan ini merupakan satu bagian dari penelitian penulis di Disehasinya. Adapun tujuan penelitiannya ingin mempelajari kebijakan pendanaan dengan meneliti apakah lag leverage-estimasi dan lag leverage, sebagai sub-variabel target-
leverage, mempengaruhi probabilitas
terjadinya suatu keputusan pendanaan relatif terhadap suatu keputusan pendanaan lainnya. Periode penelitian yang diper- gunakan dalam penelitian ini berdasarkan nilai buku total aset yang terdapat pada laporan keuangan akhir tahun 2008 atau periode paling akhir yang tersedia. Peru- sahaan yang menjadi sampel adalah yang merniliki nilai buku total aset minimal Rp. 750 miliar dengan alasan bahwa kelompok
perusahaan yang relatif lebih besar diban- dingkan dengan perusahaan-perusahaan dalam industri yang sama biasanya menjadi representasi prilaku industri, dan dengan laporan keuangan yang tersedia di media publikasi relatif lengkap. Multinomial Logit analisis dipergunakan dalam menganalisis tujuan penelitian tersbut. Adapun hasil penelitian ini memperoleh sebagai berikut: terjadi penerbitan hutang pada kas yang
tinggi dan kas yang rendah menerbitkan saham; dan Perusahaan yang memiliki rasio market to book yang tinggi cenderung menerbitkan saham dan memiliki leverage yang rendah.
Dengan memperhatikan tulisan tersebut maka sangat banyakvariasi yang terjadi dan pada edisi mendatang kami akan meng- hadirkan berbagai tulisan untuk menambah wawasan para peniliti dan dosen-dosen.
Prof. Dr. Adler Haymans Manurung, M.Com., ME.
DARl REDAKSI
...
ii - iv DAFTAR IS1...
vDETEKSI DIN1 PERIODE BEARISH RETURN SAHAM SEKTOR PROPERTI PENDEKATAN SIGNAL
-
NONPARAMETRICR. Nurhidayat
...
.
.
...
110-
127 RlSlKO IDlOSlNKRATlK DAN IMBAL HASlL SAHAM PADABURSA SAHAM INDONESIA
Prima Naomi
...
128-
138VOLATILITAS INFLASI Dl INDONESIA : FISKAL ATAU MONETER?
Aloysius Deno Hewino
...
139 . 149PEMODELAN THRESHOLD VECTOR AUTOREGRESSIVE (TVAR) UNTUK KURS JUAL DAN KURS BELl EURO
Heni Kusdarwati, Eni Sumarminingsih, Evi Mashita Arifin
...
150-
158THE SIGNIFICANCE OF LOYALTY ON CONSUMER CREDIT RISK PROFlTABlLlPl
Aditya Galih Prihartono, Ujang Sumarwan, Noer Azam Achsani, Kirbrandoko .. 159
-
179FUNGSI PAJAK PENGHASILAN SEBAGAI AUTOMATIC STABILIZER
Suska
...
180-
190KEPUTUSAN PENDANAAN: PlLlHAN KEPUTUSAN HUTANG DAN EKUITAS
. . .
THE SIGNIFICANCE OF LOYALTY ON CONSUMER CREDIT
RISK PROFITABILITY
Aditya Galih Prihartono
lnstitut Pertanian Bogor
Ujang Surnarwan
lnstitut Pertanian Bogor
Noer Azam Achsani
lnstitut Pertanian Bogor
Kirbrandoko
lnstitut Pertanian Bogor
The purpose of this research is to ana&ze and to test the effect of loyalty on consumer crec?tprofitab2i@ Loyalty Score was developedto determine the level of customer's loyaliy level through
4 main variables; Longevity: Depth, Breadth and Referrals. Cluster develop- ment by Kmeans afgorithm was then developed to segment the sample into its similar characteristics. The effect of Loyalty to profitabiliiy was fuHher tested by ANOVA ana/ysis to see the signifi- cance of loyalty on profitability The result sho wed that loyalty significant& influences profitabilip where ANOVA result to the 3 loyalty cluters shows a signficant value even when the custo- mers were under pressured due to capacity to payissue. It wasproven that customerin a d~ferentclusters haslower average profitability: The conclusion could be made by using data from personal loan customers in one of the biggestmultinationalbankin Indonesia during October20 I0 until March 20 1 1.
Keywords: Loya& Consumer Credit Credit Risk, Credit Loss, Profitability
INTRODUCTION
D
ifferentview of specific dimensions on customer relationship construct has been acknowledged in the past years until now. However, there is general confirmation can be taken; its link with organization per- formance is almost the same universally (Sheth and Sisoda, 1999). Sin and Tse (2000) confirm this link further in service industry where intangibility may puzzle the relation- ship. Before that, Chang and Chen (1998) explain how service quality and customer relationship management influence financial performance significantly.The Significance
...
(Aditya Galih Prihaftono 8 Ujang Sumarwan 8 NoerAzam Achsani & Kirbandokoenue for the company.
The increasing importance of relation- ship marketing in recent years, particularly in the service industries, has made addi- tional emphasis on customer loyalty. Sev- eral authors such as Reicheld and Sasser (1990), Reicheld (1993), Sheth and Pawa- tiyar (1 995) emphasize the positive relation- ship existing between customer loyalty and business performance.
In other research, Consumer loyalty is also considered as an important key to or- ganizational success and profit (Oliver, 1997). Selin et al. (1987) state that, "those customers that demonstrate the greatest levels of loyalty toward the product, or ser- vice activity, tend to repurchase more of- ten, and spend more money". As a result, many of research attention havefocused on the identification of effective methods of actively enhancing loyalty, including loyalty programs such as point reward schemes (Lach, 2000).
Loyalty programs "create a reluctance to defect" by rewarding the customer for repurchasing from the organization (Duffy, '
1998). Loyal customers not only increase thevalue of the business, but also maintain lower cost than those associated with at- tracting new customers (Barsky 1994, Barroso and Martin, 1999). Thus, no won- der if loyalty rather than satisfaction is be- coming the number one strategic goal in competitive business environment (Oliver, 1 999).
The concept of customer loyalty has been discussed and explored with many assumptions underlying it. This fact is, ob- viously, gives much additional knowledge in confirming some specific factors which influence customer loyalty. Concepts which were mostly associated with this are cus- tomer trust or commitment and customer satisfaction (Ehigie 2006). It is then, not too difficult to understand the strong associa- tion among these concepts and connect
that as overall process of marketing strat- egy to improve financial performance of a company
In credit industry, consumer credit has been one of the main contributors in over- all credit growth. The span of products from mortgage, credit card, personal loans, car loan, had made this portfolio grow signifi- cantly with the growth of consumer spend- ing and economic improvement post crisis in 1997 until another crisis in 2008 (seeTable 1). However, still after 2008 this portfolio leads the growth until now compared to the other portfolio. This fact is actually not so surprising given some supporting factors at macro and micro level such as market relax on credit policy, the salary growth of low level job, better interest rate compared to past years and other factors which finally evolve the business into as it is right now.
This growth however has its impact at individual customer level which will need further attention. As many banks and other financial credit institutions start to lend the products to their potential clients, it is the fact that many of those institutions attempts to approach the same market. The poten- tial customers mainly live in city with an easy access to banks and high education level (at least High School level). Interestingly, other banks also lend multiple products to the same customer with its product varia- tions either through co- branding in credit card, personal loan with car loan and other mix products that made thecustomer highly leveraged.
~
Finance andBanking Journal, Vol. 13 No. 2 Desember 2011ship. Customer capacity to pay can change along with customer financial situation and therefore it will also can change customer payment behavior towards consumer credit products regardless other factors.
As stated by Jacoby and Chestnut (1978), loyalty can be measured through the behavioral approach, attitudinal approach and composite approach. The behavioral approach is based on consumers' actual or reported purchasing behavior and has often been operationally characterized as sequence of purchase, proportion of pur- chase, and probability of purchase. How- ever, this approach has been criticized by Dick and Basu (1 994) as lacking a concep- tual standpoint, and producing only the static outcome of a dynamic process. In addition, Pritchard and Howard (1997) also state that focusing on behavior alone can- not capture the reasons behind the pur- chases: repeat purchase may occur simply for arbitrary reasons such as price, time convenience and lack of choice, other than from any sense of loyalty or allegiance.
In the affitudinal approach, based on consumer brand preferences over time or purchase intentions, loyalty reflects consum- ers' psychological commitmentto a brand, and is studied via its dimensions such as repurchasing intentions, word of mouth re- ferrals, complaining behavior (Jones and Sasser, 1995; de Ruyter and Bloerner, 1998). The attitudinal measure explains an addi- tional portion of unexplained variance that behavioral approaches do not address (Backman and Crompton, 1991). However, study attitude alone cannot determine com- petitive effects, familiarity, and situational factors (Baloglu, 2002).
In practical research, comparing be- tween behavioural and attitudinal approach, behavioral measures are a common ap- proach to operationalize loyalty, due to the difficulties in measuring attitudinal loyalty. As suggested by Opperman (2000) behav-
ioral measures will be much better than at- titude measures because measuring atti- tudes over a longer time period is in most cases impractical.
Parasuraman, Zeithmal and Berry (1994) developed a loyalty scale including dimen- sions such as loyalty to company, propen- sity to switch, willingness to pay more, ex- ternal and internal response to problem. Some researchers (Taylor, 1998; Yoon and Uysal, 2003) measured consumer loyalty with three indicators: 1) likelihood to rec- ommend a product or service to other; 2) likelihood to purchase a product or service again; and 3) overall satisfactionffeeling. Hepworth and Mateus (1 994) adopted simi- lar indices to assess loyalty, including in- tention to buy same product, intention to buy more product, and willingness to rec- ommend the product to other consumers. As can be understood from the loyalty de- velopment principle in these researches, loyalty has been measured in the mixed way from both behavior apprach and attitude approach, or in simple term called the com- posite approach.
More recently, It has been argued that customer loyalty is a multidimensional con- cept including both behavioral element (re- peat purchases) and attitudinal element (commitment) and the use of composite measure increases the predictive power of the construct, as each variable cross-vali- dates the nature of truly loyal relationship (Dick and Basu, 1994). However, this ap- proach has limitations because not all the weighting or quantified scores may apply to both the behavioral and attitudinal com- ponents, which may have different measure- ments.
The Significance ... (Aditya Galih Prihartono 8 Ujang
empirical support for the typology has been noted in wider marketing literature (Dick and Basu, 1994), and leisure services (Selin et al. 1988, Backman and Crompton 1991), hospitality researchers have further con- firmed the application of four distincttypes of loyalty in a multitude of settings (Baloglu, 2001 ; Pritchard and Howard, 1997).
In another research by Griffin (1995) de- fines a loyal customer as someone who makes regular purchases, purchases across product and service lines, refers others, and demonstrates an immunity to the pull of the competition. Griffin (1 995) explains further that loyalty can be broken down into four categories based on the customer attach- ment or affinity to the products and services (or to the organization that provides them) and their purchase pattern (i.e., whether they take a repeat loan2). Both Backman & Crompton (2001) and Griffin(1995) show al- most similar loyalty typology, it has 4 dif- ferent type of loyalty whereby each has one extreme high and extreme low with almost the same explanation.
In consumer credit scenario, loyaltystrat- egy has been developed by money lend- ers or banks. Eakuru & Mat (2008) found that to increase loyalty, trust and image is two among many other things to be con- sidered. This is to ensure the existence of long term relationship between money lender and its customer. The common strat- egy in current practice are as follow, point reward to be traded in with direct prize, point reward to be converted with lucky dip, direct discount for credit card purchase, sales offering with special discount, cash Back
special card discount, buy 1 get 2. In an indirect way, some loyalty strategy also can be listed as follow: cross sell with non loan products such as insurance, savings account, cross sell with other credit cards brand within the same bank provider, cross sell with unsecured personal installment
Sumanvan & Noer Azam Achsani & Kirbrandoko
loan, simplification strategy, 1 bill under 1 credit card, and balance transfer.
As if customer take the products as listed above within one bank, it is expected that customer will keep loyal to that bank and in the end will produce long term relation- ship. Customer will think twice before re- ducing or terminating its financial relation- ship with the bank because of that depen- dency. However, since this is a consumer credit products with some credit risk in- volved, there are some critical factors to be considered such as customer capacity to pay and character. Customer character might be easier to check from past histori- cal credit performance (for those who al- ready have credit performance) howeverthe story might be different for capacity to pay. Capacity to pay will be depend on customer current condition which may very different from the beginning.
In long term situation many scenario may happen which will influence the level of customer capacity to pay. As stated ear- lier, a more loyal customer will produce better profitability to the bank. However, Baumann et all (2007) conclude that cus- tomers are loyal as a result of their current life situations (e.g. age and income) rather than resulting from a positive attitude to- wards their bank. This means, no matter how loyal the customer is, when there is income (or capacity to pay) issue in cus- tomer financial cycle, profitability will be at risk. in the end, there will be priority to be chosen by the customer which one to be taken care in the first place, which prod- ucts above the other. In operational con- cept, this is also means that there move- ment of loyalty level for the customer when they are in a normal condition along the way until they are in afinancial difficulty (de- linquent).
Finance andBanking Journal, Vol. 73 No. 2 Desember2Oli
~
bucket. Bucket will be determined by its days past due, how many days the custom- ers missed their payment (Lawver 1993).
Service level is also correlated inline with the days past due numbers. Obviously, the highest service level can be seen when the customer stay current, always pay their in- stallment or minimum payment and along with higher days past due, lower service level will be felt by the customer. This is for a simple reason, the money lender will fo- cus on getting the payment to save their asset in the first place rather than serving the customer needs. The trust level for both parties (customer and money lender) will be at risk because both parties has differ- ent interest and priority. Hence, there is a point along the days past due line where customer payment is the only thing matter. This is where Risk mitigation play a big part, to give more alternative options for the cus- tomer in making their payment, most of it in terms of payment discount or delayed payment with schedule.
METHODOLOGY AND DATA
Sampling and Conceptual Framework This research was done in one of multi- national banks in lndonesia from October 201 0 - March 201 1. Location of research covers Jakarta, Bandung, and Surabaya. Research was conducted by using descrip- tive analytical methods to describe pro- cesses and phenomena that occur through a quantitative approach based on past his- torical records for each customer in the sample.
Datafor this research come from 2types, primary and secondary. Primary data was taken from internal database, past histori- cal records. Secondary data was collected from internal company and other related sources such as previous research, news- paper, Bank of Indonesia.
Sampling for this research was done by stratified simple random sampling from list
of customers in Bank A. Sampling technique details can be seen as follow: < '
Sampling Element: Bank's customer Population: All Personal Loan customer at Bank X (around 100,000)
Sampling Unit: Customer who is still registered as Personal Loan customer in Bank X with minimum Months on Book (MOB) of 1 year (12 months).
Sampling Frame: Non Delinquent Customer and Delinquent Customer (>30 DPD)
Sampling Size: 31700
Sampling procedures: Sampling will be done by classifying the population into
4 groups (Non Delinquent - Normal Capacity to pay, and Delinquent - Non Normal Capacity to pay: Early delin- quent, Late delinquent and Restructuring accounts). Sample will be taken ran- domly from all groups to be further processed to the next step.
The main conceptual framework in this research is Loyalty and Profitability. Loy- alty will be clustered by 4 indicators: Lon- gevity, Breadth, Depth and Referrals where all of this indicators will be blended and converted into 3 different clusters.
Profitability measurement will be done through payment tracking which was made by the customers within a particular period. The payment will show whether or not it can save the accounts from further flowing to the next bucket (balance saved) and at the same time, whether or not the payment can cover the interest and late charge fees (rev- enue collected).
Buckets will play a critical role because the effect of loyalty will be tested in all buck- ets. This is to test whether capacity to pay incfluence loyalty, seeing the effect of loy- alty when customer is in normal financial condition until under financial stress.
Hypothesis
The Significance
...
(Aditya Galih Prihartono & Ujang Sumanvan 8 NoerAzam Achsani & Kirbrandokoability level for different loyalty clusters in non delinquent bucket
HZ : There is significant different profit- ability level for different loyalty clusters in early delinquent bucket
H3 : There is no significant profitability level in different loyalty clusters in late de- linquent bucket
H4 :There is significant different profit- ability level in different loyalty clusters in restructuring segment
The hypothesis was developed inline with earlier literature review where loyalty will have impact into profitabilityand within that relationship, there is gradation from the highest loyalty level into the lowest one as explained under loyalty typology.
To simplify the research operationali- zation and ensure the sample availability, buckets will be grouped into: non delin- quent (no days past due), early delinquent (1 - 29 days past due), late delinquent (30+ days past due) and restructuring seg- ment(customer under restructuring pro- gram).
Anaysis Tools
To prove the effect of loyalty on profit- ability, there are 3 analysis tools to be used: K means clustering development, ANOVA and Regression analysis. Cluster develop- ment was done by using k-means algorithm.
The decision to use k-means method is because of its practicability, relatively effi- cient with direct result. K-means also often terminates at local optimum, hence it can show the result with shorter time. On the other side, k-means is also not without weaknesses such as dealing with categori- cal data and its method to determine num- ber of k or cluster in advance.
This weaknesses, however, will not be an issue in this research because the data is not categorical and also, it is planned in advance to have 3 different cluster as part of hypothesis testing among all 3 clusters based on its Loyalty indicators. Hence, the decision to choose k-means is considered as the right approach for this research at this moment.
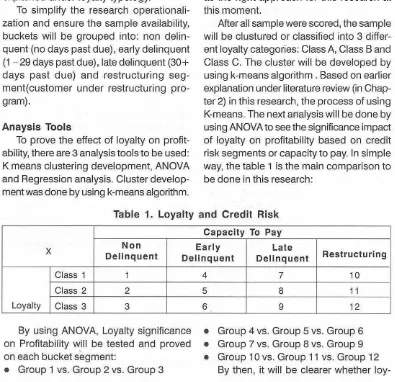
After all sample were scored, the sample will be clustured or classified into 3 differ- ent loyalty categories: Class A, Class Band Class C. The cluster will be developed by using k-means algorithm. Based on earlier explanation under literature review (in Chap- ter 2) in this research, the process of using K-means. The next analysis will be done by using ANOVA to see the significance impact of loyalty on profitability based on credit risk segments or capacity to pay. In simple way, the table 1 is the main comparison to be done in this research:
Table 1. Loyalty and Credit Risk
X
By using ANOVA, Loyalty significance Group 4 vs. Group 5 vs. Group 6 on Profitability will be tested and proved Group 7 vs. Group 8 vs. Group 9 on each bucket segment: Group 10 vs. Group 11 vs. Group 12
Group 1 vs. Group 2 vs. Group 3 By then, it will be clearer whether loy- Loyalty
Capacity To Pay Non
Delinquent
Class 1 Class 2
Class 3
Early Delinquent
1
2
3
Late Delinquent
4
5
~~~~~ 6
7
8
9
10
11
[image:12.482.62.457.270.652.2]Finance andeanking Journal, Vol. 13 No. 2 Desember 2011
alty has a significance effect on profitability for each group in each segment.
The last analysis will be done by using regression analysis. This is to see the de- pendency of profitability with loyalty. To come up with more comprehensive conclu- sion, there is a needs to see the depen- dency of loyalty to profitability when the ANOVA result shows a significant numbers. Hence, ANOVA will confirm the different level of profitability in among clusters while Re- gression will confirm the associations be- tween loyalty and profitability in each buck- ets. To come up with regression analysis, loyalty score from each indicators will be added to get a single loyalty score. This score is then regressed with average profit-
ability numbers which was came from rev- enue collected minus credit los$numbers from October 2010 until ~ a r c 6 201 1. The definition can be modeled as follow:
Loyalty score = longevity
+
depth+
breadth+
referralsProfitability = revenue collected - credit loss
RESULT AND DISCUSSIONS Longevity
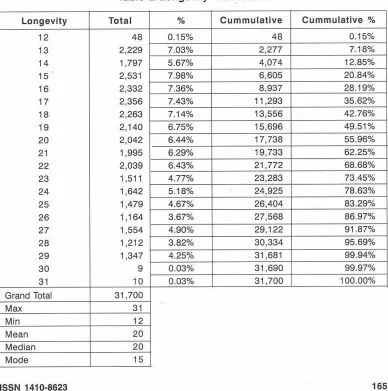
Longevity in credit management termi- nalogy is defined as Month On Book (MOB). MOB starts when banks disburse the credit to the customer's account. Table 2 shows the Longevity distribution across all samples.
Table 2 Longevity Distribution
I
LonaevitvI
TotalI
%I
CummulativeI
Cummulative %I
Grand Total Max Min
[image:13.482.35.423.290.681.2]The Sianificance ... IAditva Galih Prihaftono 8 Uiano Sumarwan & NoerAzam Achsani 8 Kirbrandoko
As shown on table 2, accounts sample than Mean and Median value. This value will were distributed with MOB 12 (the lowest) be used as the basis to determine the cut and MOB 31 (the highest). The average off scorefor Longevitycriteriafromthelow- MOB were 20 with the same Median num- esttill the highest. Below isthe summaryof bers which means that the accounts sample the score distribution after considering Max, is quitefocus at the center value, and at the Min, Mean, Median and Mode value in Lon- same time with Mode value were 15, lower gevity variable:
Table 3 Longevity Score Distribution
The Mean and Median which has the same value at 20 MOB, will get 30 points while Maxand Min numberwill get 10 points and 50 points respectively for MOB <14 and >=30. Easily we can determine the score of 20 and 40 is somewhere in between those criterium above. By looking at data distri- bution, it is proposed to give 20 points for MOB <15 and 40 points for MOB <30. By using the above criterium, half of the sample were distributed at 40 points fol- lowed by 30, 10, 20 and 50 points.
Depth
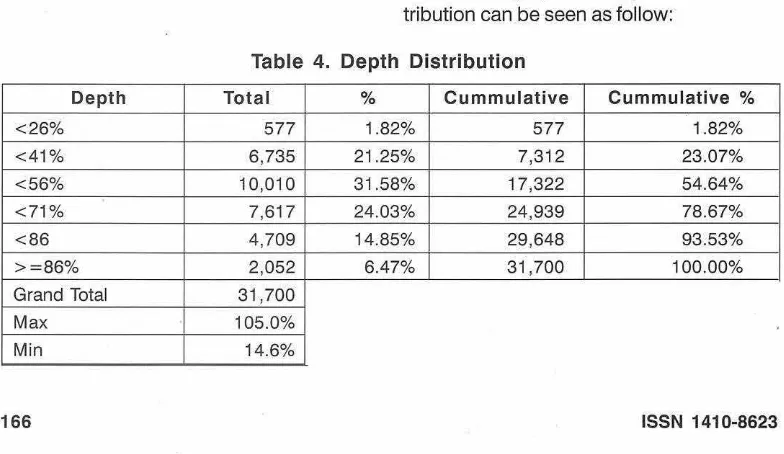
Depth is the second variable in Loyalty Score development. Depth itself can be de- fined as total monetary amount or frequency payment has been made by the customer to the bank as compared to the total mon- etary amount or tenure that they need to pay till the last installment. Depth numbers will be converted into a percentage number which shows the level of loan completion from beginning till the end. Acustomerwho has paid the loan installmentfor 18 months in a 36 months total tenure will have 50% of depth value (18136 = 50%). The detail dis- tribution can be seen as follow:
[image:14.482.59.456.162.276.2] [image:14.482.62.454.466.693.2]i
Finance andBanking Journal, Vol. 13 No. 2 Desember 201f55.9% mid point between the lowest depth %
Median 54.2% (14.6%) and the mean dept % 156%). On
50.0%
-1
the other side, cut off at 91% isdsed due tomore as judgemental approach to differen- Table 4 shows datadistribution in Depth tiate those who will finish the loan versus category. Using the same approach with those who still below 90%. Based on that, Longevity category, 30 points will be given 40 poiints will be given to the range of 56% to the midlle value 56% (with Mean 55.9%
-
<91% and 50 points will be given to those and Median 54.2%), while 10 points and 50 customer with Depth value euqal or more points will be given to those value at the than 91%.range of Min and Max numbers (14.6% and Based on the above arrangement, Depth 105%) respectively. The cut off for 20 points score distribution can be seen on Table 8. will be given to the range of 36% - 56%. a ~ f 0 l l 0 ~ :
The criteria cut off at 36% is used as the
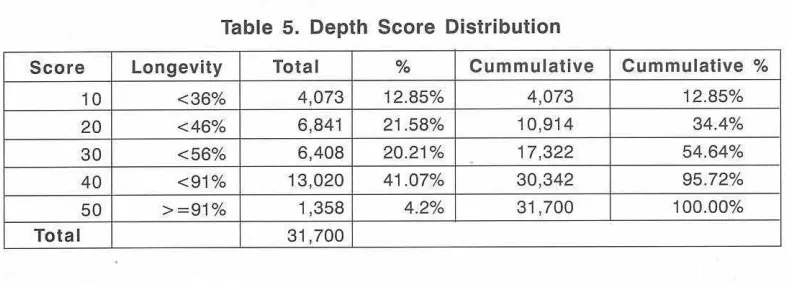
Table 5. Depth Score Distribution
By looking at Depth Score distribution, 41.07% of sample distribution were under 56% - <91% which means the customer had paid their installment more than a half from total tenure. The next portions were those customers with score 20 and 30 which means ranging from 36%
-
56%. The last one will be those <36% with 12.85% and>
=91% with 4.28%.Breadth
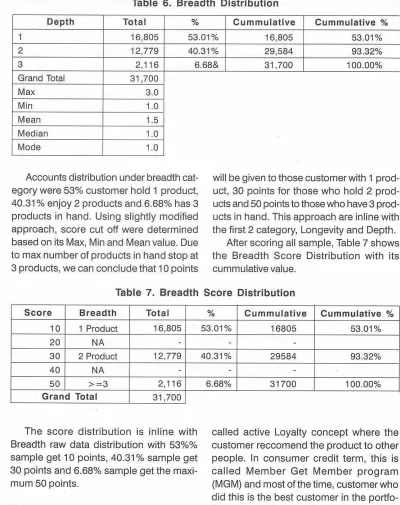
Breadth is the total products which was enjoyed or bought by the customer. Based on data collections, we are able to identify 3 other products which the customer may
[image:15.482.31.425.231.374.2]The Significance ... (Aditya Galih Prihartono & Ujang Sumanvan & NoerAzam Achsani & Kirbrandoko
Table 6. Breadth Distribution
Depth
I
Total1
%I
CummulativeI
Cummulative %I
Grand Total
Max
I
313700 3.01
Median 1 .O
Mode
Accounts distribution under breadth cat- egory were 53% customer hold 1 product, 40.31 %enjoy 2 products and 6.68% has 3 products in hand. Using slightly modified approach, score cut off were determined based on its Max, Min and Mean value. Due to max number of products in hand stop at 3 products, we can conclude that 10 points
will be given to those customer with 1 prod- uct, 30 points for those who hold 2 prod- ucts and 50 points to those who have 3 prod- ucts in hand. This approach are inline with the first 2 category, Longevity and Depth.
After scoring all sample, Table 7 shows the Breadth Score Distribution with its cummulative value.
Table 7. Breadth Score Distribution
The score distribution is inline with Breadth raw data distribution with 53%% sample get 10 points, 40.31 % sample get 30 points and 6.68% sample get the rnaxi- mum 50 ooints.
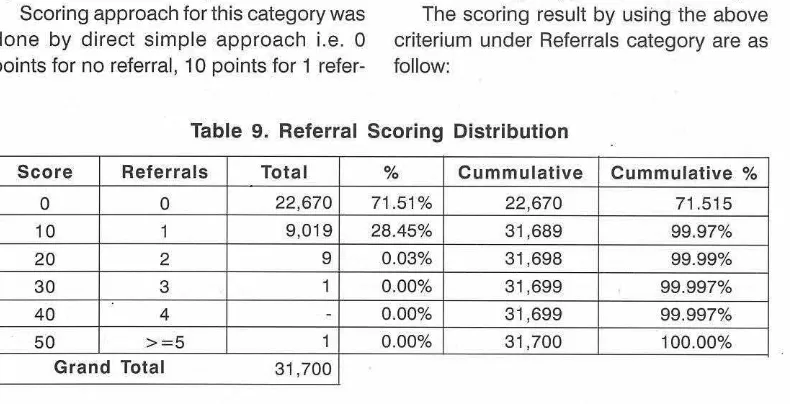
Referral
The last category in Loyalty Score de- velopment is called Referral. Referral is the total accounts which was referred by the existing customer to also enjoy the prod- ucts that they enjoy. This is one of the so
[image:16.482.60.467.51.231.2] [image:16.482.55.455.55.560.2]Table 8. Referral Distribution
1
Referral 0 1 2 - -. - -.- 1
From total samples, it was found that 28.45% referred this personal loan product to another 1 customer. Less than 0.5% re- ferred more than 1 while the other 71.51 % had never referred the accounts to the other potential customer. This can be, referral was in place but the applications was rejected by the bank due to many reasons.
Scoring approach for this category was done by direct simple approach i.e. 0 points for no referral, 10 points for 1 refer-
Total
22,669 9,020 9
brano loral Max Min Mean Median
ral, 20 points for 2 referrals, 30 points for 3 referrals, 40 points for 4 referrals and 50 points for 5 referrals and more. This ap- proach is choosed becasue there is no dif- ference in median and minimum value on referals while maximum value reach 9 refer- rals. Hence, the scoring cirterium was made based on simplicity practical used only.
The scoring result by using the above criterium under Referrals category are as follow: JI,IUU 9.00 0.00 0.29 0.00
Table 9. Referral Scoring Distribution % 71.51% 28.45% 0.03% 0.00% 0.00% Mode Cummulative 22,669 31,689 31,698 0.00 Score 0 10 20
The scoring distribution under Referral acocunt is booked. There was also no 40 category is dominated by 0 referral and it points given as a result of no total referral is followed by 1 referral. The main difference that equal to 4 accounts.
in scoring approach for Referral category
as compared to the other 3 is 0 (zero) score Overall Scaling
point for those who never refer the prod- The last four section describes about ucts to the other customer up till the loyalty development, distribution and its
~ummuiative %
71.51% 99.97% 99.99% 31,699 31.700 30 40 50 100.00% 100.00% Referrals 0 1 2
Grand Total 31,700
3 4 >=5 Total 22,670 9,019 9 1 1 % 71.51 % 28.45% 0.03% 0.00% 0.00% 0.00% Cummulative 22,670 31,669 31,698
[image:17.482.35.432.54.244.2] [image:17.482.38.433.356.558.2]The Significance
...
(Aditya Galih Prihartono & Ujang Sumaman & Noer Azam Achsani 8 Kirbrandokoscaling. To summarize and ease of overall mary of Score level and scaling per loyalty understanding, Table 13. shows the sum- indicators.
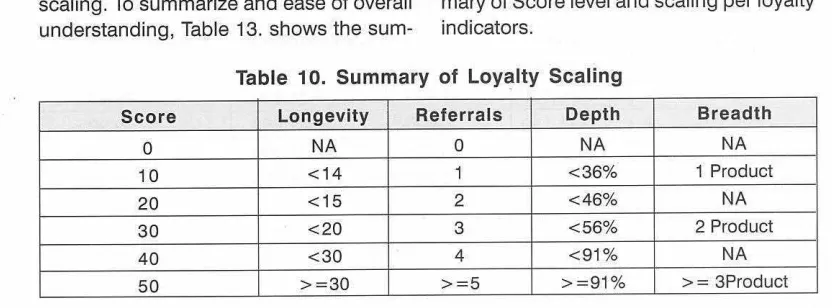
Table 10. Summary of Loyalty Scaling
As summarize on Table 10, the same approach had been used by Cheng and Chen (2009). Scaling for each indicator was done by specific criteria, considering cen- tral tendency value for each indicator. Score 0 (zero) was applied only for Referrals, while Breadth did not have Score 20 and 40. The rest of score level had been applied to all scaling.
Combination of score from each indica- tor shows the total Loyalty level of each
account in the sample. It is one from so many ways to predict customer's loyalty level and therefore, it can be used to further check its impact to profitability on all or specific segment.
Clustering Result
The result of k-means clustering after running for 4 iterations can be seen on Table
11 as follow:
Table 11. K-Means clustering result
Cluster Center
I
Cluster 1/
Cluster 2/
Cluster 3 LongevityDepth Breadth
The formula for Distance to zero point is as follow:
D= J(Cix1 - 0)2 f (Cix2 - 0)2
+
(Cix3 - 0)2+
(Cix4 - 0)2 ReferralThe distance to zero point Loyalty Score Average Number of Sample
Where:
Ci = Cluster at i.. .. . .Cluster 1, Cluster 2, Cluster 3
X1= Average score at Cluster i for the first indicator
18.40 13.43 12.95
X2= Average Score at Cluster i for the second indicator
X3= Average Score at Cluster i for the third indicator
X4= Average Score at Cluster i for the fourth indicator
Distance to zero point and Loyalty Score average on each cluster determines the Loyalty level of each customer in the clus- ter. By this segmentation, we can conclude
0.42 51.87 57.29 3,940.00
32.13 29.05 16.78
37.48 35.56 29.53 1.60
81.29 82.19 16,972.00
[image:18.482.51.467.61.215.2] [image:18.482.64.461.205.666.2]Finance and Banking Journal, Vol. 13 No. 2 Desember ZO1f
!
that Cluster 1 has the least loyalty level, set of customer and therefore, it can be used Cluster 2 has medium loyalty level and fi- to further analyze cross tabulatio'n with de- nally Cluster 3 has the best loyalty level. mography data. It is expected ihat a differ- Clustering development has been done ent level of profitability can be seen and with strong flag among itself. By using the proved by comparing this 3 cluster during cluster, we will be able to notice 3 different hypothesis te? ng in the next section.
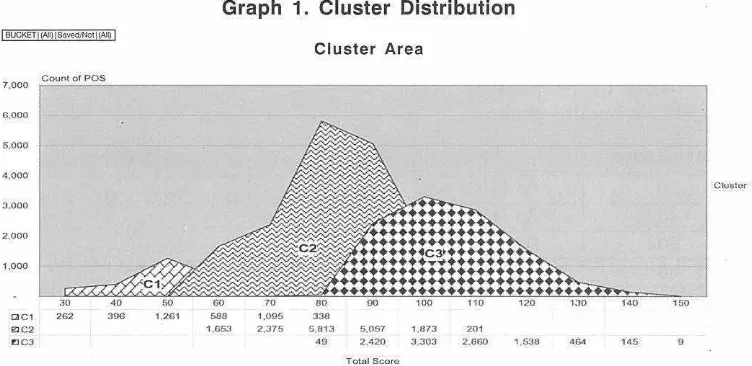
Graph 1. Cluster Distribution
I B U i m l w ~ i , S . ~ , , 1 1 1 I
Cluster Area
- -
m c z , r i 3 7 5,611 61167 l d i l 9 0 ,
m c z *D 2 120 3 SOP Z B S O 7.638 4- 4 B
T e n , swm
Correlations Analysis lation analysis was also done to know the Correlations analysis was done to check value of correlations between each loyalty the correlation value between each loyalty indicators with the total score.
indicators and total score. Besides, Corre-
Table 12. Correlations Analysis
From Table 12, among indicators the highest values were -0.223 (Breadth & Depth). The rest of correlation values were below that combination and therefore we can conclude that there is no multi- collinearity problem among loyalty indica- tors. On the other side, on correlation value between loyalty indicators and total score, Longevity has the highest correlations value at 0.605 followed by Depth and Breadth with
[image:19.482.45.421.143.326.2]The Significance
...
(Aditya Galih Prihartono 8 Ujang Sumarwan 8 NoerAzam Achsani8 KirbrandokoHypothesis Testing
Table 13. Average Profitability by Cluster & Bucket
Table 14. Profitability by loyalty group
Grand Total
Rp (2,549,381)
Rp 533,338
Rp 1,752,649
Rp 565,137
Cluster
C1 C2 C3
Grand Total
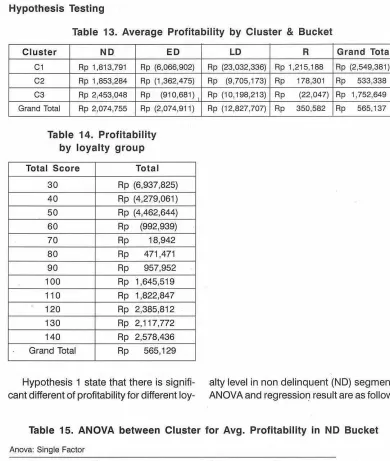
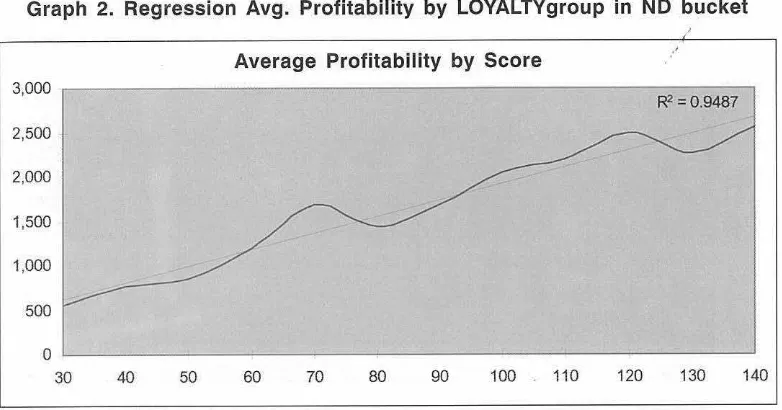
Hypothesis 1 state that there is signifi- alty level in non delinquent (ND) segment. cant different of profitability for different loy- ANOVA and regression result are as follow:
Total Score
30 40 50 60 70 80 90 100 110 120 130 140
Grand Total
Table 15. ANOVA between Cluster for Avg. Profitability i n ND Bucket
N D
Rp 1,813,791
Rp 1,853,284
Rp 2,453,048
Rp 2,074,755
Total
Rp (6,937,825) Rp (4,279,061) Rp (4,462,644) Rp (992,939) Rp 18,942 Rp 471,471 Rp 957,952 Rp 1,645,519 Rp 1,822,847 Rp 2,385,812 Rp 2,117,772 Rp 2,578,436 Rp 565,129
Anova: Single Factor
Groups Count Sum Average Variance
ANOVA
Source of Variation S S df MS F P-value F crit
ED
Rp (6,066,902)
Rp (1,362,475)
Rp (910,681)
Rp (2,074,911)
Between Groups 2,269,431,425,302,340 2 1,134,715,712,651,170 m.95 0.03 3.W
Wlthin Groups 486,145,180,043,762.WO 26,219 18,617,993,822,943
LD
Rp (23,032,336)
Rp (9,705,173)
Rp (10,198,213)
Rp (12,827,707)
R
Rp 1,215,188
Rp 178,301
Rp (22,047)
[image:20.482.61.451.53.514.2]Finance andBanking Journal, Vol. I 3 No. 2 Desernber 2Off
Based on ANOVA on table 15, it is clear that there is significance different of profit- ability within 3 different clusters. By general comparison, C1 with average profit Rp 1,810,262 and C2 with average profit Rp 1,846,209 seems to have the same value. However, the value is quite far below aver- age profit in'C3 with Rp 2,436,670. This in- formation is valid with p<0.01, F
>
F crit. This information then concludes that Hy- pothesis 3a is supported, HO is rejected.In addition, graph 3 shows R square
Graph 2. Regression Avg. Profitability by LOYALTYgroup i n ND bucket
Average Profitability b y Score
value were 0.9487 which means that there is strong correlation between loyalty and profitability in non delinquent bucket. This is asignificantvalue with P<0.001 and thus it gives evidence that loyalty does matter for those customers in non delinquent bucket.
Hypothesis 2 state that there is signifi- cant different of profitability for different loy- alty level in early delinquent (ED) segment. ANOVA and regression result are as follow:
3,000
2.500
2,000
1,500
1.000
Table 16. ANOVA between Cluster for Avg. Profitability i n ED Bucket
.
, . . . .~R~ = 0.948j
Anova: Single Factor
Groups Count Sum Average Variance
C1 415 -2517764216 -6066901.726 514,758,656,079,963
C 2 1,657 -2257621 164 -1362475.054 134,180,946,632,034
C 3 409 -372468532.1 -910681.0075 116,312,526,015,381
Source of Variation S S df MS F P-value F crlt
Between Groups 8.W8.842,472,604,030 2 4,004,421,236,302,020 20.55 0.W 3.W
Within Groups 482,769,242,670,029,000 2,478 194,622,131,628,W9
[image:21.482.35.426.54.259.2]The Significance
...
(Aditya Galih Prihatfono 8 Ujang Sumanvan 8 NoerAzam Achsani8 KirbrandokoGraph 3. Regression Avg. Profitability by LOYALTY group in ED Bucket Average Profitability by Score
F=O.5859
1
Based on ANOVA on table 16, it is clear that there is significance different of profit- ability within 3 different clusters. By general comparison, C2 with average profit Rp (1,577,297) and C3 with average profit Rp (1,215,642) seem to have slightly different value. However, the value is quite far above average profit in C1 with Rp (6,249,005). This information isvalid with p<0.01, F
>
F crit. This information then concludes that Hypothesis 3b is supported, HO is rejected.In addition, Graph 3 shows R square value were 0.5859 which means that there is correlation between loyalty and profitabil- ity in non delinquent bucket. This is a sig- nificant value with P<0.001 and thus it gives evidence that loyalty influence customers in early delinquent bucket.
Hypothesis 3 state that there is no sig- nificant different of profitabilityfor different loyalty level in late delinquent (LD) segment. ANOVA result is as follow:
Table 17. ANOVA between Cluster for Avg. Profitability in LD Bucket Anova: Single Factor
SUMMARY
G r o u ~ s Count Sum Averatle Variance
-
C 1 556 -12852043290 -23032335.64 682,089,828,145,365
C 2 1,416 -13742524447 -9705172.632 233,473,955,736,580
6 3 484 -4935934964 -10198212.74 293,119,992,176,262
ANOVA
Source of Variation S S df MS F P-value F crit
Between Groups 75,259,825,704,123,600 2 37,629,912,852,061,600 108.45 0.W 3.03
Within Groups 851,866,637,868,191,M)O 2,455 346,992,520,516,575 927,126,463,572,315,000
[image:22.498.74.465.58.259.2]Finance andBanking Journal, Vol. 13No. ZDesember2011
Graph 4. Regression Avg. Profitability b y LOYALTYgroup i n LD Bucket
Based on ANOVA on table 17, it is clear that there is significance different of profit- ability within 3 different clusters. By general comparison, C2 with average profit Rp
(1 0,464,864) and C3 with average profit Rp (1 1,034,021) seem to have slightly different value. However, thevalue is quitefar above average profit in
C1
with Rp (23,616,404).This information isvalid with p<0.01, F
>
F crit. This information then concludes that Hypothesis 3c is not supported, HO is ac- cepted.Graph 4 shows the R squarevalue were
0.7418 (P<0.001). This information confirm
I
ANOVA analysis earlier which state that Clus- ter 1,2, and 3 has different value in average profitability. It has a different conclusion with hypothesis 3c because in the first place, it was suspected, loyalty will not have any effect when customer's capacity is getting lower. This new fact is very interesting to be known because it shows the importance of loyalty even more, especially from profit- ability point of view.
Hypothesis 4 state that there is no sig- nificant different of profitability for different loyalty level in Restructuring (R) segment. ANOVA result is as follow:
< Average Profitability b y Score
Table 18. ANOVA between Cluster for Avg. Profitability in R Bucket Anova: Single Factor
SUMMARY
Groups Count Sum Average Variance
ANOVA
Source of Variation S S df MS F P-value F crit
Between Groups 85,987,867,245,934 2 42,993,933,822,987 24.18 0.M) 3.01
Wilhin Groups 953,139,014,851,591 536 1,778,244,430,693
[image:23.475.27.429.50.259.2]The Significance
...
(Aditya Galih Prihartono & lljang Surnarwan & NoerAzam Achsani & Kirbrandoko1
I
Graph 5. Regression Avg.Profitability by LOYALTYgroup i n R bucket Average Profitability by Score
2,000 - -
R2=07418
I.8,000
L . .
~Based on ANOVA on table 18, it is clear that there is significance different of profit- ability within 3 different clusters. By general comparison, all average profit in C1, C2 and C3 were different significantly with average profit at Rp 1,215,188, Rp 172,870 and Rp (22,047). This information is valid with pc0.01, F
>
F crit. This information then concludes that Hypothesis 3d is supported, HO is rejected. It was shown that the aver- age profit in C1 is higher than C2 and C2 is higher than C3. It has a different pattern with those segments under normal active ac- counts in non delinquent, early delinquent and late delinquent.On the other side, Graph 5 shows R square value were 0.0437 (p = 0.30). It means that there was weak or no correla- tion at all between loyalty and profitability in restructuring bucket. In conclusion, there is difference in profitabilityfor restructuring bucket; however, there is no dependency on each segment as can be seen from ANOVA and R square value.
CONCLUSIONS
There were interesting findings can be concluded in this research. Through hy- pothesis testing, the findings are as follow: The main factors that can sustain the rela-
tionship between customer and bank in consumer credit portfolio are loyalty. Loy- alty is the basic foundation for business re- lationship and therefore it needs to be im- proved and focused continuously. As ex- plained earlier, in this research, there were
4 loyalty indicators; Longevity, Depth, Breadth and Referrals. Those four items need to be focused and broken down into concrete implementation. The principle things to be done are to keep the customer stay as long as they can, based on their needs and at the same time, expand the products to be offered to the customersfor a more comprehensive experience with the bank and hence, with a strong service level, customer's will become product ambassa- dors which will be beneficial for the bank.
It was confirmed that loyalty in 3 different clusters differs significantly in term of aver- age profitabilityfor customers in non delin- quent, early delinquent and late delinquent bucket. This was done by doing ANOVA to the 3 different clusters which shows signifi- cant statistic result. In addition, regression analysis was also done to further check any possibility of dependency which turns out to be true and statistically proven.
I I
Finance andBanking Journal, Vol. 13 No. 2 Desember 2011 ; I
I
(
!I
'
differs significantly in term of average prof- As research findings in restructuring itability for customers in restructuring bucketshows that Cluster 1 has higher prof- bucket ANOVA was done and it showed itability then Cluster 2 and 3,it gives aclue significant statistic result. However, in afur- that actually to avoid further profitability is- ther regression analysis, lturns outthatthere sue, faster decision has to be made before was no dependency between clusters andaverage profitability for restructuring seg- ment. Regression result shows no signifi- cant correlations between loyalty group and average profitability in this segment.
The Loyalty Score had proved that more loyal customer will produce higher profit- ability then those less loyal customers. Hence, from marketing point of view, we need to know where our most loyal cus- tomers are and how to enlarge this customer base. Some marketing strategy can be done such as:
Give more incentive to the customer who stays with the bank for some period of time such as 12 months, 24 months, and 36 months. Incentive can be given in many ways such as: point rewards, discount on installment payment, small token and oth- ers. The main thing is to make customer happy and aware that we know that they have been with us for quite sometimes and we would like to thank them for using our products.
The same approach can also be done for the customers who were able to achieve a specific period of tenure such as 50%, 80%, etceteras, and a point where actually the bank had received back its principle loan which was disbursed to the customers. Congratulate them for such achievements while keep on motivating them to finish the loan with the bank.
Cross sell is another way to bind the customer with the bank. Let the customer feel the overall service from the bank, not only from consumer credit products but also other products such as insurance, deposits and investment. One roof solution will make the customer happy and beneficial for the bank.
customer records become worsen and in the end will make them unhappy not only with this one particular product, but also with the other products. Therefore, it is bet- ter to offer a settlement program with ap- propriate discounts to the customers. We might loose the opportunity to gain benefit from personal loan products but we might have another chance through other prod- ucts and this strategy will avoid relationship termination.
Active loyalty is above everything. Bank will receive direct and indirect benefit from those customers who recommend its prod- ucts to his friends, family and relatives. This behavior needs to get extra attention be- cause this is the true value of loyalty, cus- tomer feel happy and therefore they offer the same product to the other. Bank did not have to pay for their salary, did not have to pay advertisement, did not have to pro- vide working space for the customers, but yet, application comes in because its cus- tomer help them to do it. This customer has to be maintained and awarded equal to their contribution to the bank
REFERENCES
Backman, S. J., and J. L. Crompton (1991a), "Differentiating between high, spurious, latent, and low loyalty par- ticipants in two leisure activities", Jour- nal of Parkand Recreation Administra- tion, 9 (2): 1-1 7.
Baloglu, S. (2002),"Dimensions of customer loyalty: Separating friends from well- wishers", Cornell Hotel and Restaurant Administration Quarterly, 43 (i), pp. 47
- 59.
The Significance ... (Aditya Galih Prihartono 8 Ujang
Caso de la Banca en Espana", (Revista Espanola de lnvestigacion de Market- ing ESIC, Vol. 3 No. 1, pp. 9 - 33. Barsky, J. (1994),"World -Class Customer
Satisfaction", Irwin Professional Publish- ing, Burr Ridge, IL.
Baumann, C., Burton, S., &Elliott, G.. (2007),- "Predicting Consumer Behavior in Re- tail Banking", JournalofBusinessand Management, 13(1), 79-96.
Chang, T.X. and Chen, S.J. (1998), "Market orientation, service quality and business profitability: a conceptual model and empirical evidence", JoumalofSetvices Marketing, Vol. 12 No. 4, pp. 246-64 Churchill, C. (2000)," Banking on Customer
Loyalty", Journal of Microfinance,
v01.2.2, pp. 1 - 21.
De Ruyter, K. and Bloemer, J. (1998),"Cus- tomer loyalty in extended service set- tings: The interaction between satisfac- tion, value attainment and positive mood". International JournalofService Industy Management 10 (3), pp. 320- 36
Dick, A. and Basu, K. (1994). "Customer loyalty: toward an integrated frame- work", Journal of the Academy of Mar- keting Science, Vol. 22 No. 2, pp. 99- 113.
Duffy, D.L. (1998). "Customer loyaltystrat- egies", Journal of Consumer Market- ing, Vol. 15 No. 5, pp. 435 - 48. Eakuru, N., & Mat, N.. (2008),"TheAppli-
cation of Structural Equation Modeling (SEM) in Determining the Antecedents of Customer Loyalty in Banks in South Thailand", The Business Review Cam- bridge, 110(2), 129-139.
Ehigie, Benjamin Osayawe (2006),"Corre- lates of customer loyalty to their bank: a case study in Nigeria", Thelnterna- tional Journal of Bank Market- ing, 24(7), 494-508
Finlay, Steven (2008),"The Management of Consumer Credit: Theory and Practice",
I Sumanvan 8 NoerAram Achsani 8 Kirbrandoko
Palgrave Macmillian, New York, 1
-
57 Griffin, J. (1995), "Customer loyalty: How to get it, how to keep it", San Fran- cisco: Jossey-Bass Press.Hepworth, M. and Mateus, F! (1994),"Con- necting customer loyalty to the bottom line", Canadian Business Review 21 (4), pp. 40-4.
Jacoby,J. and Chestnut,R., (1978)," Brand Loyalty Measurement and Manage- ment", Wiley, New York.
Jones, T. 0. and Sasser, W. E. Jr. (1995),"Why Satisfied Customers De- fect", HatvardBusiness Revie* 73(No- vemberIDecember), 88-99.
Lach, J. (2000). "Redeeming qualities", American Demographics, Vol. 22 No.5, pp. 36
-
8Lawver, M. (1993). Development of a meth- odology for determining the adequacy of the allowance for loan and lease losses. JournalofPe~foimance Manage- ment, 6(1), 50-50.
Oliver, R.L. (1997). "Loyaltyand profit : long -term effects of satisfaction", satisfac- tion : A behavioural perspective on the Consumer, MCGraw- HillCompanies,
Inc., New York, NY
Oliver, R.L., (1999). "Whence Consumer Loyalty," JournalofMarketing, Vol. 63, Special Issue : 33 - 44.
Oppermann, M. (2000),"Tourism Destination Loyalty", Journal of Travel Research,
3 9 ( l ) , pp. 78 - 84.
Parasuraman, A,, Zeithaml, V.A. and Berry, L.L. (1994),"Moving forward in service quality research: Measuring different customer-expectation levels, compar- ing alternative scales, and examining the performance-behavioral intentions link
';
Working Paper94-114, Market- ing Science Institute.Fhance and Banking Journal, Vol. 13 No. 2 Desember 2011
Reichheld, F. F. (1993), "Loyalty-based management". Harvard Business Re-
view71 (2), 64-73.
Reichheld,
F.F.
and Sasser, E.W. Jr (1990), "Zero defections: quality comes to ser- vices", Harvard Business Review, Vol. 68 NO. 5, pp. 105-1 1.Selin, S.W., Howard, D.R., Udd, E., Cable, T.T. (1987). "An analysis of customer loyalty to municipal recreation pro- grams", Leisure Sciences, Vol. 10 pp. 217- 23.
Sheth, J., Parvatiyar, A. (1995). "Relation- ship marketing in consumer markets: antecedents and consequences", Jour- nal of the Academy of Marketing Sci- ence, Vol. 23 No. 4, pp. 255 - 71. Sheth, J.N. and Sisoda, R.S. (1999), "Re-
visiting marketing's law-like generaliza- tions", Journalof the A c a d k y ofMar- keting Science, Vol. 27 No. 1, pp. 71 - 87.
Sin, L.Y.M. and Tse, A.C.B. (2000), "How does marketing effectiveness mediate the effect of organisational culture on business performance? The case of service firms", Journalof Services Mar- keting, Vol. l No. 4, pp. 295-309. Taylor, T. B. (1 998),"Better Loyalty Measure-
ment Leads to Business Solutions",
Marketing News, 32(22), 41 -42. Yoon,
Y.
and Uysal, M. (2003), 'Rn exami-nation of the effects of motivation and satisfaction on destination loyalty: A structural model", Tourism Management
(in press).