DOI: 10.12928/TELKOMNIKA.v14i3.3544 1016
Recognition of Fission Signals Based on Wavelet
Analysis and Neural Network
Li Li*1, Liu Keqi1, Hu Gen2 1South West University of science & technology 2
Institute of Nuclear Physics and Chemistry, China Academy of Engineering Physics, City of Mianyang, China, telp:8613881173156
*Corresponding author, e-mail: [email protected]
Abstract
Because of the particularity of the uranium components, the nondestructive measuring technique is needed to detect the radioactivity of the component in certain container and identify their property to recognize all kinds of uranium components. This paper establishes a set of samples with the same shape, different weight and abundance of uranium by simulation. Secondly the cross-correlation function of time-relation signal between the source detector and the detector could be calculated. Lastly the result of cross-correlation functions is through micro-wavelet analysis to obtain feature vector which is related to the quality and abundance property of target uranium components. This vector is used to train neural network and help to identify the quality and abundance of unknown uranium components.
Keywords: micro-wavelet analysis, neural network, uranium component.
Copyright © 2016 Universitas Ahmad Dahlan. All rights reserved.
1. Introduction
The detection of uranium components is an aporia in the nuclear disarmament.Nuclear components include uranium components and plutonium components.Both the intensity of spontaneous fission of neutrons and gamma-ray in metal uranium are weak, and with strongly self-shielding effect. So it is difficult to detect metal uranium through passive detecting methods [1-3]. Some researchs based on active inducing method, which makes the exogenous neutrons enter uranium components and produce scattering, absorbing and induce fissions by active inducing uranium components [4], indicate that the neurons produced by induced fissions are scattered or cause next generation induced fissions, multi-generation fissions could form a fission chain, and the neutrons on the same chain are related [5, 6]. If the relation-ship could be sampled , described, and regular, the recognition of nuclear components could be given through analysis the relationship between the characteristic signal of components and their features.
Beacuse of the experimental data from active inducing method are disperse, varied and massive. The relation-ship is very hard to extracted and described. Traditonal mathmatics theory is hardly to work out the relation-ship function or describe model for recognition of uranium components in short time and effective [1, 6]. This paper devotes works to built wavelet packet analysis method to extract the feature signals of uranium components and use a B-P neural network to identify the property of uranium components. The micro-wavelet analysis is very efficient to deal with the disperse signals and neural network is helpful to build describe model for varied and less-related data.
2. Research method
uranium components. Uranium components are the target of fission signals feature analysis and recognition based on BP neural network in this paper.
Figure 1. Measurement model sketch map of active detecting uranium components
2.1. The Simulation of the Fission Signals by Active Inducing Uranium Components To protect the privacy of source data, all data of the active detect experiment in this paper are changed and added the noise-part on time-line. According to the active fission theory, 4 kinds of cylinder sample with different weight are selected as the experiment targets, and the weight such as 20kg, 16kg, 12kg & 10kg. The 4 cylinder samples are with different height and radius. Each sample has 4 types concentration of U235(0.2wt%, 36.0wt%, 50.0wt%, 93.15wt%). Thus the cross-correlation function should be calculated toward the 16 group data.
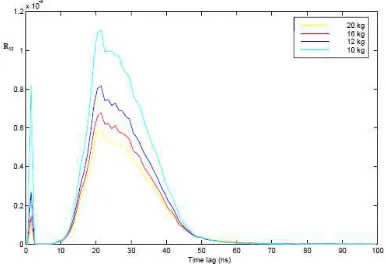
Figure 2 shows the correlation-functions of four uranium components samples with fixed mass of 20kg and different densities--- 0.2wt%, 36.0wt%, 50.0wt%, 93.15wt%, Figure 3 shows the correlation-functions of four samples with fixed density of 36.0wt% and different weight--- 20kg, 16kg, 12kg and10kg. In Figure 2, the correlation-functions curve of fixed weight (20kg) and different densities (respectively 0.2wt%, 36.0wt%, 50.0wt% and 93.15wt%) consists of two peaks. Moreover, four curves from 0ns to 20ns have no obvious difference, and from 20ns to 60ns the curves split. The reason is that neutrons in this phase was generated mainly by fission of uranium components, and the signals of this phase are related to density of components. The features of signals also are affected by time. It is obvious that in Figure 3 the first peak of correlation-functions curve is related to the weight of components, and correlation-functions from 20ns to 60ns are also related to the weight of components and affected by time. So by analyzing the correlation-functions of uranium components, the features reflected the weight and abundance of target could be got [7, 8].
Figure 2. Source-detector cross-correlation functions for uranium components of different
abundances and fixed mass (20kg)
Figure 3. Source-detector cross-correlation functions for uranium components of different
masses and fixed density (36%wt U-235)
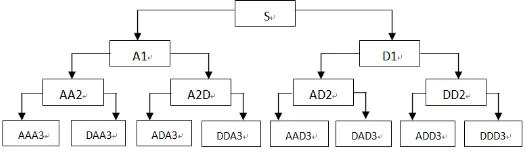
resolution, thus providing more precision analysis method for signals. Figure 4 is the three-level wavelet packet decomposition structure diagram.
Figure 4. Three-level wavelet packet decomposition structure diagram
As it could be seen from the wavelet packet decomposition structure diagram, wavelet packet decomposition compartmentalizes frequency-band to multi-levels and further decomposes high-frequency which is no subsection in wavelet decomposition. Wavelet packet decomposition could self-adapting choose homologous frequency-bandin accordance with the feature of analyzed signals and make it match with frequency spectrum of the signals to improve the resolutions of time domain and frequency domain [12, 15].
2.3. Feature Extraction Steps Based on Wavelet Packet Analysis
After going through detected system, the output signalsof different components differ in energy space distribution, in other words, the transformation of output energy includes the feature information of the components. Therefore, extracting the features of components from signals energy in every subspace distribution, namely using wavelet packet transformation to analyze signals in different frequency-band of multi-level decomposition could make unobvious signals frequency features visible with marked energy-varying form in many subspaces of different resolutions. The following is basic steps of this method [13-14], [16].
Step1: Decompose sampling signals based on wavelet packet decomposition. The decomposition layersare in line with the complexity degree of signals. Extract signal features of every frequency elements in the last layer. It adopts three-layer decompositionin this paper, and extracts frequency elementsof the third layer respectively from low-frequency to high-frequency. Figure 4 is the decomposition structure: in the figure, (i, j) represents the j-th node of the i-th layer where�=�,�,�,�.�=�,�,�,�,�,�,�,�, and ��� represents the decomposition coefficient
at the j-th node of the i-th layer.
Step2: Restructuring wavelet packet decomposes coefficient and extract signal���from every frequency band. ��� represents restructured signal of���In this paper, only nodes of the third layer are analyzed, so the total signal S could be represented by formula (1):
30 31 32 33 34 35 36 37
S S
=
+
S
+
S
+
S
+
S
+
S
+
S
+
S
(1)Step3: Compute the total energy of each frequency band. Suppose that ���is the energy of restructured signals���, then:
2 2
1
|
( ) |
|
( ) |
n
ij ij ij
k
E
S t
dt
x k
=
=
∫
=
∑
(2)In formula (2),
x k
ij( )
represents the k-th discrete point amplitude of the restructuredsignal at the i-th layer and the th node, and n represents the number of discrete points. Step4: Structure feature vector.
0 1 (2 1)
[
i,
i,
,
i i]
When energy is too powerful, the value of
E
i(2 1)i−gets bigger too, which will bring inconvenience for data analysis, so it is needed to uniformize energy. The total energy of signal
E is:
2 1
0 i
ij j
E
E
−
=
=
∑
(4)'
0 1 ( 2 1)
[
i,
i,
,
i i] /
T
=
E
E
E
−E
(5)'
T
is the vectorafter uniformizationAs it couldbe seen from formula (4), energy distance
M
ij not only counts in energysize but also the energy distribution status on time axes---representing by parameter t in formula. In this case, compared with formula (1), it could better post distribution feature of energy, thus is help to extract components attributions features. So formula (5) could be rewritten as formula (6):
(2 1)
0 1 (2 1)
1
'
[
,
,
,
] /
i i
i i i ij
j
T
M
M
M
M
−
− =
=
∑
(6)2.4. Feature Extraction of Uranium Components Fission Signals Based on Wavelet Packet Decomposition
In the process of active inducing uranium components fission, fission signals reflect abundant information of uranium components attributions. So it is feasible to get attributions information of uranium components through analyzing fission signals. But when fission signals are stochastic and non-balance, it is difficult to observe inner fission rules of uranium components from external changes. In order to find its intrinsic rules, it needs using modern technology to process primal signals. Therefore, how to extract attribution feature information from fission signals is the key of successful recognition of attributions in the attributions recognizing process. The extracted features should be sufficientsensitive to different attributions, which requires the feature extraction method could extract attribution information that hides in signals. Wavelet transformation is fit for feature extraction of non-balance signals. At present, wavelet analysis has been applied to feature extractions of many signals and achieved good results.
In the active inducing uranium components fission, its energy space distribution of output signals includes abundant attribution feature information. Therefore, it makes unobvious signals frequency features to appear with marked energy-varying form in many subspaces of different resolutions by extracting attribution features from signals energy in every subspace distribution, namely analyzing signals of different frequency band after multi-layer decomposition with wavelet packet transformation, and then extract feature information which reflects uranium components attributions.
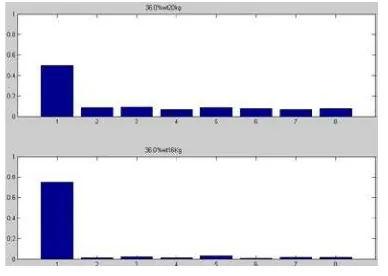
Figure 5(a). Energy distance distribution diagram of uranium components with fixed
mass (20kg) and different densities (respective 0.2wt%235U and 36.0wt%235U)
Figure 5(b). Energy distance distribution diagram for uranium components with fixed
mass (20kg) and different densities (respective 50.0wt%235U and
93.15wt%235U)
Figure 6(a). Energy distance distribution diagram for uranium components with different
masses (respective 20kg and16kg) and fixed density (36.0wt %)
Figure 6(b). Energy distance distribution diagram for uranium components with different
masses (respective 12kg and10kg) and fixed density (36.0wt %)
Te1, Te2, Te3 and Te4 respectively represent energy distance feature vectors of uranium components of different densities (respectively 0.2wt%, 36.0wt%,50.0wt% and 93.15wt%235U) and fixedmass (20kg). Tm1、Tm2、Tm3 and Tm4 respectively represent energy distance feature vectors of uranium components of different masses (respectively 20kg, 16kg, 12kg and10kg) and fixed densities (36.0wt%235U).
2.5. Identifies Masses and Abundance of Uranium Components Based on BP Neural Network
In accordance with topological structure and operation mode of network, neural network models include feed-forward multi-layer network model, feedback recursion network model, random network model and etc. The mature model in pattern recognition is error Back Propagation (BP) model, which is one of feed-forward multi-layer network models. BP network has not only input and output nodes, but also makes one layer or many layers with connotative nodes. For input information, BP propagates to connotative layers nodes at first, and then propagates to output nodes through output information of connotative nodes, and finally gives output results. Networklearning process consists of two parts---forward propagation and back propagation.
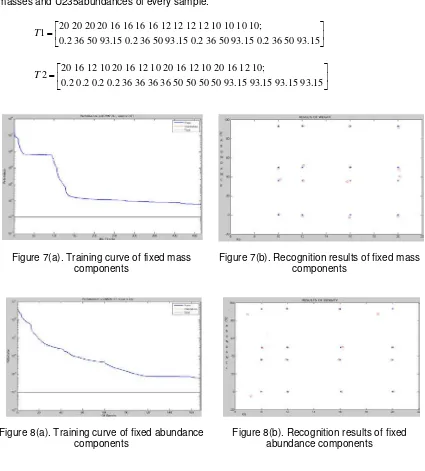
the fixed mass with different densities and the different masses with fixed density. It firstly processes and analyzes relevant simulation data, and then processes with wavelet packet decomposition, and finally gets their energy distance feature vectors which are taken as learning samples of BP neural network. Target output T1[2×16] and T2[2×16] represent the masses and U235abundances of every sample.
20 20 20 20 16 16 16 16 12 12 12 12 10 10 10 10; 1
0.2 36 50 93.15 0.2 36 50 93.15 0.2 36 50 93.15 0.2 36 50 93.15
T =
20 16 12 10 20 16 12 10 20 16 12 10 20 16 12 10; 2
0.2 0.2 0.2 0.2 36 36 36 36 50 50 50 50 93.15 93.15 93.15 93.15
T =
Figure 7(a). Training curve of fixed mass
components Figure 7(b). Recognition results of fixed mass components
Figure 8(a). Training curve of fixed abundance components
Figure 8(b). Recognition results of fixed abundance components
train signal energy distance vector of four uranium components with fixed mass and different densities, of which training process and results are represented as Figure 7(a) and (b), and then to train signals energy distance vector of four uranium components with different masses and fixed densities, which training process and results are represented as Figure 8(a) and (b).
3.Results and Analysis 3.1. The analysis of BP
Due to particularity, sensitivity and complexity of the research objects, this paper chooses a training method combining really measured data with some noise and simulation data. Paper then chooses one group of simulation data with noise to test the network. The test result of masses and abundances are as Figure 7(b) and Figure 8(b). From the analysis results in Table 1 and Table 2, it indicates that predicted value based on BP neural network designed in this paper is closer to the true value. Average relative error in Table 1 is only 0.48%, and 1.96% in Table 2. As for the density prediction, the average relative error is respectively to 27.49% and 25.35%. It also indicates from the table that for high abundance uranium, the predicted value of its abundance is close to the true value, but it is not fit for the low abundance uranium. The reason is that only the data of simulated fission for uranium components is used for BP but lack of reality data to adjust. If enough sample of low density could be used in BP, the method of decreasing the noise and increasing the accuracy for low abundance uranium would be developed.
Table 1. Prediction results for uranium components of different abundances and fixed masses taking energydistance of detected signals as feature vectors
Kg/%wt
Real Kg/%wt BP Kg/%wt Error 1 20/0.2 19.95/-1.20 0.25/116.6 2 20/36.0 20.12/40.42 0.61/10.94 3 20/50.0 20.07/48.03 0.36/4.11 4 20/93.15 20.04/92.19 0.20/1.04 5 16/0.2 15.93/-2.72 0.44/107.3 6 16/36.0 15.74/34.70 1.66/3.75 7 16/50.0 15.98/50.07 0.12/0.15 8 16/93.15 15.93/93.13 0.43/0.02
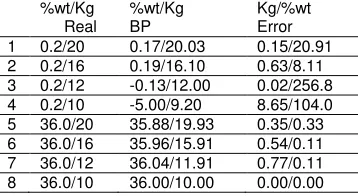
Table 2. Prediction results for uranium components of different masses and fixed abundances taking energy distance of detected signals as feature vectors
%wt/Kg
Real %wt/Kg BP Kg/%wt Error 1 0.2/20 0.17/20.03 0.15/20.91 2 0.2/16 0.19/16.10 0.63/8.11 3 0.2/12 -0.13/12.00 0.02/256.8 4 0.2/10 -5.00/9.20 8.65/104.0 5 36.0/20 35.88/19.93 0.35/0.33 6 36.0/16 35.96/15.91 0.54/0.11 7 36.0/12 36.04/11.91 0.77/0.11 8 36.0/10 36.00/10.00 0.00/0.00
3.2. The Comparison
Table 3 is a comparison between traditional experimental average-value (AVE) method BP method. BP method is faster and more effective. If put the consideration on the costs to get the basic data from the acitve-induce system(20G points would be recorded in one active-induce), BP method is more valuable and saves a lot of money and time.
Table 3. The comparsion of AVE and BP Sample
points(G) Time(s) Accuracy (%) Error (%)
BP 20G 100 92% 11%
4.Conclusion
This paper applies extraction algorithm of energy distance vectors of wavelet packet decomposition and BP neural network technology to feature analysis and recognition for active inducing uranium components fission signals on the basis of measurement principles and signal characteristics analysis from active inducing uranium component fission signals. The research result indicates that BP neural network could be taken as an analysis method for detecting uranium components attribution, which has high feasibility in terms of either model constitution or analysis results. The numerical simulation results could provide reference for verification of uranium component attribution in active inducing uranium components, and also offer technical support for further research.
Acknowledgements
This work is supported by the NSAF1117603,“Measurements of the Quality and the Abundance of Uranium Component based on Time-related Signal by Active-induced Technique”
References
[1] Szabo JL, Simon AC, Junca R. Non-destructive Analysis of Uranium and Plutonium Using X-ray Fluorescence Excited by Sealed Source or X-ray Tubes. Nuclear Instruments and Methods in Physics Research. 1994; 353(1): 668-671.
[2] Zeng KF, Ong KG, Mugle C, Grimes CA. Time Domain Characterization of Oscillating Sensor: Application of Frequency determination. Review of Scientific Instruments. 2002; 73(12): 4375-4380.
[3] Ofalt AE, Rourke PE. Development and Performance of On-line Uranium Analyzers. Wilmington.
1985.
[4] Dominic V Harper, Jason B, Roger W Fluorous. 1,2,3-Triazol-4-ylmethyl Amines and Amine Derivatives for Novel Surfactant. Australian Journal of Chemistry. 2015; 68(1): 57-68.
[5] Wibow Santoso, Deng Hepu. Multi-criteria group decision making for evaluating the performance of e-waste recycling programs under uncertainty. Waste Management. 2015; 40(1): 127-135.
[6] Álvarez-Borrego J. Position and rotation-invariant pattern recognition system by binary rings masks.
Journal of Modern Optics. 2015; 62(10): 851-864.
[7] Deshmukh Amit, Ray K. Analysis of Broadband Variations of Uranuim-slot cut Rectangular Microstrip Antennas. IEEE Antennas and Propagation Magazine. 2015; 41: 76-82.
[8] Ferguson Grant. Screening for heat transport by groundwater in closed geothermal systems.
Groundwater. 2015; 53(3): 503-506.
[9] Puspitaningrum Diyah, Paguad Jeri Apriansyah. The Analysis of Rank Fusion Techniques to Improve Query Relevance. Telkomnika. 2015; 13(4): 1495-1504.
[10] Shuai Pang, Wenbin Li, Jiangming Kan. Simulation Analysis of Interface Circuits for Piezoelectric Energy Harvesting with Damped Sinusoidal Signals and Random Signals. Telkomnika. 2015; 13(3): 767-775.
[11] Deng Zhongliang, Xi Yue, Yin Lu. Unambiguous Sine-Phased BOC (kn,n) Signal Acquisition Based on Combined Correlation Functions. Telkomnika. 2015; 13(2): 502-509.
[12] Songhao Jia, Cai Yang. Received Signal Strength Indicator Node Localization Algorithm Based on Constraint Particle Swarm Optimization.Telkomnika. 2015; 13(1): 221-229.
[13] Garcés, Jorge Eduardo. Atomistic Simulation of High-Density Uranium Fuels. Science & Technology of Nuclear Installations. 2011; 2011: 1-16.
[14] Govindarajan, Srisharan G Graybill, Brian S Makarewicz, Philip F. Assembly and Irradiation Modeling of Residual Stresses in Low-Enriched Uranium Foil-Based Annular Targets for Molybdenum-99 Production. Science & Technology of Nuclear Installations. 2013; 1(9): 1-9.
[15] Yuan Cenxi, Wang Xuming. A Simple Formula for Local Burnup and Isotope Distributions Based on Approximately Constant Relative Reaction Rate. Science & Technology of Nuclear Installations.
2016; 1(8): 1-8.