CONFERENCE COMMITTEE
Coordinator : Yandra Arkeman, Dr. M.Eng
(Departement of Agroindustrial Technology, IPB) Co-Coordinator : Nastiti Siswi Indrasti, Prof. Dr. Ir.
(Head of Departemen of Agroindustrial Technology, IPB)
International Experts:
1. Kenneth De Jong, Prof.
(George Mason University, Fairfax, Virginia, USA) 2. Kim Bryceson, Prof.
(School of Agriculture and Food Science , University of Queensland, Australia) 3. Haruhiro Fujita, Prof.
(Department of Information Systems, Niigata University for International and Information Studies Japan)
4. Gajendran Kandamsany, Dr. (United Kingdom)
5. Noel Lindsay, Prof. (University of Adelaide, Australia)
Committee Members from IPB: 1. Kudang Boro Seminar, Prof.
(Departement of Mechanical & Bio-system Engineering, IPB) 2. Marimin, Prof.
(Departement of Agroindustrial Technology, IPB) 3. Endang Gumbira Said, Prof.
(Departement of Agroindustrial Technology, IPB) 4. Suprihatin, Prof.
(Secretary of Departement of Agroindustrial Technology, IPB) 5. Ono Suparno, Prof.
(Departement of Agroindustrial Technology, IPB) 6. Agus Buono, Dr.
(Head of Department of Computer Science, IPB)
PROCEEDINGS
2
ndInternational Conference on Adaptive and Intelligent Agroindustry (ICAIA)
September 16 – 17, 2013, IPB International Convention Center
Bogor – Indonesia
Organized by :
WELCOMING ADDRESS
Prof. Dr. Ir. Nastiti Siswi Indrasti
Head of Agroindustrial Technology Department Faculty of Agricultural Engineering and Technology
Bogor Agricultural University
On
Second International Conference on Adaptive and Intelligence Agroindustry (2nd ICAIA)
Bogor, September, 16 – 17, 2013
Assalamu’alaikum Warohmatullahi Wabarokatuh In the name of Allah, the beneficent and the merciful,
Distinguish Guest, Ladies and Gentlemen
Let me first thank you all for accepting the invitation to participate in this 2nd International Conference on Adaptive and Intelligence Agroindustry (ICAIA). In particular I would like to thank Rector of IPB (Institut Pertanian Bogor/Bogor Agricultural University) Prof. Herry Suhardiyanto for supporting this event as part of the series academic event in celebrating the 50th Anniversary of Bogor Agricultural University.
In fact, the idea of organizing this conference was the continuation of the International Workshop on Computational Intelligence and Supercomputing Technology for Adaptive Agroindustry held by the Department of Agroindustrial Technology, Bogor Agricultural University last year.
Professor Kenneth A De Jong from George Mason University, US has successfully conducted joint international research with some staff from the Department of Agroindustrial Technology and Department of Computer Science, Bogor Agricultural University. The research aims to develop an integrated and intelligent system (namely SMART-TIN©) for the design of adaptive agroindustrial system in order to achieve a sustainable agroindustry that can mitigate global climate change and at the same time secure food, water, energy and natural medicine supply.
We are certainly proud to have been able to assemble this event in IPB, Bogor. The range of participants and audience at this conference is precisely something I would like to stress. The main goal of the conference is to provide an effective forum for distinguished speakers, academicians, professional and practitioners coming from universities, research institutions, government agencies and industries to share or exchange their ideas, experience and recent progress in Adaptive and Intelligent Agroindustry.
Distinguish Guest, Ladies and Gentlement,
Global climate change is the most challenging problems for us today and in the near future. This global change in our climate can lead to the shortage of the food, water, bioenergy and natural medicine that will affect the quality of human life. Many studies indicate that the threat of food, water, bioenergy and natural medicine crisis due to global climate change still worries our society. This problem can be solved by the development of agroindustry, i.e. an interrelated value chain entities from farming, to agro-processing industry and then to the end-customers. In fact, the design of agroindustry is complex and involves many factors and large data bases and more importantly, needs a good intelligence to process data and information to good decisions. Therefore, the way to design and manage agroindustry should be improved in order to meet the design objectives.
Agroindustries consume quite significant amount of energy on one side, on the other side they generate sizable amount of industrial wastes and its utilization as a captive energy resource is a kind of potential. Based on our study, a plywood industry with the production capacity of 200.000 m3/year could generate 32 percentage of solid waste. If this amount of waste used as an energy alternative, it may result on the saving of 131.037.768.597 rupiah per month. Similar to plywood industry, sugarcane industry with the production capacity of 480 ton per hour could generate 154 ton per hour of waste (bagasse) and this amount of waste contribute to the saving of energy consuming by 19.250 Kwh. Recent study we conducted, indicated that cassava starch industry may contribute to a significant amount of waste. It has also potential usage as an energy resource. Based on our study the conversion of its waste into energy will contribute to the saving of energy usage of 4100 liter biogas per ton material.
reduced. The new, incremental energy contributions that can be obtained from waste biomass will depend on future government policies, on the rates of fossils fuel depletion, and on extrinsic and intrinsic economic factors, as well as the availability of specific residues in areas where they can be collected and utilized. All of these factors should be in detail examined to evaluate the development of the industrial waste contribution. Hope this conference will also discuss this issue in more detail as it is an important matter for all of us. We should no more think just how to produce high value product but it is also necessarily important how to keep our live in good quality by understanding following old saying…” only when the last tree has been cut, only when the last fish has been angled, and only when the last river has been polluted, then we realized that we could not eat money”.
I do not to take up any more of your time with these opening remarks. Let me simply thank you once again for sharing your thoughts with us. Here’s wishing every success for the conference. May Allah bless all of us.
Thank you for your kind attention,
AGENDA of
2
ndInternational Conference on Adaptive and Intelligent Agroindustry
(ICAIA)
Time Activities Room
Day 1 (16 September 2013)
08.00 – 09.00
Welcoming Address: Prof. NastitiSiswiIndrasti (Head of Dept TIN, Fateta, IPB)
Conference Opening: Prof. HerrySuhardiyanto(Rector of IPB) o ABET Certification announcement and short ceremony o Launching International Double Degree Master Program in
Innovation and Technopreneurship in Cooperation with University of Adelaide, Australia
o Soft-launching Master in Logistik Agroindustri (Agroindustrial Logistics)
Ballroom
10.00 – 10.45 (45’)
Opening Speeches:
Prof. IrawadiJamaran (Agroindustry Guru, IPB: 25’) Prof. Eriyatno (Industrial and System Engineering, IPB: 20’)
Ballroom
Session 1 10.45 – 11.15
(30’)
Keynote Speech Dr. YandraArkeman (IPB) Ballroom
11.15 – 12.00 (45’)
Keynote Speech Prof. Kenneth De Jong (George Mason University, USA) Ballroom
12.00 – 13.30 Invited Speakers (1-4) (4 x 20 minutes) Discussion (25 minutes)
Tentative Schedule: Prof. Kim Bryceson (Australia), Prof. SyamsulMa’arif (IPB), Prof. KudangBoro Seminar (IPB), Prof. HaruhiroFujita (Japan)
Ballroom Invited Speakers (5-8) (4 x 20 minutes) Discussion (25 minutes)
Tentative Schedule: Dr. Gajendran (UK), Prof. Noel Lindsay (University of Adelaide), Dr. KuncoroHartoWidodo (UGM), Prof. UtomoSarjonoPutro (ITB)
Ballroom
Day 2 (17 September 2013) 08.00 – 08.30
(30’)
Registration
08.30 – 10.15 (105’)
Moderator: Prof. KudangBoro Seminar (IPB) Invited Speakers (9-12) (4 x 20 minutes) Discussion (25 minutes)
12.30 – 13.30 (60’)
Lunch Break
13.30 – 15.00 (90’)
Open Discussion (Open Forum) with Prof. Kenneth De Jong
Topic: Foundations and Applications of Genetic/Evolutionary Algorithms
Ballroom
15.00 – 15.30 (30’)
Conference Closing Ballroom
15.30 – 17.00 (90’)
Indonesian Agroindustry Association (AGRIN) National Congress (PIC: Prof. Suprihatin)
Ballroom
17.00 – 17.45 (45’)
CONTENT LIST
Conference Committee
Welcoming Address ….……….………... i
Agenda of 2nd ICAIA 2013... iii
Content List …………..………...………... v
A. SMART-TIN© : An Integrated And Intelligent System For The Design Of Adaptive Agroindustry (A Conceptual Framework) (Yandra Arkeman)
1‐9.
B. GHG Emission Reduction By Waste Cooking Oil Recycling In Environmental Partnership Program Of Bogor City (Haruhiro Fujita, Atsushi Yoshimoto, Katsuyuki Nakano, Koji Okuhara, Noriaki Koide, Dadang Supriatna)
10‐16.
C. Challenge of Indonesian Logistics Infrastructure for Perishables Products (Kuncoro Hartoto Widodo, Yandra Rahardian Perdana, Joewono Soemardjito)
17‐28.
D. Design Of Grouping Traditional Market Distribution Using Fuzzy Clustering And Design of Routing of Packaging Cooking Oil From Distribution Center To Traditional Market Using Traveling Salesperson Problem– Genetic Algorithm in Indonesia (Case‐Jakarta) (Teja Primawati Utami, Syamsul Maarif, Yandra Arkeman, Liesbetini Hartoto)
29‐43.
E. Determining the degree of product rightness at the conceptual stage:A Case of the Low Cost Green Car (Ade Febransyah, Fransisca Tharia)
44‐53.
F. Co‐Composting Process Of Bagasse And Sludge From Sugarcane Industry With Influence Of Difference Initial C/N Value And Aeration (Andes Ismayana, Nastiti Siswi Indrasti, Tori Sane)
54‐62.
G. Analysis Of The Competitiveness Of The Agribusiness Sector Companies Using Porter's Five Forces (M. Hudori)
63‐72.
H. Design And Optimization Of Agro‐Scm For Food And Energy Security In Indonesia (Hoetomo Lembito, Kudang Boro Seminar, Nunung Kusnadi, Yandra Arkeman) Arifin, A. Fatikunnada)
100‐112.
L. Artificial Neural Network Model Based Capacitance Dielectric For Crackers Self‐ Life Prediction (Erna Rusliana Muhamaad Saleh, Erliza Noor, Taufik Djatna, Irzaman)
113‐121.
M. Characterizing Temporal Dynamic Of Weather Variability To Support Decision Making On Weed Control (Rizky Mulya Sampurno, Kudang B. Seminar, Yuli Suharnoto, Mohamad Solahudin)
N. Risk Management Model in Dairy Product Transportation With Fuzzy Logic Approach (Winnie Septiani, Yandra Arkeman)
131‐141.
O. Strategy to Increase Institutional Capacity of Farmer Groups to Support the Transportation System Agroindustry Products (Zulfiandri, Yandra Arkeman)
142‐156.
P. Adsorption Of Carotenoid From Palm Oil Methyl Ester By Using Attapulgite And Synthetic Silica Magnesium As Adsorbent (Sapta Raharja, Prayoga Suryadarma, Zuni Fitriyantini)
157‐163.
Q. High Accuracy Agroindustry Environment Monitoring System Based on Photonic Crystal Sensor Network (Mamat Rahmat, Muhamad Azis, Erus Rustami, Wenny Maulina, Kudang Boro Seminar, Arief Sabdo Yuwono, Husin Alatas)
164‐174.
R. Study on Effect ofTemperatureIncrease on the Productivity of Methanefrom POME Fermentation (Sarono, E. Gumbira Said, Ono Suparno, Suprihatin, Udin Hasanudin)
175‐180.
S. The Design and Implementation of Geographic Information Systems to Support Food and Energy Security (Arif Purnomo Muji Basuki, Yandra Arkeman, Musthofa)
181‐191.
T. Study Of White Crystal Sugar Distribution System In Indonesia (Suripto, Yandra Arkeman)
192‐199.
U. Corncob Biodelignification Process Using White Rot Fungi (Liesbetini Hartoto, Purwoko, Elis Nina Herliyana, Cucu Rina Purwaningrum)
200‐212.
V. Color Stability of Beet Dyes Label During Heating (Endang Warsiki, Asih Setiautami)
213‐219.
W Precipitation Classification Using LVQ on Dry Season Base on Global Climate Indices Case Study in Indramayu District (Indra Kelana Jaya, Agus Buono, Yandra Arkeman)
220‐225.
X. Wood Identification Type By Using Support Vector Mechine‐Based Image (A.A. Gede Rai Gunawan, Sri Nurdiati, Yandra Arkeman)
226‐232.
Y. Fuzzy Logic Systems and Applications in Agro‐industrial Engineering and Technology (Marimin, Mushthofa)
233‐241.
Precipitation Classification Using LVQ on Dry Season
Based on Global Climate Indices
Case Study in Indramayu District
Indra Kelana Jaya
Lecturer of Institut Sains and Teknologi TD. Pardede (ISTP) Medan E-mail : [email protected]
Agus Buono
Lecturer of Computer Science Department, Bogor Agricultural University Email : [email protected]
Yandra Arkeman
Lecturer of Agro Industrial Technology Department, Bogor Agricultural University Email : [email protected], [email protected]
ABSTRACT
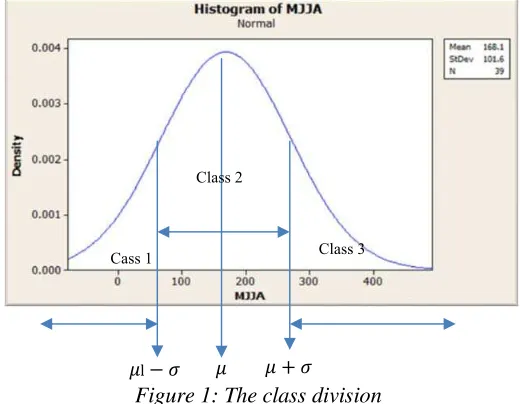
Classifications of precipitation on dry season are divided into three classes. The classes are low precipitation, medium and high intensity precipitation. The precipitation average uses as input for divided classes. The data divided by normal distribution form. The Global climate indices use as predictor’s for classification. The correlation method used to select predictor’s. The result of predictor’s selection became an input vector in classification. The learning vector quantization is use to predict the classes using input vector. The accuracy from this method is 71.05% with 100 epoch and learning rate 0.002, 0.004 and 0.005. The next research we suggest how to choose an optimal learning rate
Keywords: Indian Ocean dipole, learning rate, learning vector quantization, sea surface temperature, southern oscillation index
1. INTRODUCTION
The drought and floods phenomena are affecting the agricultural sector. The real impacts of these phenomena are decreased food crop production, especially paddy. The growth and development of paddy is influenced by rainfall. Yamamoto et al. [1] stated that there is a correlation between the rainfall variability, crop area and production of rice in Laos.
Climate variability in Indonesia is related to the ENSO (El Nino Southern Oscillation Index) [2] and IOD (Indian Ocean Dipole) [3]. The ENSO and IOD phenomena change the distribution intensity and period pattern of rainy season. Hence, early rainy season and the drought are late [4] [5]. The indicators used to monitor the ENSO are Sea Surface Temperature (SST) and the Southern Oscillation Index (SOI). Measurements zone for the sea surface temperature are Nino12, Nino3, Nino4 and Nino34. The other phenomenon that affects drought in Indonesia is IOD. IOD phenomenon is similar to the ENSO but occurs at Indian Ocean. IOD occurs because of the anomaly differences at Western Indian Ocean and the Eastern Indian Ocean sea surface temperature.
limited historical climate data on a long period of time, and the need for future climate projections (certain scenarios) to study the effects of climate change [7].
This study aims to classify the precipitation during the dry season with Learning Vector Quantization (LVQ). This classification produces intensity low, medium and high precipitation. This research used IOD, SOI and SST data to make the classification. Some study that used LVQ the application of LVQ method is mostly used for classification such as a classification in training data selection (iris and heart disease) on the UCI machine learning [8]; classification textual documents [9], and mass spectrometric classification [10].
2. MATERIAL AND METHODS
2.1 Data Collection
The data used for this study consist of:
1. Ten-day precipitation (called as dasarian) data in five areas at Indramayu district from 1971 to 2008 (38 years).
The Dasarian data in 1 year starts from January , , until to December ( , , ) The data sourced from the Climatology Meteorology and Geophysics Agency (BMKG) supported by the Center for Climate Risk and Opportunity Management in Southeast Asia and Pacific (CCROM-SEAP).
2. SOI and SST
Monthly SOI and SST data from 1970 to 2008 are used. SST consists of Nino12, Nino3, Nino4 and Nino34. SOI and SST sourced from National Oceanic and Atmospheric Administration (NOAA) can be downloaded at www.noaa.gov.
3. Monthly IOD data from 1970 to 2008 are used. IOD data sourced from Japan Agency for Marine-Earth Science and Technology (JAMSTEC) can be downloaded at www.jamstec.go.jp
2.2 Preprocessing
In this research, we focused on May to August (abbreviated as MJJA). The total intensity of precipitation on May to August dasarian data are Calculated. Calculating the precipitation of Dasarian in May , , to August , , ) from 1971 to 2008 in five area at Indramayu (equation 1). Total precipitation intensity which would be classified, obtained from average of the five regions in Indramayu (equation 2). Normalization IOD, SOI, and SST data from 1970 to 2008 using Z-score Method (equation 3): The result of preprocessing phase are average of MJJA ( ) and normalization of IOD, SOI, SST.
= variable Nino12, Nino3, Nino4 and Nino34
̅ = average of variable
= standard deviations of variable
2.3 Data Processing
The average precipitation of MJJA is divided into three classes. This class divided by using statistical method from average precipitation of MJJA, shown at Figure 1.
Figure 1: The class division
2.4 Predictor Selection
The average MJJA ( ) is a response and the variable predictor’s are IOD, SOI and SST. Calculate correlation between average precipitation MJJA with SOI, IOD and SST using Pearson correlation method (equation 4).
r= ∑ (Xi-X)(Yi-Y)
n i=1
∑ni=1 Xi-X
2
. ∑ni=1(Yi-Y)
2
(4)
2.5 Cross Validation
Leave one out cross validation (LOOCV) method used in this research. This method selects one of data as testing, and others as training data
2.6 Modeling
Algorithm LVQ method in [11] are used to classify the precipitation class. Step 0 : initialize reference vector, learning rate and alpha ()
Setp 1 : while stop condition is false, do step 2 to 6
Step 2 : For each training input vector x do step 3 to 4 Step 3 : Find J so that is a minimum Step 4 : Update as follows:
If T = then
;
If T then
Step 5 : Reduce learning rate (update learning rate) Step 6 : Test stop condition
l Cass 1
Class 2
2.7 Testing
Tests conducted thirty-eight times by using the 100 epoch and varied learning rate. Data testing was done by using Euclidean distance measurement methods.
2.8 Analyzing
This model analyze by calculating the accuracy from the classification of precipitation class. This, shows how appropriated data being classified with the actual class. Calculation accuracy is done by creating a contingency matrix. The Accuracy is calculated by dividing the correct total sample on the diagonal contingency table with the total data (equation 5).
Accuracy = ∑diagonal table
∑ x 100% (5)
3. RESULTS AND DISCUSSIONS
3.1 Correlation
Correlation between average precipitation MJJA ( ) with predictor’s (IOD, SOI, and SST) using correlation analysis. Table 1 shows the correlation analysis using 5% significance level.
Table 1 Correlation values (r) MJJA with IOD, SOI and SST
MJJA Month IOD SOI Nino12 Nino3 Nino4 Nino34
average precipitation MJJA ( )
May 0.056 0.012 0.110 -0.315 0.061 -0.167
Jun 0.041 -0.414 0.113 -0.225 -0.180 -0.244
Jul -0.126 -0.221 0.235 -0.038 0.130 -0.141
Aug 0.075 0.117 -0.077 0.196 0.021 0.017
Sep 0.137 -0.019 -0.130 0.102 0.038 -0.026
Oct 0.174 -0.126 0.007 0.183 -0.082 0.052
Nov -0.122 0.113 0.168 0.151 -0.077 0.034
Dec -0.196 -0.125 0.146 0.108 -0.134 0.024
Jan 0.399 -0.478 0.414 0.387 0.326 0.305
Feb 0.366 -0.380 0.201 0.500 0.360 0.415
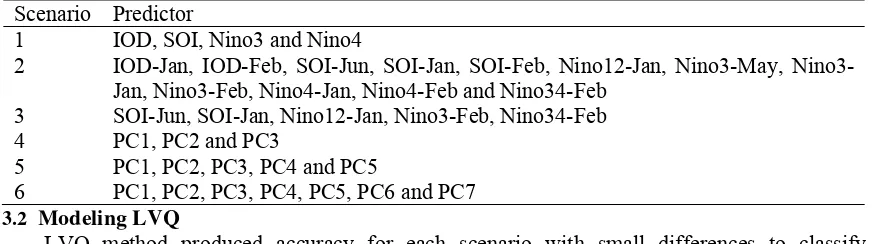
According to Pearson correlation rule table for the amount of 38 years data ( 8), Pearson value is 0.312. Hence, predictor’s for classification consists of correlation values between (r) ≥ 0.312 and (r) ≤ -0.312. This study will use six scenarios to obtain the best model which has high accuracy. On the first scenario we use all of variables. Next Scenario we uses Pearson value rule. On the third scenario we choose the highest correlation each variable, and the others we use principal component analysis method. The complete scenario’s shown at Table 2.
and fifth scenarios. The first scenarios we modeled by using all of the global climate indices index data. The third scenarios we choose the highest correlation each variable. The other scenarios are fourth and sixth scenarios using principal component analysis with Eigen value 75% and 95%.
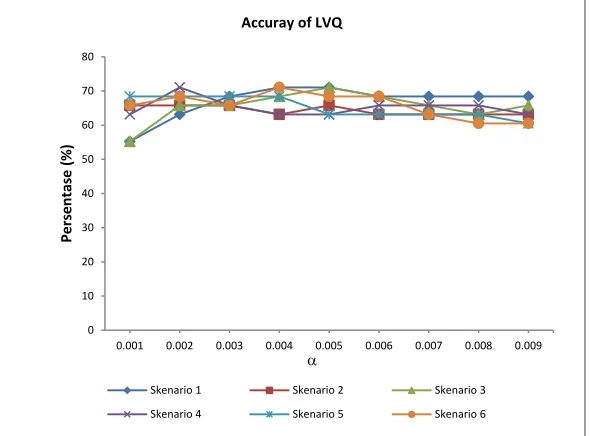
Figure 2Accuracy of LVQ
4. CONCLUSION
Classification of precipitation on dry season which divided into three classes can be implemented by using LVQ method. The accuracy of this classification is 71.05%.For the future work, we suggest to add the longer precipitation data and choose the best variety learning rate.
5. ACKNOWLEDGMENT
Thank you to Center for Climate Risk and Opportunity Management in Southeast Asia and Pacific (CCROM-SEAP), BAU, for the supported data.
6. REFERENCES
[1] Yamamoto Y, Furuya J, Suzuki K, Ochi S. 2002. Estimation of rainfall distribution and its relation to rice production in Laos.
http://www.gisdevelopment.net/application/agriculture/production/ma06_69b.htm
[2] Naylor RL, Falcon W, Wada N, Rochberg D. 2002.Using El-Niño Southern Oscillation Climate Data to Improve Food Policy Planning in Indonesia, Bulletin of Indonesian Economic Studies, 38, 75-91.
[3] Ashok K, Guan Z, Yamagata T. 2001: Impact of the Indian Ocean Dipole on the Relationship between the Indian Monsoon Rainfall and ENSO. Geophys Res. Lett., 28, 4499–4502.
[4] Naylor RL, Battisti DS, Vimont DJ, Falcon WP, Burke MB. 2007. Assessing the risks of climate variability and climate change for Indonesian rice agriculture, Proc. Nat. Acad. Sci., 104, 7752-7757.
[5] D'Arrigo R, Wilson R. 2008. El Nino and Indian Ocean Influences on Indonesian Drought: Implications for Forecasting Rainfall and Crop Productivity. International Journal of Climatology. 28: 611–616.
[6] Estiningtyas W. 2012. Pengembangan Model Asuransi Indeks Iklim Untuk Meningkatkan Ketahanan Petani dalam Menghadapi Perubahan Iklim [disertasi]. Bogor(ID):Institut Pertanian Bogor.
0.001 0.002 0.003 0.004 0.005 0.006 0.007 0.008 0.009
Persentase
(%)
Accuray of LVQ
[7] Buono A, Faqih A, Boer R, Santikayasa IP, Ramadhan A, Muttqien MR, Asyhar M. 2010. A Neural Network Architecture for Statistical Downscaling Technique: A Case Study in Indramayu District. AFITA 2010 International Conference; Bogor 3-7 Okt 2010.
[8] Pedreira CE. 2006. Learning Vector Quantization with Training Data Set. IEEE Transaction, 28(1), 157-162.
[9] Umer FE, Khiyal MSH. 2007. Classification of Textual Document Using Learning Vector Quantization. Information Technology Journal 6(1), 154-159.
[10] Villman T, Schleif FM, Kostrzewa M, Walch A, Hammer B. 2008. Classification of mass-spectrometric data in clinical proteomic using learning vector quantization methods. Bionformatics. 9(2), 129-143. doi:10.1093/bib/bbn009.