Laboratory Trial Works on The Whole Process of Foamed
Asphalt Production
P
ERCOBAANL
ABORATORIUMT
ERHADAPK
ESELURUHANP
ROSESP
EMBUATANF
OAMEDA
SPHALTSri Sunarjono
Centre For Transportation Studies, Master of Civil Engineering, Department of Civil Engineering, Universitas Muhammadiyah Surakarta, Jl. A. Yani Pabelan Kartasura Tromol Pos 1,
Surakarta Post Code 57102 Telp. 0271 717417 ext. 159,
e-mail: [email protected]
ABSTRACT
Foamed asphalt is a road pavement material which is normally produced using cold mix system. During production process, the bitumen is changed to the form of foam before it is mixed with the wet and unheated aggregates. The mixing result is a unique asphalt mixture in which its performance is unlikely the conventional hot mix asphalt. This paper reports the results of laboratory trial works of foamed asphalt production, starting withmachine settings, foamedbitumen production, mixingandcompactionprocess, untilthe specimenobservation. Materials used in this study are crushed limestone aggregates and three different penetration bitumen grade. The foamed bitumen was generated using a laboratory foaming plant i.e. Wirtgen WLB 10, whereas the materials were mixed using a 20 quarts Hobart mixer and compacted using a gyratory compactor. This paper describes all of production stages included setting up the foaming plant, setting the rate of bitumen spraying, foam product-ion, mixing process, compaction, and characterizing the specimens using X-Ray scanner. It can be deduced that setting of the water and air pressure, bitumen temperature, and foaming water content are the most important aspects of foamed asphalt production in order to generate the best results. It was understood that the type of mixer agitator, mixing time and speed were major aspects affecting quality of the mixture during mixing process, whereas the compaction setting either density setting or number of gyratory setting may be considered properly in order to achieve the best characteristic. Furthermore, the X-Ray scanning result give an important knowledge to differ the visual mechanical structure between foamed asphalt and hot mix asphalt.
Key words: Laboratory trial work, foamed asphalt, mixing, compaction, X-Ray scanning
ABSTRAK
Foamed asphalt adalah bahan perkerasan jalan yang pada umumnya diproduksi dengan sistem pencampuran dingin. Selama proses produksi, bahan aspal diubah ke dalam bentuk foam sebelum disemprotkan terhadap agregat dalam keadaan dingin dan basah. Sistem pencampuran dingin ini menghasilkan campuran yang sangat berbeda dengan material konvensional hot mix asphalt. Tulisan ini melaporkan hasil pekerjaan percobaan skala laboratorium terhadap material foamed asphalt, dimulai de-ngan pengaturan mesin, produksi foamed bitumen, proses pencampuran dan pemadatan, hingga pengamatan benda uji. Bahan yang digunakan dalam percobaan adalah batu pecah jenis limestone dan tiga jenis aspal penetrasi yang berbeda. Foamed bitumen diproduksi menggunakan laboratory foaming plant yaitu jenis Wirtgen WLB 10, sedangkan proses pencampuran komponen bahan menggunakan Hobart mixer berkapasitas 20 quart dan dipadatkan menggunakan Gyratory compactor. Tulisan ini memberi penjelasan secara lengkap seluruh tahap proses produksi, yaitu pengaturan alat foaming, pengaturan ke-cepatan penyemprotan aspal, produksi foam, proses pencampuran, pemadatan, dan analisis karakteristik benda uji meng-gunakan X-Ray scanner. Berdasarkan hasil percobaan dapat disimpulkan bahwa pengaturan tekanan air dan udara, suhu as-pal, dan kadar air pembusaan merupakan aspek-aspek yang sangat penting dalam proses produksi foamed asphalt agar mem-berikan hasil yang baik. Jenis agitator pencampur, waktu pencampuran dan kecepatannya, diketahui sebagai aspek-aspek yang mempengaruhi kualitas campuran selama proses pencampuran. Sedangkan pengaturan pemadatan, baik pengaturan nilai kepadatan atau jumlah gyratorynya perlu diperhatikan secara seksama agar mendapatkan karakteristik campuran terbaik. Se-lebihnya, percobaan X-Ray scanning memberikan informasi pengetahuan mengenai perbedaan secara visual antara struktur mekanika foamed asphalt dan hot mix asphalt.
Kata-kata kunci: Percobaan laboratorium, foamed asphalt, pencampuran, pemadatan, X-Ray scanning
INTRODUCTION
Foamed asphalt is a friendly road material which has been successfully implemented in many roads across the world. The use of this mixture can potentially saves energy and fuel con-sumption and reduces greenhouse gas emission. Discussion of this material can be found in Widyatmoko and Sunarjono (2007) and Sunarjono (2007) in terms of considerations to implement this technology for road construction in Indonesia.
Foamed asphalt is produced by mixing of sprayed foamed bitumen and homogenous wet aggregates. Foamed bitumen, as foamed asphalt binder, is in essence a steam gas-hot bitumen mixture that can be generated by injecting pressurised air and a small quantity of cold water into a hot bitumen phase in an ex-pansion chamber (Figure 1) which is installed in a laboratory foaming machine, e.g. the Wirtgen WLB 10 as shown in Figure
2. The foamed bitumen produced is collected in a special steel measuring cylinder and then its maximum increased volume is measured by a dipstick. The ratio of this value to the original bi-tumen volume (known) is calculated as maximum expansion ratio (ERm), whereas the time needed by the foam to collapse to half its maximum volume is recorded as the half-life (HL). Both ERm and HL values are affected by foaming water content (FWC - % by bitumen mass), small quantity of water which is added in-to hot bitumen. Discussion and an example of foaming charac-teristics related to the relationship between FWC, ER, and HL can be seen in Jenkins et al (1999) and Sunarjono et al (2007).
tem-perature. In foamed asphalt production, if the predetermined ag-gregate moisture is incorrect and the quantity of fine particles is insufficient, the resulting mixture becomes unworkable (Brennen et al., 1983). Moreover, if both moisture and fines have been pre-pared correctly, but this is not accompanied by proper design of selected foamed bitumen characteristics (Muthen, 1999) and sui-table mixing (Long et al., 2004); the resultant mixture will be in-consistent and hence its performance will be unpredictable.
As is common for cold-mix asphalts, the strength of foam-ed asphalt at early life develops with loss of moisture (Jitareekul et. al., 2007 and Sunarjono, 2007). In a pilot scale project (Nunn and Thom, 2002), foamed asphalt at very early life exhibited stiffness typical of unbound material. Based on Falling Weight
Deflectometer (FWD) data, the stiffness at 20oC of the foamed
asphalt layer was found to increase from <1000MPa (at early li-fe) to 3500MPa (at one year). The mixture developed to gain sa-tisfactorily high stiffness levels within 6 months. Additionally, discussion of foamed asphalt properties in terms of fatigue and rutting performance can be seen in Sunarjono (2006) and Sunar-jono (2009) respectively.
Due to the unique characteristics of this mixture as men-tioned above, it is very demanding to conduct a laboratory trial works in order to understand the whole process protocol of foam-ed asphalt production. This paper describes all of production sta-ges included setting up the foaming plant, setting the rate of bitu-men spraying, foam production, mixing process, compaction, and characterizing the specimens using X-Ray scanner. The aim of this study is to give a better understanding of foamed asphalt pro-duction in order to achieve the best mixture performance.
Figure 1. Foamed bitumen produced in an expansion chamber
Figure 2. Laboratory Foaming Plant type Wirtgen WLB 10
MATERIALS USED FOR TRIAL
The aggregate used in this study was virgin crushed lime-stone. Particle gradation as shown in Figure 3 was designed to be within the ideal grading envelope for foamed asphalt as recom-mended by Akeroyd and Hicks (1988). The maximum dry
densi-ty and optimum moisture content were found to be 2.242 Mg/m3 and 6.4% respectively, determined in accordance with BS EN 13286-2: 2004 (modified Proctor).
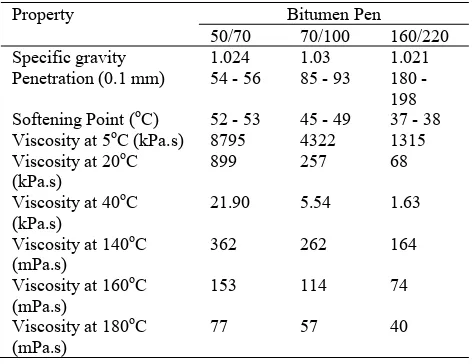
Three bitumen grades were used in this trial i.e. Pen 50/70, Pen 70/100 and Pen 160/220. The properties of these bitumens are shown in Table 1 (Sunaryono, 2010). The bitumen viscosities were measured using a Dynamic Shear Rheometer (DSR) at a
frequency of 0.1 Hz for temperatures of 5, 20 and 40oC and a
Brookfield rotary viscometer for temperatures of 140oC to 180oC.
It can be seen that the differences in viscosity values of the 3 bi-tumen grades increase with decreasing temperature.
0
) Grading env elope
(Akeroy d & Hicks, 1988) 20mm graded crushed limestone aggregate
Figure 3. Gradation of Virgin Crushed Limestone aggregate
Tabel 1. Properties of bitumen pen 50/70, 70/100 and 160/220
Property Bitumen Pen
50/70 70/100 160/220
Specific gravity 1.024 1.03 1.021
TRIAL RESULTS AND DISCUSSION
Setting up the Wirtgen WLB 10 foaming plant
The foaming plant used in this study was a Wirtgen WLB 10, developed in 1996 (Figure 2). This mobile plant was specially designed to produce foamed bitumen under laboratory condi-tions, to investigate foamed bitumen characteristics and to gene-rate foamed asphalt mixes as well. The bitumen temperature
(a-vailable up to 200oC) and foaming water content (available up to
10 %) can be controlled by this machine in order to investigate the optimal application rate for asphalt mixes.
The operation system of this plant can be described as follows:
1. The fluid hot bitumen is circulated in a pipe by a bitumen
pump from a bitumen tank, through the expansion chamber and returned to the bitumen tank via a return pipe. This cir-culation will operate whenever the machine is switched on.
2. The amount of water that will be added into hot bitumen is
dis-charge timer. For this machine, one second will produce 100 grams of foamed bitumen.
3. The air pressure and water pressure are controlled separately
by pressure gauges.
4. When the foam start button is pushed, the 2.5mm valve will
open and hot bitumen flow inside the pipe will be pushed out by 1.5 bars pressure to the expansion chamber in which at the same time water and air are injected together. The created fo-am in the expansion chfo-amber is then sprayed out via a spray nozzle at 100g per second.
The foaming machine has been many times tried to produce the best quality of foam. The nozzle was also set to enable spray-ing of water and air under a certain pressure at the chamber. The pressure was finally set at 6 and 5 bars for water and air pressure respectively, which was found to produce the best foam over the full range of pressures investigated. It is noted that the water pressure should be higher than the air pressure to enable water spraying.
Setting the rate of bitumen spraying and foaming water content (FWC)
Bitumen spraying rate is the mass of foam production per second. This machine was designed to produce foam at 100 grams per second. The foam production is controlled by a dis-charge timer. It means that when the timer is set at certain num-ber of seconds e.g. 1.5s, the foam produced contains about 150g of bitumen. It is recommended to check the bitumen spraying rate regularly. When checking the bitumen spraying rate, the water valve should be closed to allow production of bitumen only. The bitumen spraying rate was investigated using bitumen pen 160/220. The result of investigation gave values in a reasonable range i.e. 104 g/second on average.
FWC is controlled by a water flow meter in which water flow rate can be set related to bitumen spraying rate. Wirtgen provided a table of relationship between FWC (% of bitumen mass) and water flow rate setting (litre/ hour) as shown in Table 2, for a bitumen flow rate of 100 grams/second. Using this table, the water needed to be added to the bitumen phase can be set ea-sily using the provided water flow meter.
Table 2. Water flow rate setting
FWC (%) 1 2 3 4 5
Trial works to generate foamed bitumen
In the WLB 10 foaming machine, foamed bitumen is gene-rated by injecting pressurised air and a small quantity of cold wa-ter into a hot bitumen phase in an expansion chamber. Soon afwa-ter spraying into a special container, the bitumen foam expands ra-pidly to its maximum volume followed by a rapid collapse pro-cess and a slow, asymptotic return to its original bitumen volume.
For example, 500g of hot bitumen injected using 10g of cold water (2% of bitumen mass) normally results in foam with a maximum volume around 15-20 times that of the bitumen. The ratio between maximum foam volume achieved and the volume of original bitumen is termed the maximum expansion ratio (ERm). The ERm value is mainly dependent upon the amount of water added, namely the foaming water content (FWC). ERm in-creases with higher FWC. After reaching its maximum volume, the foam dissipates rapidly accompanied by steam gas escaping.
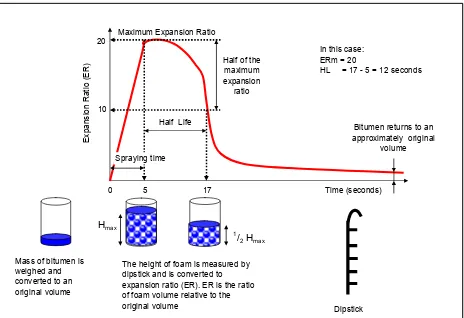
The time that the foam takes to collapse to half of its maximum volume is called the half life (HL). In the above example, HL would normally be between 20-30 seconds. After a particular ti-me (around 60 seconds), the foam voluti-me reduces very slowly and asymptotically. During this phase, foam bubbles still survive even though the bitumen has become harder. Figure 4 illustrates the process of foamed bitumen generating, and the testing me-thod to measure ERm and HL.
Regarding the generating process of foamed bitumen, it is supposed that foamed bitumen comprises air, steam gas, liquid bitumen and a little remaining water. When foam is investigated in a measuring cylinder, steam gas is seen clearly forming bub-bles which are wrapped by liquid bitumen. The gas bubbub-bles ap-pear to be rising to the surface boundary (looking like water boil-ing) whilst the liquid bitumen descends during foam dissipation due to the gravity effect. Foam bubbles appear larger when foam volume reduces. It is also understood that bitumen temperature during foaming reduces significantly to around the boiling point of water. Thus, foam properties change in several ways with e-lapsed time, i.e. temperature drops, gas content reduces, volume decreases, density increases, and bubbles expand & collapses. The bitumen state also changes from liquid to foam, returns back to liquid, and then moves to a viscous and solid condition. Thus, foamed bitumen is an unstable material with complex properties.
0 5 17 Time (seconds)
Bitumen returns to an approximately original
volume
Mass of bitumen is weighed and converted to an original volume
The height of foam is measured by dipstick and is converted to expansion ratio (ER). ER is the ratio of foam volume relative to the original volume
1/ 2 Hmax
Hmax
Dipstick
Figure 4. Illustration of the foamed bitumen generating process, and ERm & HL measurement
Steam loss during foaming
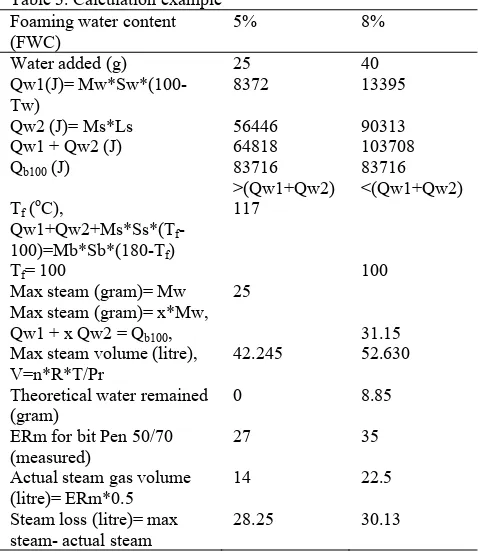
In the experiment, it was observed that some steam escaped during the foaming process and some water still remained in the foam. The evidence of escaping steam may cause a significant re-duction of foam volume and foam quality; the remaining water is probably caused by the presence of water droplets in the wet ste-am when it fails to become dry steste-am (e.g. when 40g water is added). If water droplets remain during the foaming process at lower FWC (e.g 5% or using 25g of water), it may be that some of the steam also condenses during the evaporation process.
Figure 5 shows the actual and theoretical maximum steam
volume when 500g of hot bitumen at a temperature of 180oC is
steam volume is lower than the theoretical maximum steam volu-me, indicating steam loss (steam escaping or condensing) during foaming process (especially during the foam spraying phase). The steam loss becomes greater as FWC increases up to 6%.
-20
Water added to the bitumen phase
Figure 5. The actual and theoretical maximum steam volume
Table 3. Calculation example Foaming water content
Max steam (gram)= x*Mw,
Qw1 + x Qw2 = Qb100,
25
31.15 Max steam volume (litre),
V=n*R*T/Pr
Actual steam gas volume (litre)= ERm*0.5
14 22.5
Steam loss (litre)= max steam- actual steam
28.25 30.13
The theoretical maximum volume of steam is calculated using Eq. 1 as follows:
Pr*V = n * R * T
V = n * R * T / Pr (1)
where:
V = volume (litres)
Pr = pressure in atmospheres (atm)
n = number of moles = mass/ atomic mass of compound R = Universal constant = 82.0545 (atm. Litre/mole. Kelvin) T = temperature (Kelvin)
At a FWC of 5%, mass of water = 5%*500g = 25g (500g is mass of bitumen used)
atomic mass of water = 2*1.06 + 16 = 18.12
Measuring maximum expansion ratio (ERm) and half-life (HL)
The testing method to measure ERm and HL is illustrated in Figure 4. The ERm and HL were investigated using bitumen Pen.70/100 and Pen.50/70, and at various FWCs and at a bitumen
temperature of 180oC. These three aspects are considered in order
to vary the properties of the foamed bitumen. The investigation results can be seen in Figure 6. The experiments were conducted twice for each sample, in which for bitumen pen 50/70 were con-ducted visually, whereas for bitumen Pen.70/100 were recorded using a digital video camera. Due to the foam volumes changing rapidly, the visually records were not very precise. The sensitivi-ty of ERm is probably about 3 and that of HL about 5-10 se-conds.
The experiment was conducted using 500 grams of bitumen for FWC less than 5%, and using 250 grams of bitumen for FWC greater than 5%, so that the expanded foam volume did not to ex-ceed the capacity of the measuring cylinder. At a FWC of 5%, for bitumen Pen.50/70, the ERm value when recorded using 500g of bitumen was lower than when using 250g of bitumen (different by about 3), but the HL was approximately the same; conversely, for bitumen Pen.70/100, the ERm exhibited similar values, but the HL of the 250g sample was 2 seconds longer than with 500g. These slightly different results may be caused by effects of the bitumen gravity, and the measuring cylinder size.
FWC was found to affect significantly the ERm and HL va-lues. The ERm values increase with increasing amount of foam-ing water. It can be understood that more FWC application means more water added into hot bitumen. This will generate more ste-am and hence create more and larger foste-am bubbles. The foste-am vo-lume becomes higher or the gas content increases and therefore the measured ERm increases. The HL values tend to behave in an opposite manner to ERm. This can be understood in terms of the foam structure; when gas content increases, the bubble film (lamella) becomes thinner and the resulting foam becomes more unstable. This means that a foam with higher ERm will tend to have a shorter half life. In other words, wet foams will tend to be more stable than dry foams.
Interestingly, increasing the FWC from 1 to 2% resulted in a doubling of the ERm value but at higher FWC’s the increase was more moderate. Similarly, increasing the FWC from 1 to 2% causes the HL to decrease sharply and beyond a FWC of 2%, the HL stabilises at an almost constant value.
The constant values of HL at high FWC are thought to re-late to the effect of foam temperature. More added water in the foaming process requires more heat energy from hot bitumen and hence the resultant foam temperature will decrease. This low temperature will cause foam bubbles to collapse more slowly. This effect may balance the gas content effect and hence this re-sults in constant HL values at high FWC.
In general, two important points can be drawn from the re-sults as follows:
o FWC and binder type influence the ERm and HL values,
whereas bitumen temperature is also supposed to affect tho-se two values.
o Foams with high ERm generally have low HL. At FWC of
1%, the ERm is lowest and the HL is longest for a given binder type and temperature. However, at high ERm (FWC
0 Using machine Wirtgen WLB 10 Bitumen temperature at 180 C Sample mass 500 g (FWC 1% - 5%)
Figure 6. Characteristics of foamed bitumen generated using bitumen Pen. 50/70 and Pen. 70/100 over full range of FWC
(1%- 10%)
Mixing process
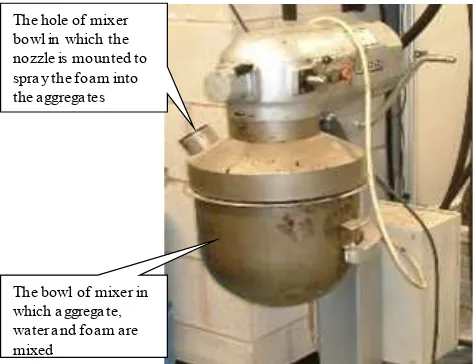
Mixing was carried out using a 20 quarts Hobart mixer (Fi-gure 7) which was mounted on the foamed bitumen plant (Fi(Fi-gure 8). The aggregates were added with water in the mixer bowl and then they were mixed for about one minute to achieve homogene-ous condition. While aggregate mixing was in progress, foamed bitumen was sprayed from the nozzle into the bowl and directly mixed with the wet aggregates for another one minute. The mix-ing time of foam mix was related to the approximate time needed for the foam to collapse after spraying.
The hole of mixer
Figure 7. Hobart Mixer 20 Quarts Capacity
The amount of water added to the aggregate was selected at 4.6% (percentage by dry aggregate mass) which is approximately 72% of the optimum moisture content (OMC) value (6.4%). At this point, the most homogeneous mixture in terms of foam dis-persal in the aggregate appeared to be obtained. When the water was added at OMC or more, the foam was not uniformly distri-buted and the mixture had a spotty appearance.
The Hobart mixer has several types of agitator. In this stu-dy, two types have been tried namely a spiral dough hook and a flat type (Figure 9). The latter type gives better mixing speed but has degradation problems. Its wide frame gives less than 15mm space between the frame and the mixer bowl wall so that any stone larger than this will cause the agitator not to work properly and may potentially be broken. On the other hand, the spiral dough hook has a single spiral rod so that it has no space problem but gives segregation problems. The fine aggregates will sink du-ring mixing and the agitator can not reach them properly. It was
therefore suggested to use aggregates with a maximum size of 10mm when using the flat agitator to avoid degradation pro-blems, and to do hand-mixing before and after spraying foam to avoid segregation.
When foam is sprayed from the nozzle into the mixer bowl, a part of the foam becomes attached to the agitator. This means that not all sprayed foam will mix with aggregate. From much evidence, it was found that the amount of bitumen attached to the agitator was around 20 to 30 percent of the sprayed foam. There-fore, agreeing with a Wirtgen suggestion (Wirtgen, 2005), this study applied 20% and 25% additional foam for the spiral dough hook and flat type agitator respectively.
Figure 8. The Hobart mixer was mounted onto the foaming plant
Figure 9. Two types of agitator used in this study, Left: Spiral dough hook type; Right: Flat type
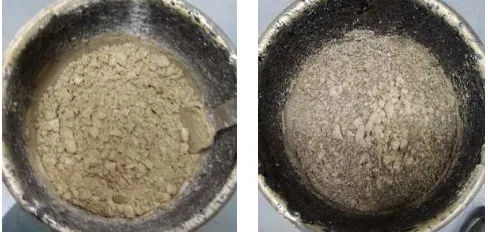
Loose material of foamed asphalt
A 20mm well graded limestone aggregate was mixed with 4% foamed bitumen (percentage by weight of dry aggregates). Figure 10 left shows the homogeneous wet aggregate before fo-aming, in which water was understandably concentrated in fines particles due to suction effects between particles. When foam was sprayed onto these wet particles, it appeared that the foam preferred to distribute on the fine particles (see Figure 10 right). When the flat type agitator was used, the foam seemed well dis-tributed and separated into fine particles; however, when the dough hook was used, the foam was not as well distributed and separated.
Over-all, the foamed-mixture looked like a moist aggregate, coloured brown rather than black.
When the same aggregates were mixed with 6% foam, the result was not too different from the previous mixture (using 4% foam), except in the colour. It looked darker in colour. A 10mm single size aggregate was also tried with 4% foamed bitumen. It was clear that the foam could not coat the single size coarse ag-gregate; the resulting mixture was an uncombined asphalt in which the foamed bitumen appeared in several globules.
Figure 10. Appearance of wet loose materials; (left) before foaming, (right) after foaming
Figure 11. Appearance of dry loose materials
Storage period
Loose foamed mixtures (with no hydraulic binder) can be stored up to 3 months before compaction (Wirtgen, 2004). Khweir (2006) also reported that foam mix stiffness did not sig-nificantly decline even if stored up to 28 days. However, in this trial it was found that the best approach was to leave the mixture to cool prior to being sealed in plastic bags. Sealing foamed mix-ture while still in a warm condition caused condensation. The use of the plastic bag is to avoid excessive evaporation occurring. Therefore the mixtures were placed inside closed tins and stored
in a cool room (temperature 5oC). The storage of foamed
materi-als will not change the mixture structure as long as there is no significant inter-particle pressure or loss of moisture.
Compaction
The foam mixtures were compacted using a gyratory com-pactor to achieve the maximum dry density. Specimens were fa-bricated at a diameter of 100mm and a height of 50mm. In this trial, the gyratory compactor was selected for preparing speci-mens since it was believed that this would yield material struc-tures approaching those set up during the construction of actual pavements. This method is also practical and enables a particular specimen density to be achieved in laboratory. In this case, the machine can be set to compact specimens to obtain 100% of maximum dry density (MDD). In this trial, the specimens were compacted using a ram pressure of 600 kPa and a compaction angle of 1.25 degrees, in line with the Superpave protocol. Jenkins et. al. (2002) used a gyratory compactor to prepare foa-med asphalt specimens and found that a pressure of 600 kPa at an
angle of 1.25 degrees for 150 gyrations approach the 100% MDD modified AASHTO condition.
Compacted specimens
Figure 12 shows two different foamed asphalt materials, mixed using the spiral dough hook agitator and flat agitator res-pectively, and both are compared to hot mix asphalt specimens. All materials have equivalent aggregate grading and binder con-tent. Clearly, both the foamed asphalt materials are lighter in co-lour than the corresponding hot mix specimens due to different coating profiles. The large stones in the foamed asphalt speci-mens can also be seen to be obviously uncoated. Differences bet-ween the foamed asphalt specimens mixed using different agita-tors were also clearly evident. Foam dispersal in flat agitator mix-ed specimens is far better than in dough hook mixmix-ed specimens. Bitumen in the latter specimens is not uniformly distributed and the appearance is spotty.
Figure 12. Appearance of compacted specimens; (left) foamed asphalt mixed using spiral dough hook agitator, (middle) foamed
asphalt mixed using flat agitator and (right) hot mix asphalt.
Figure 13. Appearance of foamed asphalt mixture under X-Ray scanning
X – Ray scanning
Figure 13 and 14 show the X- Ray scanning results of a foamed asphalt and hot mix asphalt respectively. Scanning has been performed on specimens with a diameter of 100mm and height of 65mm. The pictures shown are a middle slice scan through the specimens. Both specimens were compacted using a Gyratory compactor to approximately the same bulk density. However their void contents were slightly different due to their rice density also being slightly different.
large particles. This is not the case in the foamed asphalt speci-men. The void does not appear clearly due to continuous filling by binder-fines mastic. This is probably a function of the uniform distribution of water (including binder droplets) in the mixture during compaction; hence when water evaporates the mastic re-mains well distributed.
Figure 14. Appearance of hot mix asphalt under X-Ray scanning
CLOSURE
Following the work described above, it can be deduced as follows::
1. The pressure at 6 and 5 bars for water and air pressure
res-pectively was found to produce the best results in the foamed bitumen production using a laboratory foaming plant type Wirtgen WLB 10.
2. Using laboratory foaming plant type Wirtgen WLB 10, the
rate of bitumen spraying and foaming water content (FWC) can be controlled by a discharge timer and a water flow meter respectively.
3. In the process of foamed bitumen generating, soon after
spraying into a special container, the bitumen foam expands rapidly to its maximum volume followed by a rapid collapse process and a slow, asymptotic return to its original bitumen volume. It is observed that some steam escaped during the foaming process and some water still remained in the foam.
4. Foaming water content and binder type influence the
maxi-mum expansion ratio (ERm) and half-life (HL) values, whe-reas bitumen temperature is also supposed to affect those two values.
Foams with high ERm generally have low HL. At foaming water content (FWC) of 1%, the ERm is lowest and the HL is longest for a given binder type and temperature. However, at
high ERm (FWC ≥ 4%), the HL does not tend to decrease.
In the mixing process using the Hobart mixer, it was sug-gested to use flat agitator and aggregates with a maximum size of 10mm to avoid degradation problems, and to do hand-mixing before and after spraying foam to avoid segregation.
The foam in the wet loose material preferred to distribute on the fine particles, and it seemed well distributed when the flat agitator was used. In the dry loose material, fine aggregate (< 6mm) seemed to be bonded to form a mastic, medium aggre-gate (6-10mm) appeared partially coated, whereas coarse ag-gregate (> 10mm) was totally uncoated.
Foamed materials can be stored before compaction. During storage period, the mixture structure of foamed materials will not change as long as there is no loss of moisture, and no sig-nificant inter-particle pressure.
Foam dispersal in flat agitator mixed specimens is far better than in dough hook mixed specimens, and both are lighter in colour than the corresponding hot mix specimens.
Based upon X-Ray scanning results, the void component of foamed asphalt specimens do not appear clearly as evident in the case of hot mix specimens due to continuous filling by binder-fines mastic.
ACKNOWLEDGEMENTS
The author is very grateful for the assistance and advice of Dr. N.H. Thom, Dr. S.E. Zoorob, Christopher Fox, Jonathan Watson, Michael Winfield, Neil Parkes, and for many helpful discussions with Dr. Jitareekul and Dr. M.H. Sutanto. This work was carried out with the financial support of TPSDP program SPMU-UMS unit Civil Engineering.
REFFERENCES
Akeroyd, F.M.L. and Hicks, B.J. (1988). “Foamed Bitumen Road
Re-cycling.” Journ.of Highways, Volume 56, Number 1933,
pp 42, 43, 45.
Brennen, M., Tia, M., Altschaeffl, A.G. and Wood, L.E. (1983). “Laboratory Investigation of The Use of Foamed Asphalt for Recycled Bituminous Pavements, In: Asphalt materials,
mix-tures, construction, moisture effects and sulfur.”
Transporta-tion Research Record: 911, pp 80-87, Washington, DC. Jenkins, K.J., de Ven, M.F.C. and de Groot, J.L.A. (1999).
“Cha-terisation of Foamed Bitumen.” 7th Conference on Asphalt
Pavements for Southern Africa (CAPSA).
Jenkins, K.J., Molenaar, AAA, de Groot, JLA, van de Ven, MFC. (2002). “Foamed Asphalt Produced Using Warmed
Aggrega-tes.” The Association of Asphalt Paving Technologists.
Jitareekul, P., Sunarjono, S., Zoorob, S.E., Thom, N.H. (2007). “Early life performance of cement and foamed bitumen stabi-lised reclaimed asphalt pavement under simulated
traffick-ing.” The Int. Conf. on Sustainable Construction Materials
and Technologies, 11-13 June 2007, Coventry UK.
Khweir, K. (2006). “Effect of Shelf Life Time on The
Perfor-mance of Foamed Bitumen Bound Mixtures.” International
Society for Asphalt Pavement (ISAP), August 2006, Quebec, Canada.
Long, F.M., Theyse, H.L. and Ventura, D.F.C. (2004). “Charac-terisation of Foamed Bitumen Treated Material from HVS
Test Sectio.” CSIR Transportek, PO Box 395, Pretoria, 0001,
South Africa.
Muthen,K.M. (1999). “Foamed Asphalt Mixes, Mix Design
Pro-cedure.” Contract Rep., CR-98/077, June 1999, CSIR
Trans-portek, South Africa.
Nunn, M.E. and Thom, N.H. (2002). “Foamix: Pilot Scale Trials
and Design Considerations.” Viridis Report VR1, First
Pu-blished ISSN 1478-0143, Copyright TRL Limited 2002. Sunarjono, S. (2006). “A Study on Fatigue Performance of
Re-claimed Asphalt Pavement Stabilised with Foamed
Bitu-men.” Pros.,Seminar Nasional Teknik Sipil, Universitas
Mu-hammadiyah Malang, December 2006.
Sunarjono, S. (2007). “Tensile Strength And Stiffness Modulus of Foamed Asphalt Applied To A Grading Representative Of
Indonesian Road Recycled Pavement Materials.” Jurnal
Di-namika Teknik Sipil, Vol. 7, No. 1, Januari 2007, ISSN 1411-8904.
Sunarjono, S., Zoorob, S.E. and Thom, N.H. (2007). “Influence of Foaming Water on The Foaming Process and Resultant
Asphalt Mix Stiffness.” 4th International SIIV Congress
Sunarjono, S. (2009). “Investigating Rutting Performance of Foamed Cold-Mix Asphalt Under Simulated Trafficking.”
Jurnal Dinamika Teknik Sipil, Vol 9, No. 2, Juli 2009, ISSN: 1411-8904.
Sunarjono, S., (2010). “Laboratory Stiffness Characterization of Foamed Cold-Mix Asphalt Using Indirect Tensile Stiffness
Modulus Test.” Jurnal Dinamika Teknik Sipil, Vol 10, No. 1,
Januari 2010, ISSN: 1411-8904.
Widyatmoko, I. and Sunarjono, S. (2007). “Some considerations to implement foamed bitumen technology for road
construc-tion in Indonesia.” The 1st Intern.Conference of European
Asian Civil Engrg. Forum (EACEF) at Universitas Pelita Harapan, 26 - 27 September 2007.
Wirtgen, (2004).Cold Recycling Manual. 2nd edition. ISBN
3-936215-05-7, Wirtgen GmbH, Hohner Strasse 2.53578 Win-dhagen, Germany.
Wirtgen, (2005). Foamed Bitumen Mix Design Procedure Using