DOI: 10.12928/TELKOMNIKA.v12i1.1816 115
New Modelling of Modified Two Dimensional Fisherface
Based Feature Extraction
Arif Muntasa
Informatics Engineering Department, Enginering Faculty, University of Trunojoyo, Ry Telang Po. Box 2 Kamal, Bangkalan
Corresponding author, email: [email protected]
Abstract
Biometric researches have been interesting field for many researches included facial recognition. Crucial process of facial recognition is feature extraction. One Dimensional Linear Discriminant Analysis is one of feature extraction method is development of Principal Component Analysis mostly used by researches. But, it has limitation, it can efficiently work when number of training sets greater or equal than number of dimensions of image training set. This limitation has been overcome by using Two Dimensional Linear Discriminant Analysis. However, search value of matrix identity R and L by using Two Dimensional Linear Discriminant Analysis takes high cost, which is O(n3). In this research, the seeking of “Scatter between Class” and “Scatter within Class” by using Discriminant Analysis without having to find the value of R and L advance are proposed. Time complexity of proposed method is O(n2). Proposed method has been tested by using AT&T face image database. The experimental results show that maximum recognition rate of proposed method is 100%.
Kata kunci: Biometric, Face Recognition, Principal Component Analysis, Two Dimensional Fisherface
1. Introduction
The biometrics survey results show that facial recognition has big prospect to be developed in advanced. Facial recognition technology has also applied in many sectors, such as banking, government, military and even industrial [1]. Low level feature extraction such as appearance method is the most popular method to extract feature in facial recognition, which is Principal Component Analysis (PCA) [2], [3]. It is simple method to extract facial features by dimensional reduction. This method has been cited by many researches. However, it has limitations. The first, dimensional reduction could not be conducted, when the number of training sets more or equal than image dimension. The last, separation classes could not be efficiently conducted.
Some appearance methods have been proposed to overcome it, which are Linear Discriminant Analysis (LDA) [4], [5], [6], Linear Preserving Projection (LPP) well known as Laplacianfaces [7], and Orthogonal Neighborhood Preserving Projection (ONPP) [8]. These methods have been overcome the last problem of PCA. However, the first problem could not be overcome when number of training set samples more than image dimensionality.
In order to overcome the last problem of PCA, two dimensionality appearance methods has been proposed, such as Two Dimensional - Principal Component Analysis (2D-PCA) [9],[10] and Two Dimensional – Linear Discriminant Analysis (2D-LDA) [11], [12], [13], [14]. Feature extraction without transformation employ on image samples was first proposed by J. Yang [10]. Besides 2D-LDA, further development of 2D-PCA was also proposed by J. Ye, this is Generalized Low Rank Approximations of Matrices (GLRAM) [15]. 2D-LDA was iteratively implemented to find the right (R) and the left (L) sides of the matrix to achieve the optimal matrix projection. Unfortunately, it needs high cost to obtain the L and R values as feature extraction. In this research, modification of 2D-LDA is proposed to obtain the optimal matrix projection, without finding the value of L and R.
2. One Dimensioanl Appearance Method
transformed from two dimensional into one dimensional. An image f(x,y) can be expressed in the matrix form as seen
)
,
(
)
2
,
(
)
1
,
(
)
,
2
(
)
2
,
2
(
)
1
,
2
(
)
,
1
(
)
2
,
1
(
)
1
,
1
(
w
h
f
h
f
h
f
w
f
f
f
w
f
f
f
f
(1)In this case, image weight and height are represented by using h and w. The result of transformation is one dimensional matrix form, which has size (1,n) or (n,1). The symbol of n represents the result of multiplication between h and w (n=h*w). If number of face images used as training sets is k, then training sets matrix can be written by using
)
,
(
)
2
,
(
)
1
,
(
)
,
2
(
)
2
,
2
(
)
1
,
2
(
)
,
1
(
)
2
,
1
(
)
1
,
1
(
,n
k
f
k
f
k
f
n
f
f
f
n
f
f
f
f
kn
(2)PCA method has been developed by many researchers such as Linear Discriminant Analysis (LDA) is well known as Fisherface. The feature of Fisherface can be obtained by using maximized of scatter between class (Sb) and minimized scatter within class (Sw) as seen on
eqauation
c i i T ib
c
c
N
S
1
1
(3)
ci X c
i j T i j w i j
c
X
c
X
N
S
1*
1
(4)
The results of Equation (3) and (4) can be utilized to compute the Eigen value and vector as seen follows
w
w
S
S
w
w
J
w
S
S
W B W B
11
(
)
(5)
Eigen value achieved by Equation (5) must be ordered decreasingly (122 …k) and followed by Eigen vector (). The dimension of Eigen vector () is fea, where fea is defined as k-c.
However, LDA has crucial problem, it will fail to maximized scatter between class and minimized scatter within class when the discriminatory information is not in the mean of the training sets but rather in the variance of the training sets. If this condition has occurred, than LDA could not efficiently work.
3. Two Dimensional Appearance Method
number of training sets is M, and for each class i-th has Mi training sets. The i-th image training
is represented by using Ai and mean i-th image of training sets are
i
A
, whereasA
represents mean image of all training sets. 2D-LDA can be calculated:
c i T i i T i i RW
A
A
R
R
A
A
S
1*
*
*
(6)
ci A c
T i T i i R B i i
A
A
R
R
A
A
M
S
1)
(
*
*
*
)
(
*
(7)The initialization value of R can be defined as identity matrix that has k dimension, where k represents number of eigenfaces used. The results of Equations (20) and (21) can be used to compute the covariance as seen
R W R B R
S
S
C
(8)The result of Equation (8) can be utilized to calculate the eigenvector. These eigenvectors are used as initialization value of L
R m R
R R
L
1,
2,
3,
,
To compute the value of CL
, it is necessary to calculated first the value
of
S
WL andS
BL
c i T i i T i i LW
A
A
L
L
A
A
S
1*
*
*
(9)
ci A c
T i T i i L B i i
A
A
L
L
A
A
M
S
1)
(
*
*
*
)
(
*
(10)And the value of CL can be computed by using
L W L B L
S
S
C
(11)The value of R can be updated by using the eigenvector of Equation (11)
L m L
L L
R
1,
2,
3,
,
(12)The values of L and R are used to achieve the projection matrix. However this method has limitation, which is the value of L and R depend on the number of iterations. Time complexity to achieve feature extraction (L and R) is O(n3).
4. Proposed Method
T T D B D B T D W D W T D B D B T D W D WS
S
S
S
S
S
S
S
C
2 2 2 2 2 2 2 2*
*
*
*
*
(13)In this proposed method, the zero mean of training sets has been modified by
multiplication
S
W2Dwith its transpose and followed by multiplicationS
B2Dwith its transpose as seen on equation
T D B D B T D W D WS
S
S
S
z
2 2 2 2*
*
(14)In this case, the value of
S
W2D andS
B2D can be calculated by using the following equation
c i T i i i i DW
A
A
A
A
S
1 2*
(15)
ci A c
T i i i D B i i
A
A
A
A
M
S
1 2)
(
*
)
(
(16) D WS
2 andS
B2Drepresent scatter within class and scatter between class of two dimensional matrix, They can be obtained from the training sets without transformation. Time complexity toobtain the values of
S
W2D andS
B2Dis O(n2). The results of Equation (13) are used to compute the eigenvector. The eigenvector is used as the optimal projection matrix, whereas the weight of training set can be achieved by using the following equation
D i
A
W
2*
(17)The eigenvector of Equation (13) is used to achieve the weight of the testing sets. The results of Equation (17) is measured the similarity of the weight between the training and testing sets. Feature extractions resulted of proposed method is two dimensional matrixes, the results of feature extraction of training sets has same size with original image. To achieve high recognition rate, it is necessary to chose dominant feature. The most dominant feature has correlation to the largest eigenvalue. If number of feature chosen is d, then number of vector element is d*h, where h represents image height.
To find out of the testing sets class, it is necessary to measure the weight between the training and the testing set. In this research, four methods were used to measure the similarity, which are Euclidian Distance (D1) and Manhattan (D2) as seen in the following equation
21 2 2 1
H j Test D Train D jW
W
D
(18)
h j Test D Train D jW
W
D
1 2 2 2 (19)5. Experimental Results and Analysis
In this research, 400 images have been used as data experiment, for both as the training and the testing sets. These images are made by AT&T - Cambridge University Computer Laboratory, it founded in 1986 as the Olivetti Research Laboratory, better known as ORL. Images are made from 40 people. For each people has been taken 10 times with different poses.
Figure 1. Samples of ORL Face Database
The proposed method has been proved with the facial image reconstruction from ORL face image database as seen in Figure 1.
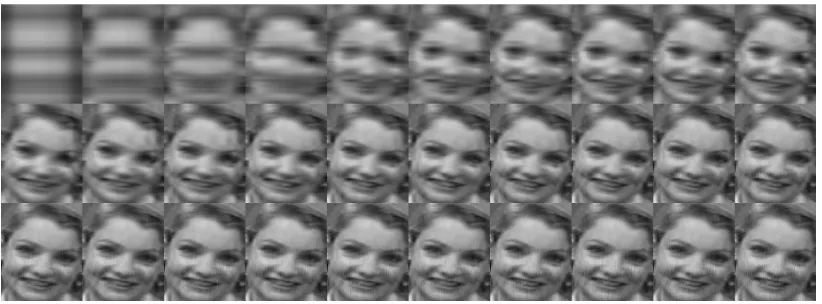
Figure 2. Face Image Reconstruction By Using Proposed Method
In this paper, 30 features have been used to reconstruct facial image. In Figure 2 on the first row image, from the left to the right describes facial image reconstruction using 1 until 10 features. Facial image reconstruction using 11 until 20 features is described in Figure 2 on the second row image from the left to the right. Similarly on the third row image, facial image reconstruction used 21 until 30 features.
Figure 3. Facial Image Reconstruction Error Rate of Proposed Method
[image:6.595.187.400.377.453.2]In order to evaluate robustness of proposed method, experiments were measured with 2 different similarity measurements, which are Euclidian Distance and Manhattan. For each similarity measurements utilized 2, 3, 4, 5, 6 and 7 training sets as seen in Table 1.
Table 1. Experimental Model for each Similarity Measurements Method
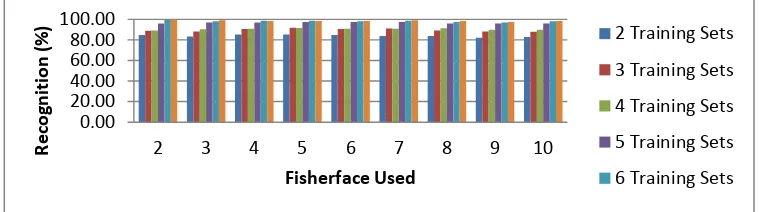
For each training sets, number of features used are 2, 3, 4, 5, 6, 7, 8, 9, and 10 features as dominant characteristics respectively. The first scenario, Euclidian distance method is used to measure the similarity of the feature extraction. The last scenario the results of feature extraction were measured the similarity by using Manhattan method. The experimental results show that the number of training sets influence recognition rate. Based on Figure 4, it can be shown that the minimum recognition rate for 2 features obtained 84.69%, whereas the maximum recognition rate for 2 features achieved 100%.
Figure 4. The First Scenario: Experimental Results of Proposed Method Using Euclidian Distance
0.00 20.00 40.00 60.00 80.00 100.00
2 3 4 5 6 7 8 9 10
Recognition
(%)
Fisherface Used
2 Training Sets
3 Training Sets
4 Training Sets
5 Training Sets
6 Training Sets
No Number of Training
Sets Used
Number of Testing Sets Used
1 2 8
2 3 7
3 4 6
4 5 5
5 6 4
[image:6.595.108.490.579.685.2]The number of training sets has influence to recognition rate achieved. The more training sets used, the more recognition rate achieved. Similarly, it can be also seen for all features, except experimental results using 4 features. The recognition rate for experimental using 6 training sets is higher than experimental using 7 training sets. The number of features used to measure similarity does not have influence significant to recognition rate. It can be seen in Figure 4. The same phenomena is also occurred, when the similarity measurements using Manhattan as seen in Figure 5. Deviation of the experimental results occurred, when experimental uses 4 and 5 training sets. The experimental results show that recognition rate of 6 training sets is higher than recognition rate of 7 training sets as seen in Figure 5. The mistake of recognition occurred, because of accessories usage on the testing set. The highest recognition rate occurred, when 2 features is used as parameter for similarity measurement.
Figure 5. The Second Scenario: Experimental Results of Proposed Method Using Manhattan
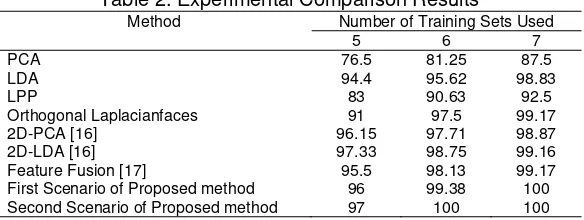
The experimental results of proposed method have been also compared to other methods, which are PCA, LDA, LPP, Orthogonal Laplacianfaces, Feature Fusion [17], 2D-PCA [16] and 2D-LDA [16]. The Comparison results show that, recognition rate for 5 training sets on the first scenario is 96%, it is superior to other methods expect to 2D-PCA and 2D-LDA. But recognition rate for the second scenario is superior to other method except to 2D-LDA. In this case, maximum recognition rate of our proposed method is 97%, whereas recognition rate of 2D-LDA is 97.33%. For 6 and 7 training set, proposed method is superior to other methods for both the first and the second scenario as seen in Table 2. Proposed method cannot select the best features for each column yet, so increasing features used has given bad effect to recognition results.
Table 2. Experimental Comparison Results
Method Number of Training Sets Used
5 6 7
PCA 76.5 81.25 87.5
LDA 94.4 95.62 98.83
LPP 83 90.63 92.5
Orthogonal Laplacianfaces 91 97.5 99.17
2D-PCA [16] 96.15 97.71 98.87
2D-LDA [16] 97.33 98.75 99.16
Feature Fusion [17] 95.5 98.13 99.17
First Scenario of Proposed method 96 99.38 100
Second Scenario of Proposed method 97 100 100
6. Conclusions and Future Research
Based on experimental results and analysis, the highest recognition rate occurred when two vector features used as parameter for similarity measurements, for both the first and the second scenarios. It shows that the more features used, the lower recognition rate achieved. Decreasing of recognition rate is caused of the usage non dominant features.
0.00 20.00 40.00 60.00 80.00 100.00
2 3 4 5 6 7 8 9 10
Recognition(%)
Fisherface Used
2 Training Sets
3 Training Sets
4 Training Sets
5 Training Sets
6 Training Sets
The more number of training sets used, the higher recognition rate achieved. The highest recognition rate is 100%. It occurred when experiment uses 7 training sets on the first scenario, and 6 and 7 training sets on the second scenario.
Proposed method will be developed to improve their limitations, when number of features used more than 2 features. It is necessary to select the dominant feature vectors for each column. It is conducted to increase the recognition rate and to decrease computation time for similarity measurement.
References
[1] W. Zhao, R. Chellappa, A. Rosenfeld, and P. Phillips. Face recognition: A literature survey. ACM Comput. Surv. 2003; 35(4): 399–458.
[2] M. Turk and A. Pentland. Eigenfaces for recognition. J. Cognitive Neuroscience. 1991; 3(1): 71-86. [3] A.M. Martinez and A.C. Kak. PCA versus LDA. IEEE Transactions on Pattern Analysis and Machine
Intelligence. 2001; 23(2): 228-233.
[4] P.N. Belhumeur, J. Hespanha and D.J. Kriegman. Eigenfaces vs. Fisherfaces: Recognition Using Class pecific Linear Projection. IEEE Transactions on Pattern Analysis and Machine Intelligence. 1997; 19(7): 711-720.
[5] H.C. Kim, D. Kim and S. Y. Bang. Face recognition using LDA mixture model. Pattern Recognition Letters. 2003; 24: 2815–2821.
[6] M. Loog and R.P.W. Duin. Linear Dimensionality Reduction via a Heteroscedastic Extension of LDA: The Chernoff Criterion. IEEE Transactions on Pattern Analysis and Machine Intelligence. 2004; 26(6): 732-739.
[7] X. He, S. Yan, Y. Hu, P. Niyogi, and H.-J. Zhang. Face Recognition Using Laplacianfaces. IEEE Transactions on Pattern Analysis and Machine Intelligence. 2005; 27(3): 328-340.
[8] E. Kokiopoulou and Y. Saad. Orthogonal Neighborhood Preserving Projections: A projectionbased dimensionality reduction technique. IEEE Transactions on Pattern Analysis and Machine Intelligence. 2007; 29(12): 2134–2156.
[9] J. Yang and J. Y. Yang. From image vector to matrix: A straightforward image projection technique— IMPCA vs. PCA. Pattern Recognition. 2002; 35(9): 1997–1999.
[10] J. Yang, Zhang D, Frangi AF, and Yang JY. Two-dimensional PCA: A New Approach to Appearance-based Face Representation and Recognition. IEEE Transactions on Pattern Analysis and Machine Intelligence. 2004; 26: 131-137.
[11] H. Kong, L. Wang and E. K. Teoh. A Framework of 2D Fisher Discriminant Analysis: Application to Face Recognition with Small Number of Training Samples. CVPR. 2005.
[12] M. Li and B. Yuan. 2D-LDA: A novel statistical linear discriminant analysis for image matrix. Pattern Recognition Letter. 2005; 26(5): 527–532.
[13] H. Xiong, M.N.S. Swamy and M.O. Ahmad. Two-dimensional FLD for face recognition. Pattern Recognition. 2005; 38: 1121 –1124.
[14] Liang Z, Li Y, and Shi P. A Note on Two-Dimensional Linear Discriminant Analysis. Pattern Recognition. 2008; 9: 2122-2128.
[15] J. Ye. Generalized Low Rank Approximations of Matrices. Machine Learning. 2005; 61: 167-191. [16] Hythem Ahmed, Mohamed Jedra and Nouredine Zahid. Kernel Weighted Scatter-Difference-Based
Two Dimensional Discriminant Analyses for Face Recognition. International Journal of Signal Processing, Image Processing and Pattern Recognition. 2012; 5(3).