Available online at HABITAT website: http://www.habitat.ub.ac.id
Value Chain Analysis of Prol Tape Cassava in Agroindustry in Jember
Fennela Firman Sari1*, Ratya Anindita2, Djoko Koestiono2 1
Master of Agricultural Economics, Faculty of Agriculture, University of Brawijaya 2
Department of Social Economics, Faculty of Agriculture, University of Brawijaya, Jl. Veteran Malang 65145, Jawa Timur, Indonesia
Received: 8 February 2017; Revised: 20 March 2017; Accepted: 29 March 2017
ABSTRACT
The purpose of the study was to analyze the mapping of prol tape value chain and the critical succes factor (CSF) to define effective strategyto improve the prol tape. The sampling methods were census and snowball sampling. The data analysis methods were mapping analysis, CSF, and benchmarking. The findings showed that the agroindustrial actors spent the highest amount of money in one production process, 2,278,999.75 rupiahs, and as the consequence got the least amount of profit, 862,292.25 rupiahs. According to the agroindustry, the most criticalfactors were taste, quality, and price, while those according to the consumers were taste, quality, and expired. The factor that had highest gap score was expired (0.97) followed by innovation (0.6) and supply (0.53). Therefore, the methods of upgrading to do were process upgrading (minimizing defects in raw materials), product upgrading (improving flavors, product diversification, mentioning expiration date and increasing supply), functional upgrading (increasing machine capacity for production) and chain upgrading (shifting the chain and not involving retailers, increasing the number of stores (outlets) in strategic locations, and buying raw materials directly from tape sellers).
Keywords: agroindustry; value chain; CSF How to cite: (Sari, Anindita, & Koestiono, 2017)
Sari, F. F., Anindita, R., & Koestiono, D. (2017). Value Chain Analysis of Prol Tape Cassava in Agroindustry in Jember. HABITAT, 28(1), 7–13. https://doi.org/10.21776/ub.habitat.2017.028.1.2
1. Introduction
Value chain is a series of activities taking place during production starting from conceptual design to marketing in which each of the activities increase value of the final products (Australian Centre for International Agricultural Research, 2012).
To sell their product, prol tape agroindustry involve several actors that form a chain. The actors are tape supplier, agroindustry, and retailers. Each of them conducts certain activities that increase value of the finished products.
There are some activities along the prol tape value chain that have zero contribution to increasing the value of the cake, for instance (1) defection of raw materials that affect flavors and quality of the product, (2) expired products sold by retailers, (3) shortage of raw materials especially during the rainy season, lack of capital that affects product supply and inconvenient store
location that affects the number of consumers. These issues may influence cost of production and profit. As the consequence, one should develop certain strategies using consumer-based (critical success factor) method to describe the competitive advantage of the prol tape so that the product excels the business competition. Based on the background, the objective of the study is to analyze the mapping of the prol tape value chain and the critical succes factor (CSF) to determine appropriate strategies for product development.
2. Methodology
The sampling technique was census where all of the populations were involved as the sample. The samples of the study were 3 (three) small-scale agroindustries and 1 (one) middle-scale agroindustry; their owners became the respondents. Snowball sampling was used in order to determine the respondents involved in the prol tape value chain. It began with the agroindustrial actors, 4 (four) tape suppliers and 13 (thirteen) retailers. In order to determine the consumers for the CSF analysis, the researchers ---
*)
Corresponding Author
Available online at HABITAT website: http://www.habitat.ub.ac.id decided to refer to the minimum number of
samples or 30 respondents (Roscoe, 1975). The data analysis methods were mapping, critical success factor (CSF) and benchmarking (Kaplinsky and Morris, 2000). The following section discussed the three methods in a more detail manner.
2.1. Mapping
Mapping referred to identifying actors and their activities within the prol tape value chain, distribution line of the product, gross output value, level of productivity using wastage analysis, and distribution of profit each of the actors had using margin and profit analysis (Adeoye et al, 2013). The following formula was used for mapping.
Wastage volume = wastage volumetotal volume x 100%... (1)
Π = TR – TC... (2) Description:
Π = Profit (Rp)
TR = Total Revenue (Rp) TC = Total Cost (Rp)
MP = Pr – Pf... (3) Description:
MP = Marketing margin (Rp/kg) Pr = Pricing for consumer (Rp/kg)
Pf =Pricing for producers (Rp/kg)(Anindita, 2004).
2.2. Critical Success Factor (CSF)
Critical success factor is the most influential factor that determines how successful agroindstrial product in the market is (Jogiyanto, 2005). Resource and capability were the sources of competitive advantage for companies to survive the business competition (Hit et al, 2001).The objective of the CSF analysis was to identify critical factors consumers consider before purchasing the prol tape.
Prior to analysis, the data obtained from the questionnaire underwent validity and reliability testing (Sugiyono, 2011). The following step was to design spiderweb chart to compare agroindustrial and consumer perceptions on which factors to consider prior to purchasing the prol tape.
2.3. Designing Strategy
The steps to determine effective strategy for developing the prol tape were:
a. Benchmarking or making comparison between the activities of the agroindustry and those of more successful competitors, b. Governanceor involving the government in
the product development,
c. Upgrading, using mapping, critical success factor and benchmarking for product development; these include: (Kaplinsky et al, 2002)
1) Process upgrading. 2) Product upgrading. 3) Functional upgrading. 4) Chain upgrading.
3. Results and Discussions 3.1. Mapping
3.1.1. Identifying Value Chain Actors and Activities
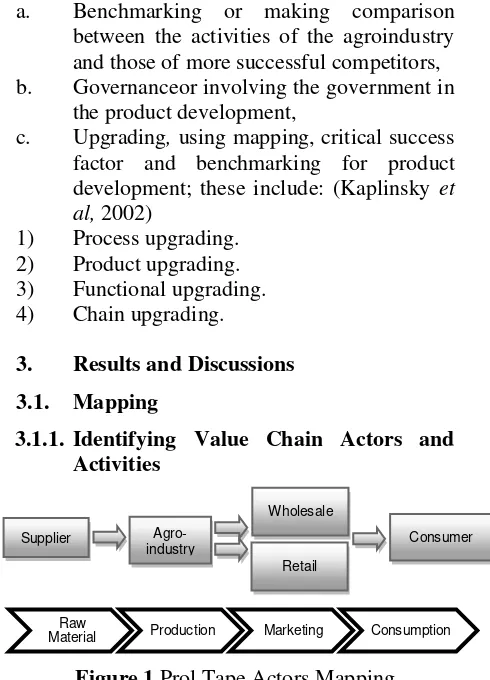
Figure 1.Prol Tape Actors Mapping Figure 1. described that the value chain of prol tape consisted of supplier, agroindustry, wholesale, retailer and consumers. Each of them carried out specific activities of which purpose were to increase value of the products. The activities were as follows:
a. Supplier
Supplier provided tape for the agroindustry. They came from Jember and Bondowoso. The supplier sent the tape regularly but there had yet been any contract between the suppliers and the agroindustry.
b. Agroindustry
UD Purnama Jati, UD Anis, and UD Super Madu were the small-scale agroindustry being involved in the prol tape value chain in Jember while UD Primadona was the middle-scale agroindustry participated in the benchmarking. The agroindustry changed the tape into cake and distributed it to the wholesale.
c. Retailer
The agroindustry distributed the product to 13 suppliers. They were categorized into small and large retailers. The system for the small-scale agroindustry was consignment where retailers got
Raw
Material Production Marketing Consumption Retail
Supplier Agro-industry
Wholesale
Available online at HABITAT website: http://www.habitat.ub.ac.id certain percentage of share from the products
they sold.
d. Consumers
30 consumers participated in the study. Targeted consumers were those whose income was higher than 1.5 million rupiahs. The researcher selected people who had tried the product in order to get accurate data on the critical factors that determine success of the prol tape agroindustry.
3.1.2. Identifying Distribution Line
Figure 2.Prol Tape Distribution Line The purpose of identifying the distribution line was to find out the number of the product (prol tape) that went through each part of the value chain. Based on Figure 2, 78.1% of the prol tape was distributed to the large retailers while the remaining 21.8% was distributed to the small retailers. The scale of business dictated the sales. The retailers then sold the product directly to the consumers.
3.1.3. Gross Output Value
The gross output value referred to the number of prol tape the agroindustry produced in one process of production. The total gross output value was the number of products distributed to the small and large retailers as well as the products sold in the outlet.
The total number of prol tapes distributed to the small retailers were 92 and 42 cakes were sold in the outlet. Therefore, the total gross output value was 134 cakes/ production/ day. 3.1.4. Level of Productivity
Level of productivity may be measured sorting referred to getting rid of any defect in the raw materials such as unripe tape or one containing too much water. Higher wastage volume caused lower profit.
3.1.5. Profit Distribution
Profit distribution each of the actors obtained should be identified to find out increase in value each of them did. Based on Table 2., the agroindustry had the least amount of profit in one cycle of production, which was 862,292.25 rupiahs, since it spent significant amount of money for various activities it carried out, which was 2,278,999.75 rupiahs/piece. The agroindustry had the lowest profit ratio, 0.38; it meant 1 rupiah increase in production cost would increase the profit by 0.38 rupiahs. The retailers had the highest amount of profit, 9.66; it meant 1 rupiah increase ijn production cost would increase the profit by 9.66 rupiahs.The retailers had the highest profit because they had the fewest activities to do and as the result, they spent the least amount of cost.
The margin for the suppliers was 1,500,000 rupiahs, that for the agroindustrywas 19,833,000 rupiahs and that for the suppliers was 3,436,230. Thus the total margin was 24,769,230 rupiahs.The agroindustry had the highest margin because it changed the raw materials into finished the product. The process required large cost and as the result, the sale price was higher.
Having analyzed the margin, cost and profit of the prol tape value chain, it was concluded that more activities required higher cost. It happened because more value was added to the product and as the effect, the price of the product was higher. In addition, the more actors involved, the margin was larger and the profit was getting smaller.
Table 2. Profit Distribution of the Prol Tape Value Chain Actor Total
Available online at HABITAT website: http://www.habitat.ub.ac.id 3.2. Analisis Critical Success Factor (CSF)
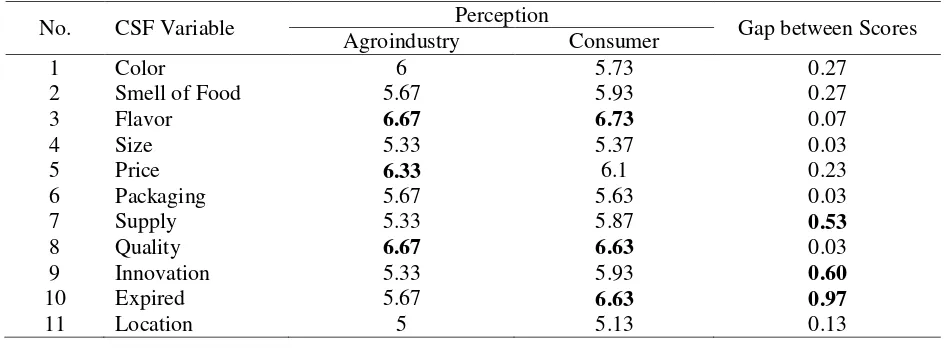
Critical Success Factor (CSF) analysis aimed at describing critical factors the agroindustry should take into account to meet consumer’s expectation or demand of the market in order to increase its competitive advantage. The variables of the study were color, smell, flavor, size, price, packaging, supply, quality innovation, expired, and location (Kaplinsky and Morris, 2000). Prior to the Critical Success Factor (CSF) analysis, the data obtained from the questionnaire underwent the validity and reliability testing.
Based on the validity and reliability testing, all of the CSF indicators (color, smell, flavor, size, price, packaging, supply, quality innovation, expired, and location) were valid and reliable because the Pearson correlation score was < 0.05 and Cronbach Alpha was 0.776 > 0.6.
3.2.1. Comparison between the Agroindustrial and Consumer Level of Importance a. Critical Factor for the Agroindustry
Based on Table 3., according to the agroindustry, the most important factors to take into account prior to purchasing the prol tape were flavor, quality and price. Flavor and quality had the highest score, 6.67, because the agroindustry wanted to produce perfect, hygienic, flavorful prol tape with long expired that attracted consumers. Price was another significant factor, 6.33, because it affected the consumer decision whether to purchase or not to purchase the product. Competitive price and one suitable to cost of production would affect competitive advantage of the prol tape. Location was the least factor the agroindustry taken into acount because it focused on distributing the products to the retailer instead of selling them directly to the consumers.
Table 3. Critical Success Factor (CSF) Score
No. CSF Variable Perception Gap between Scores
Agroindustry Consumer
1 Color 6 5.73 0.27
2 Smell of Food 5.67 5.93 0.27
3 Flavor 6.67 6.73 0.07
4 Size 5.33 5.37 0.03
5 Price 6.33 6.1 0.23
6 Packaging 5.67 5.63 0.03
7 Supply 5.33 5.87 0.53
8 Quality 6.67 6.63 0.03
9 Innovation 5.33 5.93 0.60
10 Expired 5.67 6.63 0.97
11 Location 5 5.13 0.13
b. Critical Factor for the Consumers
The most critical factors for the consumers were flavor, quality and expired. Flavor was the one with the highest score (6.73) due to its significant influence towards consumer satisfaction. The consumers expected sweet, savory and soft prol tape. Quality was another vital factor to consider before purchasing the product because the consumer expected fresh, qualified product with long expired and without any preservative. Expired was another factor to consider because the consumers wanted safe products. Location had the lowest score (5.13) because it was difficult to access the agroindustry due to its location. The agroindustry was not located at the city center. Figure 3 described the gap in the perception of the agroindustry and the consumers.
Figure 3.Spiderweb Chart of the AgroindustryandConsumers
0 1 2 3 4 5 6 7Color
Smell
Flavor
Size
Price Packaging Supply
Quality Innovation
Expired Location
Available online at HABITAT website: http://www.habitat.ub.ac.id Based on Figure 3., the agroindustry had
met most of the factors the consumers took into account before purchasing the prol tape. However, it had yet been able to met several factors and as the consequence, there was significant gap between the perception of the agroindustry and that of the consumers, for example expired, innovation and supply.
Expired has the highest gap because the agroindustry had yet taken it into account and as the result, did not mention expiration date of the product on the packaging. The consumers found the information essential because it indicated the quality of the product.
Innovation was another vital factor with high gap because the consumers expected constant innovation in terms of flavor, size, shape and type. At the same time, the agroindustry was not ready to make product innovation.
Supply also had high gap because there was frequent shortage of supply in which the consumers could not find the product when they went to the retailers. Short of raw materials especially during the rainy season contributed to the condition. It resulted in delay in production and longer distribution time from the agroindustry to the retailers.
3.3. Effective Strategy for Value Chain Development
3.3.1. Benchmarking Analysis
Pawitra (1994) stated that benchmarking analysis was systematic and continuous learning process where each part of a company was compared to the most successful company. In the study, the objective of benchmarking analysis was to make comparison between the performance of the small-scale agroindustry and the middle-scale agroindustry that became its competitor. The indicator for their performance was issues the prol tape agroindustry encountered to meet the critical factors that affected consumer’s decision before purchasing the cake. Table 4. described that there were 11 indicators to improve namely flavor, price, packaging, supply, quality, innovation, expired, location, input of raw materials, wastage and gross output value. The small-scale agroindustry offered lower price than the middle-scale agroindustry which became their competitive advantage. However, in order to reduce the price, the small-scale industry also used raw materials with lower quality which affected the wastage and quality of the finished product. It increased cost of production and influenced the profit.
Table 4. described the result of benchmarking analysis of the small and middle-scale agroindustry. Upgrading was conducted by considering all of the issues. There were four types of upgrade, namely process, product, functional, and chain upgrading.
Table4. Benchmarking of the Small and Middle-Scale Agroindustry
No. Indicator Small-scale Agroindustry Middle-scale Agroindustry
1. Flavor Dominated by flour Dominated by tape
2. Price 25,333 rupiah/piece 32,000/piece
3. Packaging Thiner, unattractive design Thicker, more attractive design
4. Supply Short of supply Available constantly
5. Quality Not fresh-from-the oven Fresh-from-the oven
6. Innovation
Fewer range of flavours (chocolate, cheese,
cheese-raisin)
More range of flavors (cheese-raisin, walnut, chocolate,
chocolate-cheese)
7. Expired Was not mentioned on the
package Mentioned on the package
8. Location Not convenient Convenient
9. Input of Raw Material 53.33 kg/production 100 kg/production
10. Wastage 7.5 % 6 %
11. Gross output 133pieces 200pieces
3.3.2. Governance
Governance referred to the authorities. They should encourage the agroindustry so that it was able to improve the value chain. The
Available online at HABITAT website: http://www.habitat.ub.ac.id a. Department of Industry and National Trade
1) Conducting training on public administration that involves planning, production, management or other financial issues,
2) Providing some facilities such as equipment or machinery to MSMEs, 3) Conducting technical management training
for the agroindustry,
4) Conducting field observation, guidance and workshop about the use of technology for the industry,
5) Helping the MSMEs, retailers or suppliers running their business and expanding their market.
b. Financial Institution
Capital is one of the most frequent issues the actors encountered. They went to financial institution such as bank to get some loan. Recently, banks offered various types of loan for MSMEs including agroindustry.
c. University
University may contribute in the upgrading process by providing more effective machinery with higher capacity to decrease production cost. It may also conduct training, workshop or upgrading based on the research they had conducted. The middle-scale industry had worked together with several universities and got new mixer with higher capacity to increase production and minimize cost of production.
The small-scale agroindustry had yet had value chain.The indicators of the Critical Success Factor (CSF) and benchmarking became the bases for the process. It may be divided into process, product, functional and chain upgrading. a. Process Upgrading
It referred to increasing internal process efficiency to excel the business competition. The methods were:
1) Minimizing defected raw materials (wastage) by constantly checking quality of tape prior to purchasing,
2) Using larger oven to cut down fuel price, 3) Using larger mixer to cut down electricity
bill,
4) Conducting constant maintenance to reduce wastage.
b. Product Upgrading
It referred to creating new products or improving the available products to excel the business competition. The methods were:
1) Increasing flavor such as durian, cheese durian and mango,
2) Increasing product diversification such as tape brownies, piamade from tape, and tape sweets (dodol and jenang). The agroindustry had produced some of the products,
3) Mentioning expiration date on the package to increase consumer satisfaction,
4) Increasing supply of the product to avoid shortage of supply,
5) Determining price based on the production cost,
6) Adding more tape in the product, 7) Providing fresh-from-the oven product, 8) Improving design of the package to attract
more consumer. c. Functional Upgrading
It referred to changing activities during production or ones carried out by the actors.The methods were:
1) Increasing mixer capacity from 35 kg/hour to 40 kg/hour in order to increase
1) Excluding retailers. When more actors participated in the value chain, the margin increased but the profit decreased,
2) Increasing the number of stores (outlets) in strategic locations,
3) Buying the raw material (tape) straight from the producer to reduce some cost.
4. Conclusion
Available online at HABITAT website: http://www.habitat.ub.ac.id The most critical factors for the
agroindustry are flavor, quality and price while those for the consumers wereflavor, quality, and expired. The factors with the highest gap are expired (0.97), innovation (0.6) and supply (0.53).
The methods of upgrading to do are process upgrading (minimizing defects in raw materials), product upgrading (improving innovative flavors, product diversification, mentioning expiration date and increasing supply, mentioning ingredients on the packaging, providing fresh-from-the oven product and improving the packaging design), functional upgrading (increasing the machine capacity) and chain upgrading (shifting the chain and not involving retailers, increasing the number of stores (outlets) in strategic locations, and buying raw materials directly from tape producers).
References
Adeoye, Iyabo B. et al. 2013. Plantation Value Chain Mapping in Southwestern Nigeria. Journal of Economics and Sustainable Development Vol.4, No.16.
Anindita, Ratya. 2004. Pemasaran Hasil Pertanian.Surabaya: Papyrus.
Australian Centre for International Agricultural Research. 2012. Membuat RantaiNilai Lebih Berpihak Pada Kaum Miskin: Buku Pegangan Bagi Praktisi Analisis Rantai Nilai. Diterjemahkan oleh: Mia Hapsari Kusumawarandi. Tabros: Indonesia. Jogiyanto, HM. 2005. Sistem Teknologi
Informasi Pendekatan Terintegrasi: Konsep Dasar, Teknologi, Aplikasi, Pengembangan and Pengelolaan. Edisi II. Yogyakarta: Andi.
Kaplinsky, Raphael and Mike Morris. 2000. A Handbook For Value Chain Research. New York.
Kaplinsky, Raphael et al. 2002. Understanding Upgrading Using Value Chain Analysis. New York.
Pawitra, Teddy. 1994. Patok Duga (Benchmarking): Kiat Belajar Dari yang Terbaik. Manajemen and Usahawan Indonesia, Vol. XXIII. No. 1.
Roscoe, J.T. 1975. Fundamental Research Statistic for The Behavior Sciencess. 2nd edition. New York: Holt, Rinehart and Winston.