The Momentum Rate of Change in Control Volume
Silo Bunker to Coal Feeder on Power Plant
Operational for Performance Analysis of Coal
Distribution Prosess
M Denny Surindra
* *Department of Mechanical Engineering
Polytechnic of Semarang State, Semarang, Jawa Tengah, Indonesia [email protected]
Abstract —A comprehensive flow-ability study from coal silo bunker, chain grade transfer and until crushed coal is needed. For the coal silo bunker to ensure smooth flow of coal in all seasons with different moisture contentsand different percentage of fines. Maintaining a constant supply of coal in the silo bunkers to coal feeder has proven to be a challenge.Tanjung Jati B power plant has units 1 and 2, each unit has 6 coal silo bunker with a capacity of 500 tons, so a total of 12 coal silo bunker. In conclusion silo bunker and coal feeder operation is not based on a precise calculation but based on secure estimates fuel supply to operate the boiler only.
Key words – Control volume, silo bunker, coal feeder .
I. INTRODUCTION
Approximately 85% of the commercial energy used in the world come from the fossil fuels: coal, oil and natural gas. However, except for coal, the supply of these fuels at their present rate of use might not last much longer than the lifetimes of the people now living. The fuel most commonly used, oil, appears to be in the shortest supply worldwide, but continues to be that commodity on which we rely most heavily. Indeed, dependence on oil, especially for transportation, leaves many countries quite vulnerable to a major economic disaster in the event of an oil shortage or interruption in supply. Japan imports almost all of its oil (principally from the Middle East), while some countries whose economies are growing rapidly today (such as Korea, Thailand, Singapore) depend greatly on imported oil.
The U.S. Geological Survey estimates our coal resources at more than 3 trillion tons, with approximately 300 billion tons of this being recoverable economically with present technology. Total world recoverable reserves are estimated at 1080 billion tons, enough to last for 210 years at current rates of consumption. In industrial boilers, environmental restriction have hampered conversion to coal. It seem increased coal use is constrained by demand and not supply.
The coal is fed by conveyor into the top of the silo bunker, it then flows by gravity out the bottom to the coal feeder or to a conveyor to the coal feeder and then to the processing
equipment. Coal stored in silos before it is fed into the coal mills of a steam electric generation station.
The silo bunkers are filled by a tripper car system. The system consists of a large conveyor belt with two chutes for unloading near the top of the bunkers on a rail track. The tripper cars move along a rail car track dispensing the coal into each bunker. When the high level switch is touched, the material stops unloading and the tripper car moves to the next bunker for unloading. Coal passes through grates filtering out any last coal chunks. When the bunker fills, the rail car automatically moves to the next bunker and begins the process again.
Fig. 1 Coal Silo Bunker.
estimates properties such as the internal temperature and/or species distribution. These predictive capabilities are further extended by an interaction to fluid flow by heat, mass and momentum transfer and impact of particles on structures. These superior features as compared to traditional and pure continuum mechanic approaches are highlighted by predicted examples of relevant engineering applications.
Kuttalakkani et.al, 2013 In any coal fired power plant the desired level of automation could be achieved by this project. As, the coal is the vital fuel in any thermal power plant, the level of coal can be maintained in the silos (coal tank). As and when the level becomes lower than the predetermined level, it automatically activates the conveyor system which in turn draws the coal from the storage yard. When the level raises the upper predetermined level, the conveyor system stops.
Maintaining a constant supply of coal in the silo bunkers has proven to be a challenge. In the past, high level mechanical type switches were used for alarm control near the top of the bunkers. Many plants still have operators that make use of a rope and weight to measure the level in the fifty or sixty foot tall bunkers. Many times, the bunkers would run empty of coal, which would cause a disruption/delay in filling fuel of the burner and leading to electricity delays, Siemens, 2007.
The purpose of this research is a comprehensive flow-ability study from coal silo bunker, chain grade transfer and until crushed coal. For the coal silo bunker to ensure smooth flow of coal in all seasons with different moisture contentsand different percentage of fines. The silo bunkers are required to promote mass flow without choking and stop. In order to maintain the supply of coal to run smoothly, it must take into account many areas. Therefore, the author will reveal a small portion that is silo bunker area to coal feeder with chain conveyor inside.
II. RESEARCH METHOD
Research methods used by the authors is by direct observation in the field. From these observations the authors obtain data on the speed of the conveyor and the coal down to the conveyor speed. Moreover, I also had a discussion by asking the operator and supervisor in coal handling. During the discussion with field operators and supervisors, the authors found that the workers in the coal handling area never count coal conveyor speed and the speed of coal down. They just operate and meet the crusher and fuel for the boiler smoothly. it is very interesting to watch further. After getting the required data, the authors tried to make a mathematical model to make the equation so that can know the actual needs.
The developing a mathematical formulation of Newton’s
secon law suitable for application to a control volume. In this section our derivation will be restricted to an inertial control volume fixed in space relative to coordinate system xyz that is not acceleration relative to stationary reference frame XYZ. In
deriving the control volume formulation of Newton’s second
law, the procedure is analogous to the procedure followed in deriving the mathematical formulation for the conservation of mass applied to a control volume. We begin with the
mathematical formulation for a system and then use Equation (4) to go from the system to the control volume formulation.
Recall that Newton’s second law for a system moving relative
to an inertial coordinate system was given by Equation (1) as
system
dP
F
dt
(1)Where the linear momentum,
P
, of system given by
system
mass system V(system)
V
Vdm
V dv
(2)
And the result force,
F
, include all surface and body force acting on the systems B
F
F
F
(3)The system and control volume formulation are related by Equation 4 CV CS system
dN
V.dA
V.dA
dt
t
(4) Where systemmass(system)
dm
V(system)d
N
(5)
To derive the control volume formulation of Newton’s second
law, we set
N
P and
V
(6)From Equation 1, with this substitution, we obtain
CV CS
system
dP
V dV
V V.dA
dt
t
(7) From Equation 1
on system systemdP
F
dt
(8) Since in deriving Equation 4, the system and the control volume coincided at t0, thenon system on control volume
F
F
(9)
In light of this, Equation 1 and Equation 7 may be combined
to yield the control volume formulation of Newton’s second
law for a non-accelerating control volume
s B
CV CS
F
F
F
V d
V V.dA
equal to the sum of the rate of change of momentum inside the control volume and the net rate of flux of momentum out through the control surface.
The derivation of the momentum equation for a control volume was straight forward. Application of this basic equation to the solution of problem will not be difficult if you exercise care in using the equation.
In using any basic equation for a control volume analysis, the first step must be to draw the boundaries of the control volume and label appropriate coordinate direction. In
Equation 10, the force
F
, represents all force acting on the control volume. It includes both surface force and body forces. If we denote the body force per unit mass as β, thenB CV
F
B dm
B d
(11) (11)
When the force of gravity is the only body force, then the
body force per unit mass is
g
. The surface force due to pressure is given bys A
F
dA
(12) (12)
The nature of the force acting on the control volume undoubtedly will influence the choice of the control volume boundaries.
All velocities,
V
in Equation 10 are measured relative to thecontrol volume. The momentum flux,
V V.dA
, through an element of the control surface area,dA
, is vector. The signof the component of the velocity,
V
, depend on the coordinate system chosen.The momentum equation is a vector equation. As with all vector equation, it may be written as three scalar component equations. Relative to an xyz coordinate system, the scalar component of Equation 10 are
x Sx Bx CV CS
F
F
F
u d
u V.dA
t
(13) (13a)
y Sy By CV CS
F
F
F
u d
u V.dA
t
(14)
z Sz Bz CV CS
F
F
F
u d
u V.dA
t
(15)
To use the scalar equation, it again is necessary to select a coordinate system at the outset. The positive directions of the velocity components, u, v, and w, and the force components, Fx, Fy, Fz, are then established relative to the selected coordinate system. As we have previously pointed out, the
sign of the scalar product,
V.dA
, depends on the direction of the velocity vector,V
, relative to the area vector,dA
. Thus the flux term in either Equation 10 or Equation 13 is a product of two quantities, both of which have algebraic signs.We suggest that you proceed in two steps to determine the momentum flux through any portion of a control surface:
1. The first step is to determine the sign of
V.dA
V.dA
VdA cos
VdA cos
(16) 2. The second step is to determine the sign for each velocity component, u, v and w. The sign, which depends on the choice of coordinate system, should be accounted for when substituting numerical values into the term
u V.dA
u
VdA cos
and soon.III.RESULT AND DISCUSSION
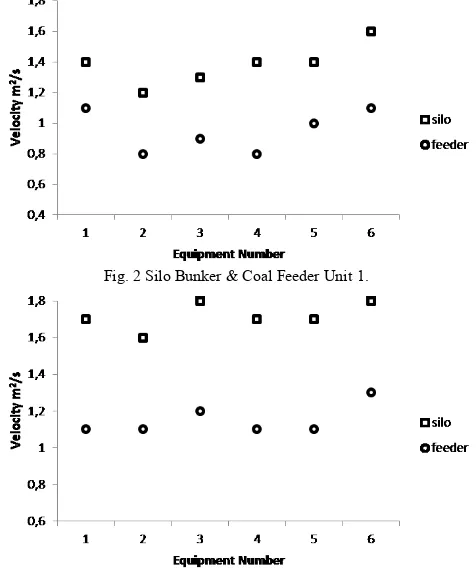
Tanjung Jati B power plant has units 1 and 2, each unit has 6 coal silo bunker with a capacity of 500 tons, so a total of 12 coal silo bunker. At the time of observation, the authors obtain the following data at Tabel 1.
TABLE I
SPEEDOFCOALSILOBUNKER&COALFEEDER (M/S)
TANJUNG JATI B POWER PLANT
m/s UNIT 1 UNIT 2
1 2 3 4 5 6 1 2 3 4 5 6
silo 1.4 1.2 1.3 1.4 1.4 1.6 1.7 1.6 1.8 1.7 1.7 1.8
feeder 1.1 0.8 0.9 0.8 1 1.1 1.1 1.1 1.2 1.1 1.1 1.3
As for the graphical presentation using images obtained following chart in Fig. 2 and Fig. 3.
Fig. 2 Silo Bunker & Coal Feeder Unit 1.
From Figures 2 and 3 show that each silo bunker and coal feeder in unit 1 and unit 2 has a flow rate of coal varies. This proves that silo bunker and coal feeder operation is not based on a precise calculation but based on secure estimates fuel supply to operate the boiler only. In observation, obtained Stacker/Reclamer not operate due to a silo bunker filled with coal. These conditions make the coal handling mostly stand by because all silo bunker filled. Seen in the graph speed of coal have the same correlation where if the speed is reduced, the coal bunker coal feeder speed will decrease, and vice versa. This is because the process of coal handling sequence.
1 1 1 2 2 2
CV
T
upd
u
V A
u
V A
t
If u1 = 0 and no flow at coal feeder, then equation became as follow
CV
T
upd
t
When inside control volume, coal feeder moves with condision Vcoal feeder, speed u = V then equation became
CV
M
T
V
d
V
t
t
By using these equation, obtained Tabel II as folows,
TABLE II
POWERCAPACITYOFCOALFEEDER (N) TANJUNG JATI B POWER PLANT
UNIT 1 UNIT 2
1 2 3 4 5 6 1 2 3 4 5 6
silo 1,4 1,2 1,3 1,4 1,4 1,6 1,7 1,6 1,8 1,7 1,7 1,8
feeder 1,1 0,8 0,9 0,8 1 1,1 1,1 1,1 1,2 1,1 1,1 1,3
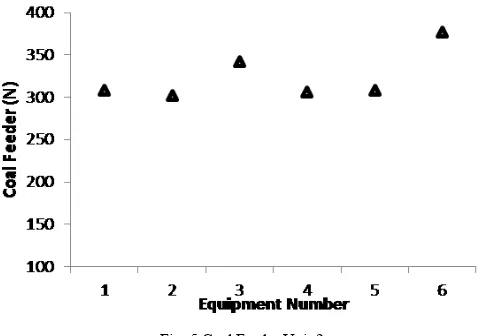
V (kg/s) 235 225 230 240 240 270 280 275 285 278 280 290
T chain (N) 259 180 207 192 240 297 308 303 342 306 308 377
[image:4.595.308.547.60.228.2]From Tabel II, as for the graphical presentation using images obtained following chart in Fig. 4 and Fig. 5.
Fig. 4 Coal Feeder Unit 1.
Fig. 5 Coal Feeder Unit 2
The operations results of coal feeder calculation shows correlation inside control volume at silo bunker and coal feeder, that if the velocity of coal down in the silo bunker increases, so the rate of coal feeder speed will also increase. For power capacity used to move the chain conveyor in coal feeder will also increase. To the contrary, if the velocity of coal down in the silo bunker slower, so the rate of coal feeder speed the chain conveyor inside control volume of coal feeder will also be slower. Power capacity to move chain conveyor of coal feeder will also be lower.
In unit 1, highest speed flows down of coal in the silo bunker No. 6 with a speed of 1.6 m/s, speed of coal feeder 1.1 m/s and the force required to move the conveyor chain of 297 N. For lowest speed flows down of coal in silo bunker No. 2 with a speed 1.2 m/s, speed of coal feeder 0.8 m/s and the force required to move the chain conveyor 180 N.
In unit 2 the highest of coal speed flows down in silo bunker No. 3 and No. 6 with a speed of 1.8 m/s, but the highest speed of coal feeder No. 6 with speed of coal feeder 1.3 m/s and the force required to move the chain conveyor at 337 N. For lowest speed of flows down coal in the silo bunker No. 2 with a speed of 1.6 m/s, speed of coal feeder 1.1 m/s and the force required to move the conveyor chain of 303 N.
IV.CONCLUSIONS
1. Silo bunker and coal feeder operation is not based on a precise calculation but based on secure estimates fuel supply to operate the boiler only.
2. Calculation of coal feeder shows correlation inside control volume at silo bunker and coal feeder. If the velocity of coal down in the silo bunker increases, so the rate of coal feeder speed will also increase. For power capacity used to move the chain conveyor in coal feeder will also increase and thus vice versa.
REFERENCES
[1] Kuttalakkani.M, Natarajan.R, Amith Kumar Singh, Vijayakumar.J,
Arunan.S, Sarojini.L., “Sensor Based Effective Monitoring of Coal
[2] Peter, B., “The Extended Discrete Element Method (XDEM) for Multi-physics Applications”, Scholarly Journal of Engineering Research, Vol. 2(1), pp. 1-20, May 2013.
[3] Japan Coal Energy Center (JCOAL), “Clean Coal Technologies in Japan”, Technology Innovation in the Coal Industry, January 2007.
[4] Ravenet, J., “Silo Problems, Bulk Solids Handling”, Trans Tech Publication, Vol. 1 No. 4, pp. 667-680, December 1981.
[5] Siemens, “Measuring Pulverized Coal in Bunker”, Case study 2007. [6] PT. Makmur Sejahtera Wisesa, Environmental Management and
Monitoring Study in 2 x 30 MW Coal Fired Steam Power Generator (PLTU) Tanjung-Tabalong”, March 2007.
[7] Wlstenholme, E.F., “Designing and Assessing The Benefits of Control Policies for Conveyor Belt Systems In Underground Coal Mines”, Dynamica, Vol. 6, Part 2, pp. 25-35, Winter 1980.