ANALYSIS OF WIND SPEED SOUTH SEA
AS A POTENTIAL SOURCE OF RENEWABLE ENERGY D.I YOGYAKARTA
BASED ON SATELLITE REMOTE SENSING DATA USING FUZZY LOGIC
Hendro PH
*, Ahmad Agus Setiawan
**, Adhika Widyaparaga
****
Department of System Engineering University of Gadjah Mada, Yogyakarta, Indonesia
Department of Physic Engineering University of Gadjah Mada, Yogyakarta, Indonesia
Department of Mechanical Engineering [email protected]
University of Gadjah Mada, Yogyakarta, Indonesia
Abstract
—
How much energy prediction can be produced very important in electric energy markets. Electrical energy was sold before the actual energy produced is very important for the economic balance a power companies. Thus require analysis of wind speed as a potential source of energy. Analysis of windspeed were calculated using Sugeno’s fuzzy with wind speed data based on the 24-year period data. An analysis of wind energy, the output value is based an analysis with assumes a constant density atmosphere, where is density of the air has a fixed value from sea surface level to top atmosphere. The model of Sugeno’s fuzzy
wind prediction system designed for first order, second order, third order, fourth order, twelfth order and twelfth order modified. Overall models can not follow pattern of data test. Then selected models Sugeno’s fuzzy twelfth order, because have a small RMSE values. Furthermore, the wind speed prediction system and analysis of wind energy are designed using Graphic User Interface (GUI) in Matlab R2013a. Results are based variable height from ground level, shows that the value of wind energy potential in Gunung Kidul higher than Bantul and Kulon Progo.
Keywords - Wind Velocity, Fuzzy Logic, Forecasting and Class of Energy.
I. INTRODUCTION
Energy is one determinants to survival people of a State. In modern society, need of energy, especially electricity has becomes integral discussion of three-dimensional at the same time, economic development, social welfare and environmental sustainability. Sustainable development is defined as development that meets the needs of the present without compromising ability next generations to meet their own needs (UNEP-IEA, 2002)[4]. Thus, the electrical energy needs are increasing with the increase of population requires not only equitable distribution of electrification, but also preservation of the environment.
Total world oil resources has reach 325 billion tons (US Geological Survey, 1995). Around thirty three percent have been utilized (Rebhan, 2002). Most of the fossil energy reserves have been consumed in a period of 200 years, about
half of the fossil energy has been spent for human consumption within the last 20 years (Pykh and Pykh, 2002). It has been shows a massive increase of energy demand. Meanwhile about 1950, carbon emissions reached 1.6 billion tons per year and continue increase until the year 2000 to reach 6.3 billion tons per year. Carbon emissions Indonesia has predicted continue to increase from 116 million tons to 270 million tons on 2018. Eighty-five percent of these emissions, or about 228 million tonnes comes from burning coal as a power plant (PLN 2009)[4].
The amount of electric subsidies from 2004 to 2011 has increased from 3.31 trillion rupiah to 93.17 trillion rupiah. This will continue to increase in line with population growth, but it is also a ratio of the national electrification is still relatively low and became a separate task for the government.
II. LITERATUREREVIEW
Wind is an air mass moving horizontally that flows from high pressure into the low pressure region. As greater as difference of air pressure, as greater as wind speed blows (Hasse and Dobson, 1986)[11].
Coriolis force arises from earth rotation and cause changes motion of wind to right in northern hemisphere and deflection of wind to left in southern hemisphere (Pariwono and Manan, 1990). According to Wyrtki (1961), the monsoon system in Indonesia is divided into four groups, namely:
1. Northeast monsoon of winds and West Monsoon of winds
2. Transition I
The first transition occurs from March to May. By the time Season Transition, wind speed is weak and direction become irregular.
3. Wind southwest monsoon and Winds southeast monsoon In June to August, low pressure of air formed in Asia continent, while high pressure of air formed in Australia continent, so the wind is blowing from the Australian continent to Asia continent. In the northern hemisphere (north of the equator) blowing southwest monsoon of wind, whereas in the southern hemisphere (south of the equator) blowing southeast monsoon of winds.
4. Transition II
The second transition occurs in September to November. By the time Season Transition, wind speed is weak and direction become irregular.
U.S Departmnent energy (2005) used QuikSCAT data, the potential of wind speed in Yogyakarta coastal is 6m/s up to 7m/s [24]. Purba, Noir P (2014), wind speed averages in south of west java is about 5.3-12.6 m/s[18].
Wind power forecasting errors in grid dispatch are
important to balance the power fluctuation caused by wind
variations, With increasing penetration level of wind power (Ning Chen, et all, 2013)[17]. The behaviours of the forecasts in the transformed series is similar to that of the actual of velocities, use of the hourly mean and standard deviation values use on a monthly basis of the standardization is accurate (J.L Torres et all, 2004)[9].
Tiejun Ling, et. All (2003) The operational sea surface wind field forecasts system was not a mature work[25]. Various forecasting models are introduced and a lot of researches on the models all have their own characteristics. Some of them are good at short-term prediction, some are simple and widely used while other complex ones have more accurate results. Recently, with the development artificial intelligence and mathematical technique, a lot of new methods were put forward. Many of them are more excellent than the conventional methods and have good development prospect (Lei Ma, et all, 2008)[13].
III.RESEARCHMETHODS
III. 1. Basic of Analysis
Research method used a review of the data library. The study was conducted by analyzing data of satellite remote sensing that recorded of wind speed in the coastal of Yogyakarta. Then uses fuzzy logic to analyze the potential of wind energy in the coastal of Yogyakarta. The software used as a tool of analysis is fuzzy toolbox and Graphic User Interface (GUI) in Matlab R2013a and SPSS 11.5.
III. 2. Model of Fuzzy
Sugeno‘s fuzzy used to predict the wind speed of the coming year with each variation fullfil the linear equation:
a. First order
ݕ݊ ൌܽǤݔ݊െͳܾ (1)
b. Second order
ݕ݊ ൌܽǤݔ݊െʹܾǤݔ݊െͳܿ (2)
c. Third order
ݕ݊ ൌܽǤݔ݊െ͵ܾǤݔ݊െʹܿǤݔ݊െͳ݀ (3) d. Forth order
ݕ݊ ൌܽǤݔ݊െͶܾǤݔ݊െ͵ܿǤݔ݊െʹ݀Ǥݔ݊െͳ݁(4) e. Twelfth order
ݕ݊ ൌܽǤݔ݊െͳʹܾǤݔ݊െͳͳܿǤݔ݊െͳͲ݀Ǥݔ݊െͻ
݁Ǥݔ݊െͺ݂Ǥݔ݊െ݃Ǥݔ݊െ݄Ǥݔ݊െͷ݅Ǥݔ݊െͶ
݆Ǥݔ݊െ͵݇Ǥݔ݊െʹ݈Ǥݔ݊െͳ݉ (5)
f. Twelfth order modified (based on beaufort scale) Where n is the month and n : 1, 2, ..., 11, 12.
The fuzzy structure : Type :Sugeno
And method : Prod Or method : Probor Implication method : Prod Aggregation method : Max Defuzzification : Wtaver Member function : Gaussmf
Clustering :Subclust used for order 1, 2, 3, 4 and 12. Order 12 modified uses Beaufort scale for clustering. See Table.1 for Beaufort scale.
Radius : 0.5
center Description Land conditions
1 0.3-1.5 0.9 Light air Smoke drift indicates wind direction. Leaves and wind vanes are stationary and wind vanes are stationary 3 3.4-5.4 4.4 Gentle
breeze
Leaves and small twigs constantly moving, light flags extended 4 5.5-7.9 6.7 Moderate
breeze
Dust and loose paper raised. Small branches begin to move
5 8.0-10.7 9.35 Fresh breeze
Branches of a moderate size move. Small trees in leaf begin to sway 6 10.8-13.8 12.3 Strong
breeze
Large branches in motion. Whistling heard in overhead wires. Umbrella use becomes difficult. Empty plastic bins tip over
7 13.9-17.1 15.5 High wind, moderate gale, near gale
Whole trees in motion. Effort needed to walk against the wind
and Kulon Progo. The figure of curve pattern are shown in Fig.1.
Fig. 1 Curve pattern of gaussmf based on beaufort scale
Formulation of gaussmf [10]:
݂ሺݔǡߪǡܿሻൌ݁െሺʹݔെܿߪʹሻʹ (6)
ݔ : Range of wind speed (m/s)
ߪ : Sig
ܿ : Center for each curve
III. 3. Model Atmosferic Analisys
Pressure variation of altitude is obtained from the hydrostatic equation[22]:
ݖ ൌͲെ ߩͲǤ݃Ǥݖ (7)
Shrinkage temperature for real atmospheric is about
Ͳǡͷܥ
ͳͲͲ݉
ൗ , temperature at a height z is given by the equation[22]:
ܶݖ ൌܶͲെߛݖ (8)
ܶͲ = Surface temperature
ߛ = Shrinkage temperature
ݖ = Height
The average wind speed formulated as follows[19]:
ݒҧൌ݊ͳσ݊ ݒ݅
݅ൌͲ (9)
The standard deviation for wind speed is[19]:
ߪʹൌ ͳ
݊െͳσ ሺݒ݅݊݅ൌͲ െ ݒҧሻʹ (10)
Poisson probability function fullfil the equation[23]:
ሺݒǡݒҧሻൌ݁ݒഥݒݒതǨݒ (11)
With ݒҧ average value of a number observations of wind speed and v is an integer value range of wind speed data.
Gross energy (EG) is Total potential of annual wind energy with wind speeds at atmospheric pressure and temperature condition on site [19].
ܧ݃ ൌܧܷܿܪܿܶ (12)
ܿܪൌܲܲ
Ͳ (13)
ܿܶൌܶͲܶ (14)
CH = Pressure coefficient (Pa) CT = Temperature coefficient (C)
P0 = Absolute atmospheric pressure 101.3 kPa
T0 = Absolute atmospheric temperature 288.1 K or 14.95 C. P = Annual average of atmospheric pressure on site. T = annual average of temperature on site.
Estimates of energy based on the height from ground level [5].
ࢂࢆࢎ࢛࢈
ࢂࢆࢇࢋൌ
ࢆࢎ࢛࢈ࢆ
ࢆࢇࢋࢆ (15)
Vzhub : Wind speed at hub height (m/s)
VZanem : Wing speed at anemometer height (m/s)
Zanem : Anemometer height(m)
Zhub : Hub height (m)
Z0 : Land factor according to Manwell, Mc Gowan and
Rogers. Used value Z0 = 0,0002.
The amount of wind energy at annual average of wind speed
[19]
.
ܧݒതൌ ͺͲσ݊ݔൌ݅ܲݔሺݔሻ (16)
ܲݔൌσ݊ݔൌ݅ͲǤͷߩݔ͵ (17)
Where ߩ is air density and p (x) is probability to obtain x wind speed during a year.
Table 2 is explain wind power class :
TABEL 2 WIND POWER CLASS Wind Power
Class
Wind Power Density at 10m (W/m2)
Resource Potential
1 0-100 Poor
2 100-150 Marginal
3 150-200 Fair
4 200-250 Good
5 250-300 Excellent 6 300-400 Outstanding
7 >400 Superb
Root Means Square Error (RMSE) [16].
ܴܯܵܧൌሺܲݎ݁݀݅ܿݐ݅݊ െܦܽݐܽξܲݎ݁݀݅ܿݐ݅݊ ሻ (18)
IV.RESULTSANDDISCUSSION
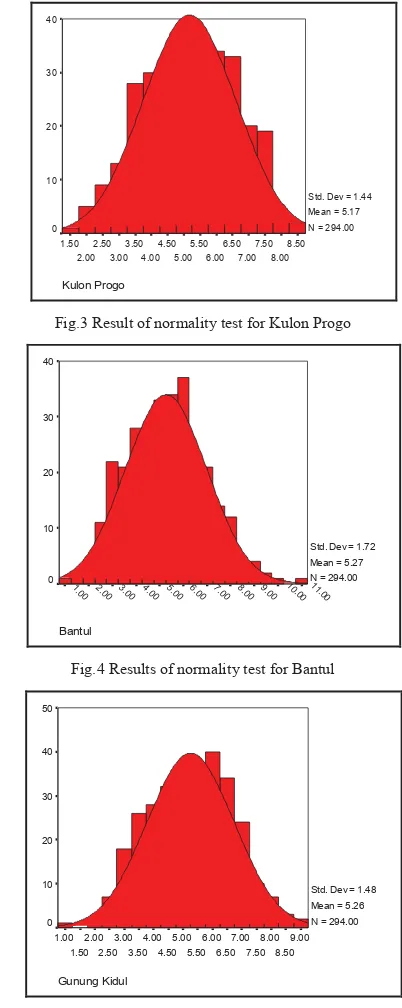
The normality test of data is uses Kolmogorov-Smirnov method, indicates that the data are normally distributed. With Asymp.Sig value (2-tailed) for the Kulon Progo 0.36> 0.05, Bantul 0.838> 0.05 and Gunung Kidul 0.105> 0.05, see Table 2. In Fig.2, Fig.3 and Fig.4 are shown a normal distribution of wind speed data for each region.
TABLE 3
ONE SAMPLE KOLMOGOROV-SMIRNOV TEST
Kulon Progo
Fig.3 Result of normality test for Kulon Progo
Bantul
Fig.4 Results of normality test for Bantul
Gunung Kidul
Fig.5 Results of normality test for Gunung Kidul
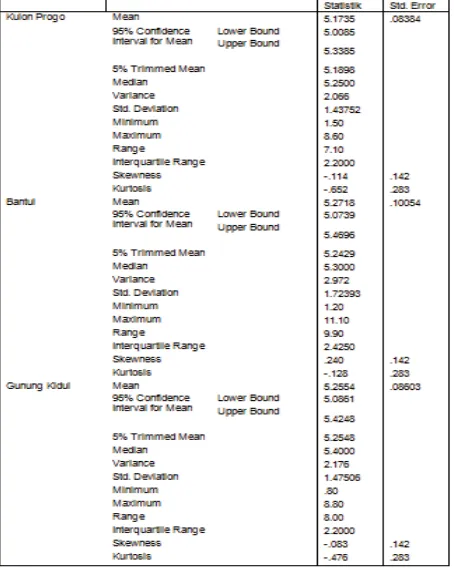
Furthermore, by using t-test one sample method to test the average value for each region. Based on sample of average wind speed for Kulon Progo is 5,17m / s, Bantul 5,27m / s and Gunung Kidul 5,25m / s. Then selected sample with average value for each region is 5,2m / s as average value for test. The results are shown in Table.3, With Asymp.Sig value (2-tailed) for Kulon Progo coastal 0.75> 0.05, Bantul coastal 0.476> 0.05 and Gunung Kidul coastal 0.52> 0.05.So, 5,2m / s as average test value for wind speed each location is valid with alpha value 0.05 and time series data for wind speed is normal.
start
TABLE 4
NORMALITY TEST FOR WIND SPEED DATA EACH LOCATION
Table 4 shown result from normality test of data monthly. Data monthly for each location is normal, see Fig.5 as shown curve of normality data. Then Table 5 are shown average of wind speed and amount of data.
TABLE 5
NORMALITY TES FOR WIND SPEED DATA MONTHLY
Months Gunung kidul Bantul Kulon Progo
January 0.288 0.412 0.855
Fig.6 Result of normality test for data monthly
TABLE 6
WIND SPEED AVERAGE AND DATA MONTHLY Months Gunung kidul Bantul Kulon Progo January 4.829 24 4.670 24 4.470 24
Annual wind speed data of Kulon Progo coastal, Bantul coastal and Gunung Kidul coastal are normal distribution with sample of data is relatively large, or nearly infinite, so use the poisson probability distribution function as shown Table 6. Probability of wind speed average for each location is same relatively. See Fig 6.
TABLE 7
POISSON PROBABILITY DISTRIBUTION FUNCTION PDF Poisson
Fig.7 Curve of poisson probability distribution function
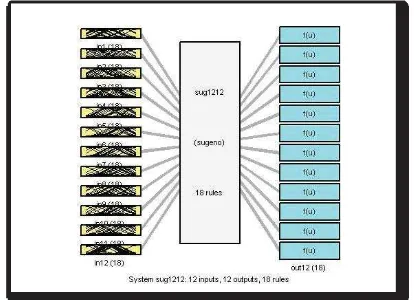
Fig.7 shown the result of fuzzy model for wind prediction in Matlab.
Compare models of fuzzy is doing with chose value minimum of Root Mean Square Error (RMSE). Than doing t-test one sample from minimum value of RMSE to known correlation among the model. See Tabel 7 and Tabel 9, the minimum value of RMSE achieved by fuzzy model with order 12.
Border Gunung kidul Bantul Kulon Progo
0
TABLE 8
ROOT MEAN SQUARE ERROR FUZZY MODEL OF KULON PROGO
Bulan
Based on Table 8 and Table 10, among fuzzy models order 2, 3, 4, 12 and 12 modified are not different significant with alpha value is 0.05.
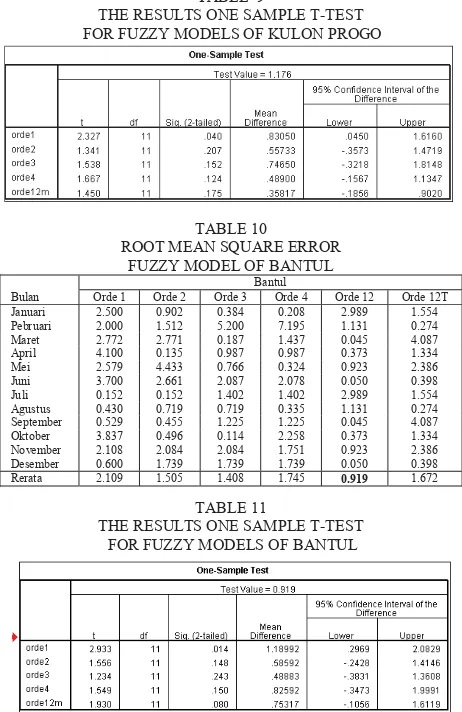
TABLE 9
THE RESULTS ONE SAMPLE T-TEST FOR FUZZY MODELS OF KULON PROGO
TABLE 10
ROOT MEAN SQUARE ERROR FUZZY MODEL OF BANTUL
Bulan
THE RESULTS ONE SAMPLE T-TEST FOR FUZZY MODELS OF BANTUL
Based on Table 11 and Table 12, minimum RMSE achieved by fuzzy model with order 4. Then among fuzzy models order 1, 2, 3, 4 and 12 is not different significant with alpha value is 0.05.
TABLE 12
ROOT MEAN SQUARE ERROR FUZZY MODEL OF GUNUNG KIDUL
Bulan
THE RESULTS ONE SAMPLE T-TEST FOR FUZZY MODELS OF GUNUNG KIDUL
Based on one sample test for fuzzy models in Table 8, Table 10 and Table 12 are chose fuzzy model order 12 for each location.
Furthermore, fuzzy models has chosen will be tested by paired samples t-test.
The results are shown in Table 14.
TABEL 14
THE RESULT PAIRED SAMPLES T-TEST FOR FUZZY MODEL OF KULON PROGO
Table 13. shown the results test of T-Test for wind predictive model of Kulon Progo coastal. By using alpha value of 0.05, the results are valid for the month of January, March, April, May, June, September, October and November.
TABLE 15
THE RESULT PAIRED SAMPLES T-TEST FOR FUZZY MODEL OF BANTUL
TABLE 16
THE RESULT PAIRED SAMPLES T-TEST FOR FUZZY MODEL OF GUNUNG KIDUL
By using alpha value of 0.05, the results are valid except for the month of March. Predicted winds Gunung Kidul coastal for March have significance below 95%.
The results paired samples t-test all location in Yogyakarta coastal as shown in Table 16.
TABLE 17
VALIDITY FUZZY MODELS FOR WINDS PREDICTION IN YOGYAKARTA COASTAL
Months Gunung Kidul Bantul Kulon Progo January Valid Valid Valid February Not valid Valid Valid March Valid Valid Not valid April Valid Valid Valid May Valid Valid Valid June Valid Valid Valid July Not valid Not valid Valid August Not valid Valid Valid September Valid Valid Valid October Valid Not valid Valid november Valid Not valid Valid December Not valid Valid Valid
Fig.7 shown fuzzy model for wind prediction in Kulon Progo with 18 rules from results of the substractive cluster method. Amount of rules for fuzzy model Bantul and Gunung Kidul are same, 18 rules.
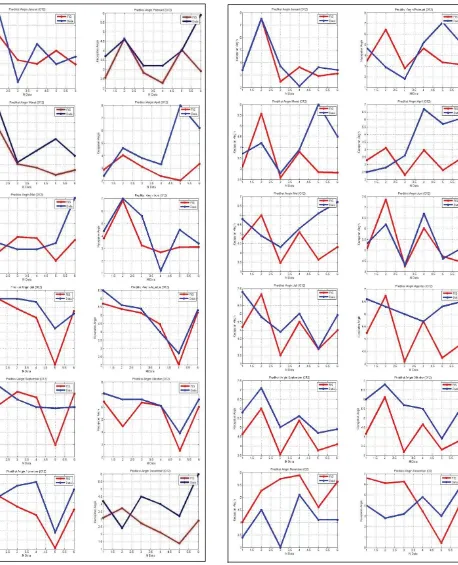
Fig.8 Fuzzy model twelfth order for wind prediction Kulon Progo
See Fig.8, Fig.9 and Fig.10 for curve pattern between winds speed data with results of prediction wind speed. The data was represented with blue line and results of prediction was represented with red line. The results consecutive Kulon Progo, Bantul and Gunung Kidul did not able to follow pattern of data.
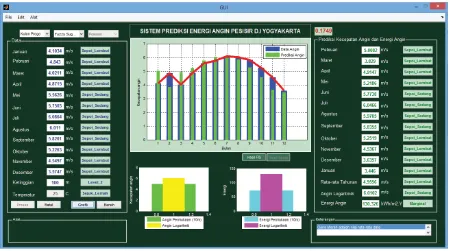
Fig.11 shown the results of the design analysis of wind energy for one year using Matlab R2013a, then Fig.12 shown the results for monthly prediction. Blue bar diagram are represents the value of the wind speed data. Green bar
diagram are represents the predicted value of the wind speed in the next year. Red line is the value of the averages wind speed Yogyakarta coastal for a period of 18 years.
Fig.12 Design Program for yearly energy analysis
See Table 17, a scenario for supply wind energy from winds speed in Yogyakarta coastal. The results of prediction achieved by input value of wind speed average from data.
TABLE 18
THE RESULTS OF PREDICTION WIND SPEED FOR NEXT YEAR Months Gunung Kidul Bantul Kulon Progo
January 4.4 4.5 3.4
The results prediction consecutively Gunung Kidul, Bantul and Kulon Progo are 5.1m/s, 5.1m/s and 4.9m/s. it is different with QuikSCAT where the potential of wind speed in Yogyakarta coastal is 6m/s up to 7m/s.
Based on Table 17, then calculate class of energy to know potential. The correlation between class of energy with hub height were shown in Table 18. We chosen 5.0m/s for potential of wind speed to analysis class of energy.
TABLE 19
THE CLASS OF ENERGY IN YOGYAKARTA COASTAL Height hub Wind Prediction Power (kWh) Class of Energy
10 5.0 74.34 Poor
At last, the operational sea surface wind field forecasts system was not a mature work. We must do more experiments to study how initial and boundary condition affect the model, and improve the model predict capability to forecast different weather procedures better.
V. CONCLUSION
There are some things that was generated in this study : a. Annual wind speed coastal Yogyakarta, like in Kulon
Progo, Bantul and Gunung Kidul are 5.0m/s-5.3m/s.
b.
The results shown that the potential of wind energy in Yogyakarta coastal, including poor energy class at a height of 10m. While it is based on a variable height of terrain from sea surface indicate that wind energy potential in Yogyakarta coastal will be entered into good class at a height of 500mdpl. Based on data elevationfrom sea surface, Gunung Kidul coastal is potential to wind energy, because have height about 50m-250m.
ACKNOWLEDGMENT
The ADEOS-II wind ocean data was obtained from PO.DAAC at the NASA Jet Propulsion Laboratory, Pasadena, CA, http://podaac.jpl.nasa.gov.
REFERENCES
[1] Akbar. Ganda Rizkyan, Studi Pembangkit Listrik Tenaga Angin Laut untuk Memenuhi Kebutuhan Penerangan Jembatan Suramadu, Tesis : Institut Teknologi Sepuluh November, Malang, 2009.
[2] Anonim, diakses Pebruari 2014, ADEOS-II Wind Ocean, www.podaac.jpl.nasa.gov. /ADEOS-II
[3] Bergey. M, Small Wind Sistems For Rural Energi Supply, Village Power 2000, Washington, DC, USA, 2000.
[4] Budiarto, Rachmawan, Kebijakan Energi, Penerbit : Samudra Biru, Bantul, 2011.
[5] Burton. Tony, David Sharpe, Nick Jenkins, Ervin Bossanyi, Wind Power Handbooks, Jhon Wiley and Sons, Ltd. England, 2001.
[6] Hartati. Sri Sunarmo, Penginderaan Jauh dan Pengenalan Sistem Informasi Geografis Untuk Bidang Ilmu Kebumian, Penerbit : ITB, Bandung, 2009
[7] Hartono, SPSS 16.0 Analisis Data Statistik dan Penelitian, Penerbit : Pustaka Pelajar dan Zanava, Yogyakarta, 2013.
[8] Hiester, T.R. and Pennell, W.T, The Siting Handbook for Large Wind Energi Systems, WindBooks, New York, NY, USA, 1981.
[9] J.L Torres, A. Garcia, M. De Blas, A De Francisco, Forecast of hourly average wind speed with ARMA model in Navarre (Spain), Solar Energy, ELSEVIER, 2004.
[10] Kusumadewi. Sri, Analisis dan Desain Sistem Fuzzy Menggunakan Toolbox Matlab, Penerbit Graha Ilmu, Yogyakarta, 2002.
[11] Lanuru. Mahatma, dan Suwarni, Pengantar Oseanografi, Fakultas Ilmu Kelautan dan Perikanan. Makassar, 2011.
[12] Le Gouriérès, D, Wind Power Plants: Theory and Design, Pergamon Press, 1982.
[13] Lei. Ma, Luan Shiyan, Jiang Chuanwen, Liu Hongling, Zhang Yan, A review on the forecasting of wind speed and generated power, Renewable and sustainable review, Elsevier, 2008.
[14] CP LO, Pengideraan Jauh Terapan, Penerbit Universitas Indonesia, Jakarta, 1996.
[15] Maidment, RD, Handbook of Hydrology, McGraw-Hill, New York, 1989.
[16] Naba. Agus, Belajar Cepat Fuzzy Logic Menggunakan Matlab, Penerbit : Andi. Yogyakarta, 2009.
[17] Ning Chen, Qi Wang, Liangzhong Yao, Lingzhi Zu, Yi Tang, Fubao Wu, Mei Chen, Ningbo Wang, Wind power forecasting error-based dispatched method for wind farms cluster, J. Mod. Power. Syst. Clean Energy, Springer, 2013.
[18] Purba, Noir P, The Wind and Sea Waves Variability as a Renewable Energy in the Southern West Java, Jurnal Akuatika Vol.5 no:1 Maret, 2014.
[19] RETScreen, Clean Energi Project Analysis, CANMET Energi Technology, Canada, 2004..
[20] Russell, G.L, J.R. Miller, and D. Rind, A coupled atmosphere-ocean model for transient climate change studies, Atmos.-Ocean, 33, 683-730, 1995.
[21] Tim Vasquez, Observer Handbook, Weather Graphics Technologies, Washington DC, US, 1998.
[22] Tjasyono. Bayong HK, Meteorologi Terapan, Penerbit : ITB, Bandung, 2008.
[23] Wibisono. Yusuf, Metode Statistik, Gadjah Mada University Press, Yogyakarta, 2009.
[24] National Renewable Energy Laboratory, QuikSCAT - Annual Wind Power Density at 10m, U.S Department of Energy, 2005.
[25] Tiejun. Ling, Zhang Yunfei, Yang Xuelian, Li Xuekun, Ji Xiaoyang,