Red tide detection using remotely sensed data: A case study of
Sabah, Malaysia
Asmala Ahmad1, Noorazuan Hashim2, Laili Nordin3
1
Technical University of Malaysia Malacca Durian Tunggal, Melaka,2
School of Social, Development and Environmental Studies, Universiti Kebangsaan Malaysia, Bangi,3Malaysian Centre for Remote Sensing (MACRES), Kuala Lumpur
Correspondence: Asmala Ahmad (email: [email protected])
Abstract
A red tide (RT) is composed of harmful blooms or algae that could cause mass mortalities of marine life and lead to human intoxications or even death. Several red-tide events have been reported in Sabah since 1976. The latest event occurred in February and March 2000 near the coastal waters of Sipitang Bay. This article examines the use of the RT image-processing algorithm through SPOT 4 satellite data application in detecting toxic blooms which occurred on February 2000. Results from the classified image indicate that SPOT 4 is capable of determining a possible red tide event quantitatively and spatially. It is estimated that about 40 km2of the classified image was affected by RT. The occurrence of red tide was due to an increase of nitrate- and phosphorus- based nutrient loads discharge the aftermath of anthropogenically induced land use and land cover change near Sipitang-Beaufort area. This research suggests further investigations with detailed land cover information to demarcate inorganic sources, as well as a field survey of seawater quality conditions.
Keywords: anthropogenic activities, image-processing algorithm, land cover change, land use, red tide, SPOT 4 satellite data
Introduction
Phytoplankton can be defined as algae or microscopic plants that float on the surface of water bodies such as oceans, lakes and rivers.In the ocean, algal communities constitute the base of the marine food web. Algal blooms are biological phenomena associated with high cell concentrations of phytoplankton. Since phytoplankton form the base of the marine food web, algal blooms have close relationship with the oceanic primary production. The detection and monitoring of these blooms are often considered as a viable means for locating new fishing grounds. Thus, algal bloom monitoring has a positive impact on countries engaged in marine fishing. However, not all algal blooms are beneficial to humans. Often the terms 'Harmful Algal Bloom (HAB)' or red tides are used to describe algal blooms that cause negative impacts on humans. Red tide (RT) is a general term referring simply to the accumulations of very dense phytoplankton that the water appears to be coloured (Linet al., 1999).
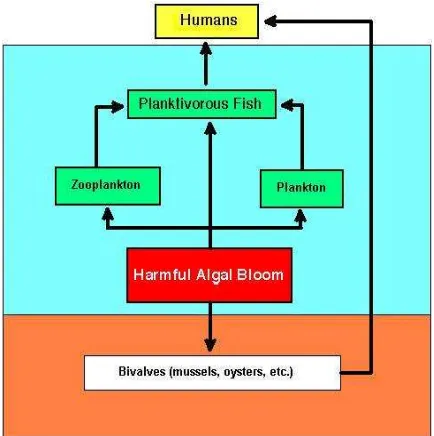
HAB may harm aquatic life. The bloom can reduce oxygen concentrations in oceans and kill aquatic organisms due to lack of oxygen. In a situation where a bloom is dominated by toxic algal species, toxins can be accumulated in the food web (Figure 1) and eventually be consumed by humans to cause paralytic or diarrheic shellfish poisoning (Corrales & Gomez, 1990; Smayda, 1997).
Classification of harmful algal blooms (HABS)
HABs are caused by a number of dinoflagellates and diatoms. The significant features associated with a red tide occurrence are as follows (Coralles & Gomez, 1990):
(i) Paralytic Shellfish Poisoning (PSP)
The causative dinoflagellates are Alexandrium acatenella, Alexandrium catenella, Alexandrium cohorticula, Alexandrium fundyense, Alexandrium fraterculus, Gymnodinium catenatum and Pyrodinium bahamense var compressum. (ii) Diarrhetic Shellfish Poisoning (DSP)
The causative dinoflagellates are dinoflagellate Dinophysis acuta, Dinophysis acuminata, Dinophysis fortii, Dinophysis mitra and Prorocentrum lima.
(iii) Amnesis Shellfish Poisoning (ASP)
The causative dinoflagellates are diatom Pseudo - nitzschia multiseries, Pseudo pseudodelicatissima, Pseudo australis.
(iv) Ciguatera Fish Poisoning
The causative dinoflagellates are dinoflagellate Gambierdiscus toxicus, Ostreopsis sp, Prorocentrum sp.
(v) Neurotoxic Shellfish Poisoning (NSP)
The causative dinoflagellates are dinoflagellate Gymnodinium breve, Gimnodinium cf. Breve (New Zealand).
(vi) Cyanobacterial Toxin Poisoning
The causative dinoflagellates are Cyanobacteria Anabaena circinalis, Microcystis aeruginosa, Nodularia spumigena.
The first RT occurrence in coastal Sabah was detected in 1976. The threats associated with this red tide were caused by the population blooms of dinoflagellate calledPyrodinium bahamense var compressum. This is a significant threat to human heath and public safety because of the danger of PSP (Paralytic Shellfish Poisoning) for people who ingest toxic shellfish especially
bivalves. These microscopic dinoflagellate population blooms can be very pronounced with concentrations reaching millions of cells per litre of water.
The red tide monitoring system in Sabah
Red tides have consistently occurred every year, but Sabah has only experienced a few serious outbreaks hitherto. The Red Tide Monitoring System is designed to determine the occurrence of red tide especially the presence of PSP-toxic aquatic animals. Monitoring of paralytic shellfish poisoning (PSP) is carried out by the Fisheries Department of Sabah. It involves the collection of PSP-prone species of mollusc and fish and analyses at the Likas Fisheries Research Centre.
The method by which the levels of toxins are determined from the sample shellfish and bivalves is theStandard Mouse Bioassay (Hui et al., 2001). In accordance with this monitoring system, the location and species of the samples are recorded and the concentration of diatoms in the seawater determined.
The Public Safety Programme organized by the Health Department of Sabah aims to prevent the local population from being affected by PSP poisoning. This is done by informing the public not to collect or sell or even eat affected species of seafood. The programme activities include warnings and information dissemination regarding the dangers of RT as well as preventing the selling of the hazardous seafood to the public.
Although conventional monitoring of red tides is carried out on a regular basis, often warnings sent from authorised agencies have been too late. Since the first RT occurrence in 1976, awareness among public has been increased regarding the implementation of better alternatives for detecting red tide.
RT can cause losses for the economy, welfare and even life (UNESCO, 2002). For this reason, it is critical to have an efficient early warning system so that the public can take timely necessary measures. Conventionally, methods of detecting RT are incapable of conveying early signs of RT. Often the broadcast of the risk to the public was done after cases of human intoxication have been reported with several actual measurements taken. Besides that, the usual procedures for determining red tides are time consuming and also impractical if coastal sampling by small boats is to be conducted over relatively large areas.
Methodology
Many researchers have used remote sensing techniques employing short wave band images to map red tide events. Satellite images have been used to map the highly reflective blooms due to Coccolithopere species (Groom & Hooligan, 1987; Balch et al., 1991) and to study sediment concentrations and blooms in turbid estuaries and lakes (Stumpf, 2001; Stumpf and Tyler; 1988, Stumpf & Pennock 1989; Prangsma & Roozekrans, 1989). Detection of plankton blooms in waters of high turbidity must rely on the effect of chlorophyll absorption at red wavelengths (Stumpf & Tyler, 1988) or of the high chlorophyll reflectance in the near infrared (Prangsma & Roozekrans, 1989). This article shows that short wave bands of SPOT 4 satellite data can be used to monitor and detect red tide events that are associated with intense red plankton blooms which threaten the coastal areas of Sabah in 2000.
SPOT (Satellite Pour l'Observation de la Terre) is a joint venture between French, Swedish and German organisations and operated by the French-based company in Toulouse, SPOT Image. The first SPOT satellite, SPOT 1, was launched in February 1986 by the French Government Agency, Centre National d'Etudes Spatials (CNES). The latest SPOT 5 was launched on 4 May 2002. It provides continuity of the SPOT satellite series, but only with higher spatial resolution of the PAN band (5m and 2.5m), higher spatial resolutions for 3 of the 4 multispectral bands (10m), and dedicated instruments for along track stereo acquisition.
In this study, a modified version of the RT image-processing algorithm by Gower (1994) was used in order to extract the red tide information. The difference is that SPOT uses band 3 (instead of band 2 for AVHRR) for sensing information in near infrared spectrum domain. The algorithm is given by:
RT = G*(b1– b3/ C31) – A*G*((p-1024.5) / 1024) 2
Ifb2>threshold,thenRT =0,
Where,
b1, b3 : Raw signal values in band 1 and 2
A : Atmospheric correction at the edges of the swath
G : Gain Factor
P : pixel number in the swath
C21 : R2/R1
R3, R1 : Reflectance for band 1 and band 3
According to Gower (1994), typical values to enhance red tide image in an 8-bit range are
C31=0.93, A=10, G=8, offset=50, andthreshold=150. These values were found to suit this study
because of the existence of similarities especially in terms of the availability of red and near infrared bands, satellite altitude and data quantisation. Moreover the difference in terms of revisit period and swath width can be ignored as they are believed not to affect the result of this study.
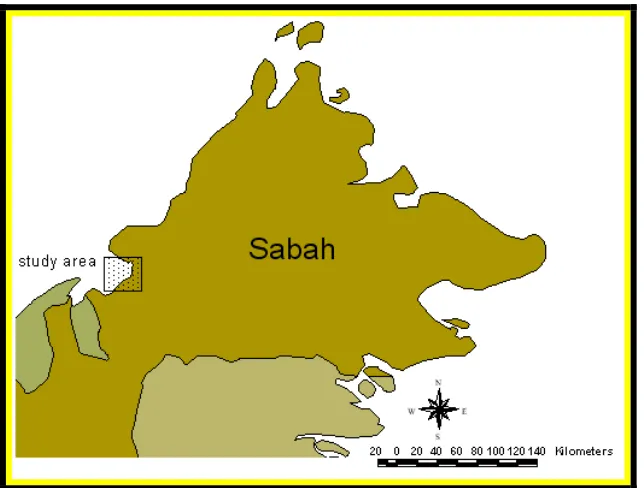
The algorithm was applied to SPOT 4 data dated 23 February 2000 for the area shown by the red box (Figure 2) which covers an area of 400 km2. Image processing was done using PCI EASI/PACE Version 7 software in order to extract red tide information from SPOT 4 data. The data containing the red tide were then enhanced with the RT image-processing algorithm and classified using K-means Classification Scheme. The latter was used because it was simpler and faster compared to other methods especially when applied on large areas (Arthur and Vassilvitskii, 2007). Due to limited ground sampling of RT information gathered by local agencies in the event, the comparison between estimation result based on Gower algorithm and the real situation is not possible.
Figure 2.Map of Sabah and the study area
Result and discussion
Figure 3.SPOT 4 data dated 7 September 1997 (No red tide event). The yellow box shows the study
site that contains no red tide
Figure 4.SPOT 4 data dated 23 February 2000. The bright areas indicatethe occurrence of red
tide
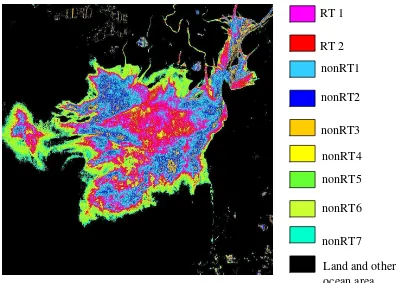
Based on the RT algorithm and K Means Classification results, nearly 10 percent of the classified image was detected as a red tide affected area (Red Tide 1 and Red Tide 2). About 105,699 pixels had been considered to have same reflection value that related to red tide event. The spatial pattern of red tide had proved that the increase of nitrate and phosphorus based nutrient concentrations was due to anthropogenic activities, especially land use – land cover change near the Sipitang - Beaufort area in February 2000.
Figure 5.SPOT 4 23 February 2000 with RT algorithm and K Means Classification scheme applied
RT 1
RT 2
nonRT1
nonRT2
2Plume 2
nonRT3
nonRT4
nonRT5
nonRT6
nonRT7
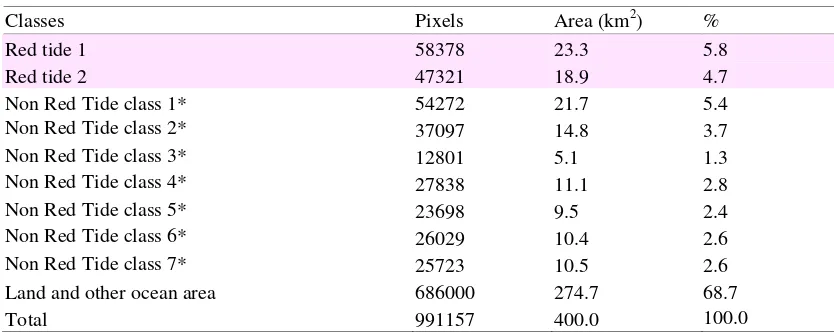
Table 1. Result summary of the statistical analysis of the classified image
Classes Pixels Area (km2) %
Red tide 1 58378 23.3 5.8
Red tide 2 47321 18.9 4.7
Non Red Tide class 1* 54272 21.7 5.4
Non Red Tide class 2* 37097 14.8 3.7
Non Red Tide class 3* 12801 5.1 1.3
Non Red Tide class 4* 27838 11.1 2.8
Non Red Tide class 5* 23698 9.5 2.4
Non Red Tide class 6* 26029 10.4 2.6
Non Red Tide class 7* 25723 10.5 2.6
Land and other ocean area 686000 274.7 68.7
Total 991157 400.0 100.0
Note :*pixels that are not classified as red tide-related features based on the RT algorithm and K Means Classification
A further investigation on land use - land cover change of Sipitang-Beaufort area showed that logging, agricultural, highway development and sandstone quarry activities were predominant in the year of 2000 (DOE, 2006). The main river, the Sg. Padas, discharged the sediment and nutrient into the sea via Sipitang Bay. Deforestation had also given rise to some significant impact on the river’s phosphorus concentration (Acreman, 2000; Wang & Shieh, 2002). The loss of vegetation due to logging and quarry activities had loosen the soil and enhanced weathering activities. All this will accelerate the rate of nutrient leaching from the upper soil sections.
Conclusion
Results of this study indicate that SPOT 4 is capable of determining a possible red tide event both quantitatively and spatially. It is estimated that 40 km2(or approximately 10%) of the selected study area in the image was affected by the red tide in February 2000. The application of remote sensing data has enhanced the information extraction of red tide and the determination of the spatial extent of the event. This information could be utilised in future red tide management and mitigation exercises. This research also suggests that a further study will need to be integrated with detailed land cover information to demarcate nutrient sources as well as a field survey on seawater quality conditions. A detailed accuracy assessment of the obtained result will also need to be measured in order to improve the accuracy of image classifications.
The observation of red tide using remote sensing in Borneo is still based on visible band. Although several algorithms for detecting red tide have been developed elsewhere, such as the multi-band ratio algorithm and the ocean colour–temperature algorithm, these algorithms are still in need of a huge amount of geospatial and ground ‘thruthing’ information. Thus, the effort of using SPOT 4 in monitoring the red tide has to be regarded as still in its experimental stage.
References
Acreman M (eds) (2000)The hydrology of the UK. A study of change. Routledge, London. Abuso ZV, Cabella LMT, Tuazon LC, Barrios EB (1996) Final Meeting on ASEAN-Canada Red
tide network. Organized by ASEAN-Canada Cooperative Programme on Marine Science. Singapore (unpublished report).
Arthur A, Vassilvitskii S (2007) “k-means++ the advantages of careful seeding” 2007 Symposium
on Discrete Algorithms (SODA). Available from:
http://www.stanford.edu/~darthur/kMeansPlusPlus.pdf.
Corrales RA, Gomez ED (1990) Red tide outbreaks and their management in the Philippines. In: Graneli Eet al. (eds)Toxic marine phytoplankton, pp. 453-458. Elsevier Publishing Co, New York
DOE (2006) EIA approved report 2000: Sabah. [Cited 1 February 2006]. Available from: http://www.doe.gov.my/.
Gower JFR (1994) Red tide monitoring using AVHRR HRPT imagery from a local receiver.
Remote Sensing of Environment.48, 309-318.
Groom SB, Holligan PM (1987) Remote sensing of coccolithopore blooms.Adv. Space Res.7(2), 73-78.
Hallegraeff GM, Maclean JL (1989)Biology. Epidemiology and Management of Pyrodinium Red tides. ICLARM Conf Proc. 21, 1-7.
Hui YH, Pierson MD, Gorham JR (2001) Foodborne disease Handbook. Vol 1. Marcel-Decker, New York.
Lin II, Soo CL, Hock L, Leong KK, Michael H, Serena T, Siong TK, Karina G (1999) Classification of tropical algal bloom types by sea truth spectral radiometric data.Proceedings of the 20th Asian Conference on Remote Sensing. [Cited 25 June 2005 ]. Available from: http://www.aars-acrs.org/acrs/proceedings1999.php.
Prangsma GJ, Roozekrans JN(1989) Using NOAA AVHRR imagery in assessing water quality parameters.Int. J. RemoteSensing 10, 811-818.
Richardson K (1997) Harmful or exceptional phytoplankton blooms in the marine ecosystem.Adv. Marine Biology 31, 301-385.
Smayda T J (1997) Harmful algal blooms: Their ecophysiology and general relevance to phytoplankton blooms in the sea.Limnology and Oceanography42 (5) Part 2, 1137-1153. Stumpf RP (2001) Applications of satellite ocean color sensors for monitoring and predicting
harmful algal blooms.Human and Ecological Risk Assessment7 (5), 1363 – 1368.
Stumpf RP, Pennock JR (1989) Calibration of a general optical equation for remote sensing of suspended sediments in moderately turbid estuary.J. Geophys. Res.94 (14), 363-14,371. Stumpf RP, Tyler MA (1988) Satellite detection of bloom and pigment distributions in estuaries.
Remote Sensing of Environment24, 385-404.
UNESCO (2002) IOC Intergovernmental Panel on Harmful Algal Blooms Sixth Session St. Petersburg, Florida, United States of America UNESCO. Intergovernmental Oceanographic CommissionReports of Governing and Major Subsidiary Bodies. UNESCO.
Universiti Malaysia Sabah (2005) Red tide [Cited 25 March 2005]. Available from: http://www.ums.edu.my].