Online Battery Parameter And Open Circuit
Voltage (OCV) Estimation Using Recursive
Least Square (RLS)
Harmoko1, Dani Prasetyo2,Sigit Agung Widayat3, Lora Khaula Amifia4, Bobby Rian Dewangga5, Adha Imam Cahyadi6, Oyas Wahyunggoro7
Program Studi Teknik Elektro, Fakultas Teknik,
Universitas Gadjah Mada, Yogyakarta
1[email protected], 2[email protected],3[email protected], 4[email protected], 5[email protected], 6[email protected], 7[email protected]
Abstract
After decades, the battery usage has been widespread for many applications, especially in the field of Electric Vehicle (EV). The battery is a very important component in the EV. Because the battery as the primary power source replacement of the fossil fuel. Therefore, the condition of the batteries should be always in good condition. To prevent failure of the battery for battery management system (BMS) is needed. BMS is a system to regulate the use of the battery and protects the battery from the failure of the battery supply. Many factors can be monitored at BMS, one of which is a State of Charge (SOC). SOC determination is directly related to the estimated OCV (Open Circuit Voltage). The accuracy of the estimation algorithms depend on the accuracy of the model selection to describe the dynamic characteristics of the battery. This study begins with the selection of the right model (fig.1, fig.2, fig.3) for estimating OCV. Selection of appropriate model using RLS algorithm for estimate the battery terminal voltage. Parameter that reference for determining the selection of the model is the max, min, mean, RMSE, mean RMSE of the error. Later models have been used to estimate the OCV. The result based on this research shows that modeling with n = 1 is the best result to be used in model parameter estimation and OCV battery in term of the smaller max, min, mean, rmse error. This research also show us that RLS algorithm can be estimate the parameters of the batery, OCV (fig.4), and terminal voltage of the battery with an error less than 0.1%
Keywords : Battery Management System, Battery Modelling, Recursive Least Square
1. Introduction
A battery is a device that serves as an energy storage. Time after time, batteries have been vastly developed. Batteries were formerly only used for simple purposes. However, now the battery usage has expanded from use in mobile phones, electronic devices, portable computers and UPS to the automotive world as a source of energy driving the electric engine on the electric vehicle.
Techné Jurnal Ilmiah Elektroteknika Vol. 15 No. 1 April 2016 Hal 55 - 66
namely [3], SoC (State of Charge), SoH (State of Health) battery, and SoF (State of function) battery. To ensure the efficiency, the safe operation, and the lifetime of the battery, it requires battery management system that can monitor the state of the battery so that it can generate the data used to estimate the battery parameters.
2. Literature Review
2.1. Battery Modelling
Battery modelling is one of the important aspects before simulating Electric Vehicle and the development of BMS and this modelling represents the condition of the battery. Hence, the accuracy of the battery modelling selection will produce a good simulation result.
Batteries can be classified into 2 forms, namely the electrochemical and Equivalent Circuit Model (ECM) modelling. The electrochemical model is based on the chemical process happening in the battery. This battery model describes the process in detail so that this model is accurate to model the characteristics of the battery. [4]. The electrochemical model uses Partial Differential Equation (PDE) model to illustrate the processes in the battery cell. That process is interpreteded something that is easily measured as voltages and currents and make the microscopic relationship such as electrodes, batteries microscopic structure, the basic electrochemical cell, and the cell performance. In modelling electrochemical batteries, many unknown parameters that cause memory and computing needs are huge. Therefore, this model can not be used to estimate online at BMS [5].
The next development to negate thermodynamics and quantum effects on the battery is ECM (Equivalent Circuit Model). ECM modelling was first proposed by Hegeman [6], using PSpice software to simulate the nickel-cadmium batteries, lead-acid and alkaline. The model describes a battery as a capacitor, an ideal voltage source, and there is a resistor as the inside resistance and RC parallel as the polarization characteristics of the battery. The Rint model, the Thevenin model, and the DP model are the examples of such modelling. The explanation of those three models will be described in the figure below:
Figure1. NP battery modelling
Battery modellingis based on the analysis and structure of the Thevenin and Rint models which have been widely used before. Regarding with this, this paper introduces a model with a number of RC parallel circuit of n which is called an NP model, as seen in Fig.1. IL is the load current with a positive value on the discharge process and negatively charge process, UL is the terminal voltage, Uoc is the open circuit voltage, R0 is the resistance within, Ci is the polarization capacitance, Ri is the polarization resistance representing the characteristics of the transient response during the charge and discharge.
Online Battery Parameter And Open Circuit Voltage (OCV) Estimation Using Recursive Least Square (RLS) Harmoko, D. Prasetyo, S.A. Widayat, L.K. Amifia, B.R. Dewangga, A.I. Cahyadi, O. Wahyunggoro
( ) = ( ) − ( ) + 1 + + ⋯ + 1 + (1)
2.1.1. If n = 0
NP model is simplified into a Rintmodel, with k showing discretization step with the sampling interval T, k = 1,2,3,…
NP model is simplified into a Thevenin model that:
( ) − ( ) = − ( ) + 1 + (4)
with = − , transfer function ( ) on (4) so that :
( ) = ( ) = −( ) +1 ++ (5)
Bilinear transformation on (6) is used to discretize (5) and the result is (7).
=2 1 −1 + (6)
Equation (4) rewritten in (9) after discretized, where k=1,2,3….
Techné Jurnal Ilmiah Elektroteknika Vol. 15 No. 1 April 2016 Hal 55 - 66
In the online application, ( )and ( ) at the sampling using the period of constant, vector can be identified using the algorithms Recursive Least Square (RLS) algorithm, according to (11), and the model parameters can find the solution in (8)
= ( ) ( ) (11)
2.1.3. If n = 2
This model is also called as the Dual Polarization (DP) model because it has a number of parallel RC for 2 pieces. This model can be simplified as follows:
( ) = − ( ) + 1 + + 1 + (12)
After discretization process, then (12) will be (13),
( ) = (1 − − ) ( ) + ( − 1) + ( − 2) + ( ) + ( − 1) + ( − 2) (13) vector can be identified using the Recursive Least Square (RLS) algorithm, according to (14), and the model parameters can find the solution in (15). So,
= ( ) ( ) (14) dynamic system modelling compared to kalman filter and neural network algorithm [7, 8]. However, by modifying the algorithm, the RLS can be useful to perform optimization techniques properly. The main problems that exist in the algorithm cause the phenomenon of saturation. This weakness is caused by the exponential growth of the covariance matrix. In this paper, the RLS is based on the standard method using optimal forgetting factors to give smaller weights for the old data and may give greater weight to the new data. The parameter estimation is updated for each kT time and the previous estimation (k-1) T. The RLS algorithm with forgetting factorsis presented below.
= ( ) ( ) + ( ) (16)
( ) = ( ) − ( ) ( − 1) (17)
( ) = + ( − 1) ( )( ) ( − 1) ( ) (18)
Online Battery Parameter And Open Circuit Voltage (OCV) Estimation Using Recursive Least Square (RLS) Harmoko, D. Prasetyo, S.A. Widayat, L.K. Amifia, B.R. Dewangga, A.I. Cahyadi, O. Wahyunggoro
( ) = ( − 1) + ( ) ( ) (20)
3.1. Data Retrieval/ Data Collection
In this paper, after the manufacture of the BMS prototype is finished, the next step is the process of data collection which is done by using the BMS prototype that has been previously designed. In conducting the data collection, the results are the data in the form of current and voltage in real time and they will be processed to estimate the parameters and OCV using the RLS algorithm.
The data collection in this study uses the Arduino UNO 32 microcontroller as the center of control and the trigger switch, dummy Load GWINSTEK PL2000 series, the software Microsoft Excel and Matlab R2012b for estimating the battery parameter estimation and OCV. The process can be seen in Fig.2.
Figure 2. Flowchart of Data Collection Methodology
3.2. Evaluation Model
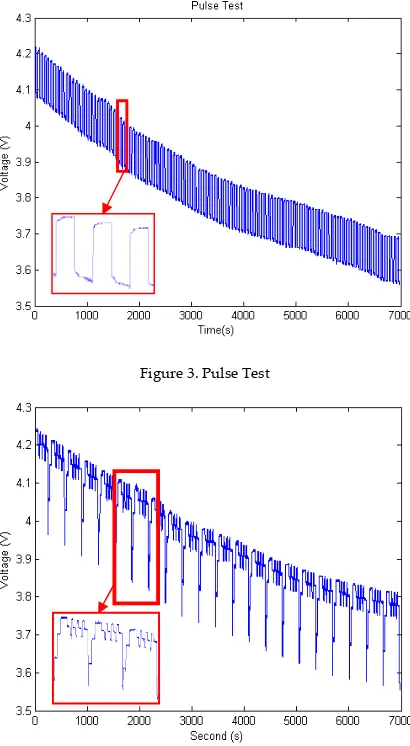
Battery modelling according to ECM is as follows, if n = 0 or also called the Rint model, n = 1 or also called the Thevenin model, and n = 2 or also called the DP model. In this paper, each model were tested using the RLS, with forgetting factors for estimating the battery terminal voltage online. The data used for the simulation are the pulse test data, as in the Fig.3.
The parameters that are used to determine which model has the best accuracy of the maximum error parameters, minimum error, MSE and RMSE (Variance) for the RLS algorithm to estimate the battery terminal voltage online.
3.3. Online Parameter Estimation and OCV
The next step is to estimate the parameters and OCV of the battery using the same algorithm. However, this test uses the different data from the previous testing. At this step, the data of various voltage are used. It can be seen in Fig.4.
After that, we validate the data by using the actual OCV data from the pulse test and also the curve fitting approach at some points to validate the obtained OCV estimation.
Techné Jurnal Ilmiah Elektroteknika Vol. 15 No. 1 April 2016 Hal 55 - 66
Figure 3. Pulse Test
Figure 4. Varying Voltage
4.
Result and Analysis
4.1. Evaluation Model
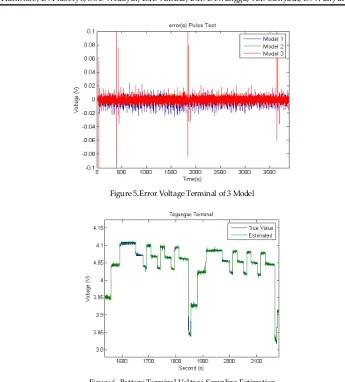
To determine how many RC parallels is done by making a comparison of errors between the terminal voltage estimation of the three models and statistics calculated based on the error. The result can be seen in Table 1 for NP model with n = 0,1,2. The comparison of the error curves among the three models can be seen in Fig.5. And Fig.6 is the sampling of the battery terminal voltage estimation.
Table1. Statistics Estimation Error Voltage Battery Terminal Model Minimum/Maximum MSE Variances
Online Battery Parameter And Open Circuit Voltage (OCV) Estimation Using Recursive Least Square (RLS) Harmoko, D. Prasetyo, S.A. Widayat, L.K. Amifia, B.R. Dewangga, A.I. Cahyadi, O. Wahyunggoro
Figure 5.Error Voltage Terminal of 3 Model
Figure 6. Battery Terminal Voltage Sampling Estimation
It can be seen that the MSE of the terminal voltage estimation is maximum for n = 0, and gradually decreased to n = 1, then slightly increased at n = 2. This indicates that the battery voltage on the relaxation effect should not be ignored so that we cannot choose n = 0. The MSE model also indicates the accuracy level of a measurement - the smaller the MSE value, the higher the accuracy level of a measurement. Then we can see that from the variance between n = 1 and n = 2. The n = 2 model has the smaller value than the n = 1 model. This variance indicates the precision level of estimation precision, thus leading to convergent. So the model with n = 1 is the best model for the battery modelling.
4.2. Online Parameter Estimation and OCV
4.2.1. Pulse Test
Techné Jurnal Ilmiah Elektroteknika Vol. 15 No. 1 April 2016 Hal 55 - 66
Figure 7. Comparison of Estimation Results Against OCV Voltage Terminal
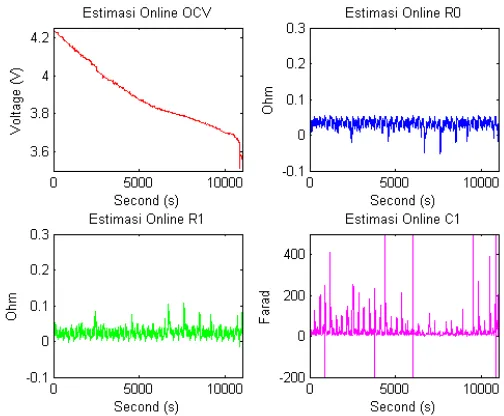
Figure 8. Estimation of OCV R0, R1, C1 Time(s)
Online Battery Parameter And Open Circuit Voltage (OCV) Estimation Using Recursive Least Square (RLS) Harmoko, D. Prasetyo, S.A. Widayat, L.K. Amifia, B.R. Dewangga, A.I. Cahyadi, O. Wahyunggoro
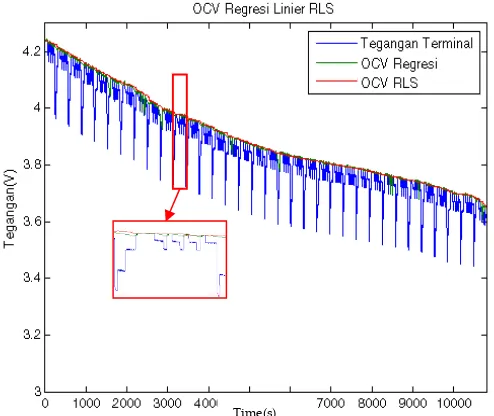
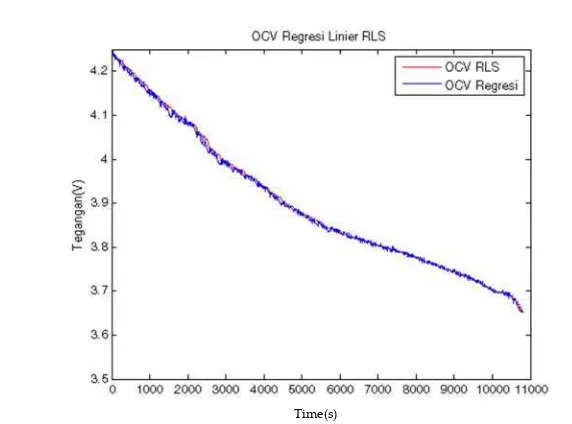
Figure 10. The Result Comparison of the OCV Estimation using the RLS and Linear Regression Figure 7 and Figure 9 show the result comparison of the estimation and the OCV estimation scale toward the terminal voltage using the RLS method with the linear regression method. Figure 8 shows the OCV estimation results, R0, R1 and C1. We can see that the estimation results indicate that the parameters cannot converge at one point. Figure 10 is the comparison of the OCV estimation result by using the RLS method and the linear regression with the average error of 0.0786%.
4.2.2. Various Voltage
In this test, the data were obtained from the discharge of the battery terminal voltage and current with various voltage system. This various voltage is done for 33 times as we can see in Fig.11. After that, the estimation was done by using the RLS method for estimating parameters and OCV of the battery.
Figure 11. Comparison of Results The estimated OCV Against Voltage Terminal
Time(s)
Techné Jurnal Ilmiah Elektroteknika Vol. 15 No. 1 April 2016 Hal 55 - 66
Figure 11 and Fig 13 are the result comparison of the estimation and the OCV estimation scale toward the terminal voltage by using the RLS method with the linear regression method. Figure 12 is the OCV estimation result, R0, R1 and C1. We can see that the estimation results indicate that the parameters cannot converge at one point. Figure 14 is the comparison of the OCV estimation by using the RLS method and the linear regression with the average error of 0.0855%.
Figure 12. Estimation of OCV R0, R1, C1
Figure 13. Comparative Estimates OCV Against Voltage Terminal
Online Battery Parameter And Open Circuit Voltage (OCV) Estimation Using Recursive Least Square (RLS) Harmoko, D. Prasetyo, S.A. Widayat, L.K. Amifia, B.R. Dewangga, A.I. Cahyadi, O. Wahyunggoro
Figure 14. Comparison of Results The estimated OCV using RLS and Linear Regression
5.
Conclusion
According to the testing, the observation, and the analysis of the research results obtained in this paper, the RLS method is successfully implemented for estimating OCV. The parameter values of the battery change toward time so the specific value for battery parametes cannot be inferred. The best modelling to describe the dynamic characteristics of the battery is the model 2 with n = 1. The RLS algorithm with n = 1 modelling is able to estimate the battery terminal voltage with the average error of 1.67 mv disharge testing, for testing the pulse test mv 2.78, and 2.64 mv for testing the various voltage. The RLS algorithm can successfully estimate the OCV using the pulse test validation with an error of 0.0786%, and the validation of the various voltage of 0.085%.
6.
Acknowledgements
This work was supported by Battery Management System Research of Instrumentation and Control Laboratory in Gadjah Mada University.
Reference
[1] H. Wu, S. Yuan, X. Zhang, C. Yin and X. Ma, “Model parameter estimation approach based on incremental analysis for lithium-ion batteries without using open circuit voltage,” Journal of Power Sources, vol. 287, pp. 108-118, 2015.
[2] D. DW, B. V.S. and A. B. , “Electrochemical modelling of lithium polymer batteries,”
Journal of Power Sources, vol. 110, pp. 310-320, 2002.
[3] C. Fleisher, W. Wladislaw, H. Martin Heyn and D. Uwe Sauer, “On-line adaptive battery impedance parameter and state estimation considering physical principles in reduced order equivalent circuit battery models Part 1. Requirements, critical review of methods and modelling,” Journal of Power Sources, vol. 260, pp. 276-291, 2014. [4] M. Jongerden and B. Haverkort, “Battery Modelling,” [Online]. Available:
Techné Jurnal Ilmiah Elektroteknika Vol. 15 No. 1 April 2016 Hal 55 - 66
http://wwwhome.cs.utwente.nl/~jongerdenmr/. [Accessed 2 June 2015].
[5] H. He, R. Xiong, H. Guo and S. Li, “Comparison paper on the battery models used for the energy management of batteries in electric vehicles,” Energy Conversion and Management, vol. 64, p. 113–121, 2012.
[6] H. S. C., “imple PSpice models let you simulate common battery types,” Electronic Design News, vol. 38, p. 117 – 129, 1993.
[7] G. Plett, “Extended Kalman filtering for battery management systems of LiPBbased,” J Power Sources, vol. 134, no. 2, pp. 277-292, 2004.