UNIVERSITI TEKNIKAL MALAYSIA MELAKA
STUDY OF THE EFFECT OF TEMPERATURE AND RELATIVE
HUMIDITY ON THE MEASUREMENT VARIANCE CONDUCTED
IN THE METROLOGY LAB, FKP
This report submitted in accordance with requirement of the Universiti Teknikal Malaysia Melaka (UTeM) for the Bachelor Degree of Manufacturing Engineering
(Manufacturing Process) with Honours.
By
AMER ADLI BIN MOHD DZAINUDIN
UTeM Library (Pind.1/2005)
SULIT
TERHAD
TIDAK TERHAD
(Mengandungi maklumat yang berdarjah keselamatan atau kepentingan Malaysia yang termaktub di dalam AKTA RAHSIA RASMI 1972)
* Tesis dimaksudkan sebagai tesis bagi Ijazah Doktor Falsafah dan Sarjana secara penyelidikan, atau disertasi bagi pengajian secara kerja kursus dan penyelidikan, atau Laporan Projek Sarjana Muda (PSM). ** Jika tesis ini SULIT atau TERHAD, sila lampirkan surat daripada pihak berkuasa/organisasi berkenaan dengan menyatakan sekali sebab dan tempoh tesis ini perlu dikelaskan sebagai SULIT atau TERHAD.
BORANG PENGESAHAN STATUS TESIS* UNIVERSITI TEKNIKAL MALAYSIA MELAKA
JUDUL: Study of the Effect of Temperature and Relative Humidity on the Measurement Variance Conducted in Metrology Lab, FKP
SESI PENGAJIAN: 2009-2010
Saya _____________________________________________________________________ mengaku membenarkan tesis (PSM/Sarjana/Doktor Falsafah) ini disimpan di
Perpustakaan Universiti Teknikal Malaysia Melaka (UTeM) dengan syarat-syarat kegunaan seperti berikut:
1. Tesis adalah hak milik Universiti Teknikal Malaysia Melaka.
2. Perpustakaan Universiti Teknikal Malaysia Melaka dibenarkan membuat salinan untuk tujuan pengajian sahaja.
3. Perpustakaan dibenarkan membuat salinan tesis ini sebagai bahan pertukaran antara institusi pengajian tinggi.
4. **Sila tandakan (√)
AMER ADLI BIN MOHD DZAINUDIN
√
DECLARATION
I hereby declare that this report entitled “STUDY OF THE EFFECT OF TEMPERATURE AND RELATIVE HUMIDITY ON THE MEASUREMENT
VARIANCE CONDUCTED IN THE METROLOGY LAB, FKP” is the result of my
own research except as cited in the references.
Signature :
Author’s name : Amer Adli bin Mohd Dzainudin
APPROVAL
This report is submitted to the Faculty of Manufacturing Engineering of UTem as a partial fulfillment of the requirements for the degree of Bachelor of Manufacturing Engineering (Manufacturing Process). The members of the supervisory committee are as follow:
Mohd Fairuz Bin Dimin (PSM Supervisor)
i
ABSTRACT
ii
ABSTRAK
iii
TABLE OF CONTENT
Abstract i
Abstrak ii
Table of Content iii
List of Tables vii
List of Figures ix
List of Abbreviations xi
1. INTRODUCTION 1
1.1 Introduction 1
1.2 Problem Statement 11
1.3 Objective of the Project 11
1.4 Scope of the Project 11
2. LITERATURE REVIEW 12
2.1 Introduction 12
2.2 Classifying Sources of Uncertainty 13
2.3 Thermal Expansion 15
iv
3. METHODOLOGY 23
3.1 Introduction 23
3.2 Design of Experiment 25
3.2.1 Select Problem 25
3.2.2 Determining Dependent Variables 25
3.2.3 Determining Independent Variables 26
3.2.4 Determining the Number of Levels of Independent Variables 26
3.2.5 Determining the Possible Combinations 27
3.2.6 Determining the Number of Observations 27
3.2.7 Data Verification 28
3.3 Methodology 29
3.3.1 Finding Condition 29
3.3.2 Measuring Instrument 32
3.3.3 Data Analysis 33
3.3.4 Expected Results 35
4. RESULT 36
4.1 Introduction 36
4.2 Result 39
4.3 Analysis 40
v
4.3.2 Humidity Analysis 47
5. DISCUSSION 53
5.1 Introduction 53
5.2 Observation Analysis 54
5.3 Data Analysis 55
5.3.1 Correlation Analysis 55
5.3.2 Simple Linear Regression Analysis 57
5.3.2.1 Temperature Linear Regression Analysis 58 5.3.2.2 Humidity Linear Regression Analysis 59
5.4 Response Time 61
6. CONCLUSION 62
6.1 Conclusion 62
REFERENCES 64
APPENDICES
vi
Appendix D - Pcychometric Chart Details
Appendix E - Raw Data Table
vii
LIST OF TABLES
Table 2.1 Uncertainty sources in NIST dimensional calibrations 14
Table 3.1 Table of Data Collected 33
Table 4.1 Result of measurement in day 1 39
Table 4.2 Value of r and their strength 41
Table 4.3 Analysis of Correlations between Standard Deviation and
Temperature (near air-cond) 42
Table 4.4 Analysis of Correlations between Standard Deviation and
Temperature (far from air-cond) 43
Table 4.5 Analysis of Correlations between Standard Deviation and
Temperature (Outside Metrology Lab) 44
Table 4.6 Analysis of Correlations between Standard Deviation and
Temperature (all location) 45
Table 4.7 Analysis of Correlations between Standard Deviation and
Humidity (near an air-cond) 48
Table 4.8 Analysis of Correlations between Standard Deviation and Humidity (far from air-cond) 49 Table 4.9 Analysis of Correlations between Standard Deviation and
viii
Table 4.10 Analysis of Correlations between Standard Deviation and
Humidity (all location) 51
ix
LIST OF FIGURES
Figure 1.1 Amount of water in air at 100% relative humidity 7
Figure 3.1 Method Flow chart 24
Figure 3.2 Four main stages for Methodology 29
Figure 3.3 A sling psychrometer 30
Figure 3.4 The interior of a Stevenson showing motorized psychrometer 30
Figure 3.5 Flow of work in finding condition 31
Figure 3.6 Flow of work in preparing measuring instrument 32
Figure 3.7 Flow of work in measurement process 34
Figure 4.1 Near air-cond location 37
Figure 4.2 Far from air-cond location 37
Figure 4.3 Outside lab location 38
Figure 4.4 Graph Standard Deviation for near air-cond data versus
Temperature 42
Figure 4.5 Graph Standard Deviation for far from air-cond data versus
Temperature 43
Figure 4.6 Graph Standard Deviation for outside Metrology Lab data versus
x
Figure 4.7 Graph Standard Deviation data for all location versus
Temperature 45
Figure 4.8 Graph Standard Deviation data for near an air-cond versus
Humidity 48
Figure 4.9 Graph Standard Deviation for far from air-cond data versus
Humidity 49
Figure 4.10 Graph Standard Deviation for outside Metrology Lab data versus
Humidity 50
xi
LIST OF ABBREVIATIONS
UTEM - Universiti Teknikal Malaysia FKP - Fakulti Kejuruteraan Pembuatan
VIM - The International Vocabulary of Basic and General Terms in Metrology
NIST - National Institute of Standards Technology CTE - Coefficient of Thermal Expansion
U.S - United States of America
B.S - British Standard
SPSS - Statistical Package for the Social Sciences ANOVA - Analysis of Variables
NBS - National Bureau of Statistic
ISO - International Organization for Standardization
DC - Direct current
CMM - Coordinate measuring machine
FE - Finite element
NMR - Nuclear Magnetic Resonance
1
CHAPTER 1
INTRODUCTION
1.1 Introduction
The International Vocabulary of Basic and General Terms in Metrology (VIM) define measurement uncertainties as a parameter, associated with the result of measurement that characterizes the dispersion of the values that could reasonably be attributed to the measurand. It also defines measurand as a particular quantity subject to measurement. In other words, uncertainty is a quantitative term that represents a range of values wherein the true value is lie. Uncertainty and confidence is determined using statistical technique. In practice, the uncertainties of the result may arise from many possible sources such as reference standards and measurement equipment, measurement setup, measurement process and environmental conditions: temperature; relative humidity.
2
temperature to make any sense. For a solid, this energy is found in the vibrations of its atoms about their equilibrium positions. In an ideal monatomic gas, energy is found in the translational motions of the particles; with molecular gases, vibrational and rotational motions also provide thermodynamic degrees of freedom.
Molecules, such as O2, have more degrees of freedom than single atoms: they can have rotational and vibrational motions as well as translational motion. An increase in temperature will cause the average translational energy to increase. It will also cause the energy associated with vibrational and rotational modes to increase. Thus a diatomic gas, with extra degrees of freedom rotation and vibration, will require a higher energy input to change the temperature by a certain amount, i.e. it will have a higher heat capacity than a monatomic gas.
The process of cooling involves removing energy from a system. When there is no more energy able to be removed, the system is said to be at absolute zero, which is the point on the thermodynamic (absolute) temperature scale where all kinetic motion in the
particles comprising matter ceases and they are at complete rest in the “classic” (non
-quantum mechanical) sense. By definition, absolute zero is a temperature of precisely 0 kelvins (−273.15 °C or −459.68 °F).
The formal properties of temperature follow from its mathematical definition (see below for the zeroth law definition and the second law definition) and are studied in thermodynamics and statistical mechanics. Contrary to other thermodynamic quantities such as entropy and heat, whose microscopic definitions are valid even far away from thermodynamic equilibrium, temperature being an average energy per particle can only be defined at thermodynamic equilibrium, or at least local thermodynamic equilibrium. As a system receives heat, its temperature rises; similarly, a loss of heat from the system tends to decrease its temperature.
3
equilibrium. This heat transfer may occur via conduction, convection or radiation or combinations of them (see heat for additional discussion of the various mechanisms of heat transfer) and some ions may vary. Temperature is also related to the amount of internal energy and enthalpy of a system: the higher the temperature of a system, the higher its internal energy and enthalpy. Temperature is an intensive property of a system, meaning that it does not depend on the system size, the amount or type of material in the system, the same as for the pressure and density. By contrast, mass, volume, and entropy are extensive properties, and depend on the amount of material in the system.
Humidity is the amount of water vapor in the air. In daily language the term "humidity" is normally taken to mean relative humidity. Relative humidity is defined as the ratio of the partial pressure of water vapor in a parcel of air to the saturated vapor pressure of water vapor at a prescribed temperature. Humidity may also be expressed as absolute humidity and specific humidity. Relative humidity is an important metric used in forecasting weather. Humidity indicates the likelihood of precipitation, dew, or fog. High humidity makes people feel hotter outside in the summer because it reduces the effectiveness of sweating to cool the body by reducing the evaporation of perspiration from the skin. This effect is calculated in a heat index table.
Absolute humidity is the quantity of water in a particular volume of air. The most common units are grams per cubic meter, although any mass unit and any volume unit could be used. A pound per cubic foot is common in the U.S. and occasionally even other units mixing the Imperial and metric systems are used.
4
Absolute humidity ranges from 0 grams per cubic meter in dry air to 30 grams per cubic meter (0.03 ounce per cubic foot) when the vapor is saturated at 30 °C. (See also Absolute Humidity table)
The absolute humidity changes as air pressure changes. This is very inconvenient for chemical engineering calculations, e.g. for dryers, where temperature can vary considerably. As a result, absolute humidity is generally defined in chemical engineering as mass of water vapor per unit mass of dry air, also known as the mass mixing ratio (see below), which is much more rigorous for heat and mass balance calculations. Mass of water per unit volume as in the equation above would then be defined as volumetric humidity. Because of the potential confusion, British Standard BS 1339 (revised 2002) suggests avoiding the term "absolute humidity". Units should always be carefully checked. Most humidity charts are given in g/kg or kg/kg, but any mass units may be used. The engineering of physical and thermodynamic properties of gas-vapor mixtures is named Psychometrics
Mixing or humidity ratio is expressed as a ratio of water vapor mass, mw, per kilogram of dry air, md, at a given pressure. The colloquial term moisture content is also used instead of mixing/humidity ratio. Humidity ratio is a standard axis on psychometrics charts, and is a useful parameter in psychometrics calculations because it does not change with temperature except when the air cools below dew point.
That ratio can be given as:
5
Where
δ = 0.62197 is the ratio of molecular weights of water vapor and dry air
pw = partial pressure of water vapor in moist air pa = atmospheric pressure of moist air
Technically speaking, this is a dimensionless quantity as it is the mass of water vapor to the mass of dry air. So it is expressed as Kg/Kg. However, the mass of water vapor is much less than the value of the mass of dry air and most commonly meteorologists use g/Kg which is 10 − 3 Kg/Kg.
Relative humidity is defined as the ratio of the partial pressure of water vapor (in a gaseous mixture of air and water vapor) to the saturated vapor pressure of water at a given temperature. Relative humidity is expressed as a percentage and is calculated in the following manner:
Where:
- is the partial pressure of water vapor in the gas mixture;
- is the saturation vapor pressure of water at the temperature of the gas mixture - is the relative humidity of the gas mixture being considered.
6
Specific humidity is the ratio of water vapor to air (including water vapor and dry air) in a particular mass. Specific humidity ratio is expressed as a ratio of kilograms of water vapor, mw, per kilogram of air (including water vapor), mt.
That ratio can be shown as:
Specific humidity is related to mixing ratio (and vice versa) by:
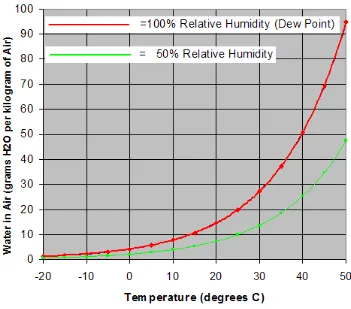
7
Figure 1.1: Amount of water in air at 100% relative humidity across a range of temperature
8
(case selection, file reshaping, creating derived data) and data documentation (a metadata dictionary is stored in the datafile) are features of the base software.
Statistics included in the base software:
(a) Descriptive statistics: Cross tabulation, Frequencies, Descriptives, Explore, Descriptive Ratio Statistics
(b) Bivariate statistics: Means, t-test, ANOVA, Correlation (bivariate, partial, distances), Nonparametric tests
(c) Prediction for numerical outcomes: Linear regression
(d) Prediction for identifying groups: Factor analysis, cluster analysis (two-step, K-means, hierarchical), Discriminant
9
SPSS places constraints on internal file structure, data types, data processing and matching files, which together considerably simplify programming. SPSS datasets have a 2-dimensional table structure where the rows typically represent cases (such as individuals or households) and the columns represent measurements (such as age, sex or household income). Only 2 data types are defined: numeric and text (or "string"). All data processing occurs sequentially case-by-case through the file. Files can be matched one-to-one and one-to-many, but not many-to-many.
The graphical user interface has two views which can be toggled by clicking on one of the two tabs in the bottom left of the SPSS window. The 'Data View' shows a spreadsheet view of the cases (rows) and variables (columns). Unlike spreadsheets, the data cells can only contain numbers or text and formulas cannot be stored in these cells. The 'Variable View' displays the metadata dictionary where each row represents a computer-assisted personal interviewing, by scanning and using optical character recognition and optical mark recognition software, or by direct capture from online questionnaires. These datasets are then read into SPSS.
SPSS can read and write data from ASCII text files (including hierarchical files), other statistics packages, spreadsheets and databases. SPSS can read and write to external relational database tables via ODBC and SQL.