i
IDENTIFICATION OF CAUSES OF VARATION IN THE SEMICONDUCTOR MANUFACTURING PROCESSES BY STATISTICAL ANALYSIS : A SIX SIGMA
APPROACH
GUNASEGARAN A/L VIJAYA KUMARAN
This report is submitted in particular fulfilment of the requirements for the award of Bachelor of Electronic Engineering (Industial Engineering) With Honours
Faculty of Electronic and Computer Engineering Universiti Teknikal Malaysia Melaka
ii
UNIVERSTI TEKNIKAL MALAYSIA MELAKA
FAKULTI KEJURUTERAAN ELEKTRONIK DAN KEJURUTERAAN KOMPUTER BORANG PENGESAHAN STATUS LAPORAN
PROJEK SARJANA MUDA II
Tajuk Projek :
IDENTIFICATION OF CAUSES OF VARATION IN THE SEMICONDUCTOR MANUFACTURING PROCESSES BY STATISTICAL ANALYSIS : A SIX SIGMA APPROACH Sesi
Pengajian : 2009/2010
Saya GUNASEGARAN A/L VIJAYA KUMARAN
mengaku membenarkan Laporan Projek Sarjana Muda ini disimpan di Perpustakaan dengan syarat-syarat kegunaan seperti berikut:
1. Laporan adalah hakmilik Universiti Teknikal Malaysia Melaka.
2. Perpustakaan dibenarkan membuat salinan untuk tujuan pengajian sahaja.
3. Perpustakaan dibenarkan membuat salinan laporan ini sebagai bahan pertukaran antara institusi
pengajian tinggi.
4. Sila tandakan ( √ ) :
SULIT*
(Mengandungi maklumat yang berdarjah keselamatan atau kepentingan Malaysia seperti yang termaktub di dalam AKTA RAHSIA RASMI 1972)
TERHAD*
(Mengandungi maklumat terhad yang telah ditentukan oleh organisasi/badan di mana penyelidikan dijalankan)
TIDAK TERHAD
Disahkan oleh:
__________________________ ___________________________________
(TANDATANGAN PENULIS) (COP DAN TANDATANGAN PENYELIA)
Alamat Tetap: 37, Tasek Mutiara7, Taman Tasek Mutiara, 31400, Ipoh, Perak.
iii
“I declare that this project report is the result of my own research except for quotes as cited in the references.”
Signature : ………..
Name : GUNASEGARAN A/L VIJAYA KUMARAN
iv
“I hereby declare that I have read this project report and in my opinion this project report is sufficient in terms of scope and quality for the award of Bachelor of Electronic
Engineering (Industrial Engineering) With Honours.”
Signature : ………
Name of Supervisor : Miss. FARAH SHAHNAZ FEROZ
v
Specially..
To my beloved parents
To my kind brothers and sisters
And not forgetting to all friends
For their
vi
ACKNOWLEDGEMENTS
vii
ABSTRACT
viii
ABSTRAK
ix
x
TABLE OF CONTENT
CHAPTER TITLE PAGE
PROJECT TITLE i
CONFIRMATION REPORT STATUS ii
DECLARATION iii
SUPERVISOR CONFIRMATION iv
DEDICATION v
ACKNOWLEDGEMENT vi
ABSTRACT vii
ABSTRAK viii
TABLE OF CONTENT x
LIST OF TABLE xiv
LIST OF FIGURE xv
LIST OF ABBREVIATION xvii
LIST OF APPENDIX xviii
xi
1.1 Project background 2
1.2 Objective 3
1.3 Problem statement 4
1.4 Scope 4
1.5 Methodology project 5
1.6 Outline of PSM report 6
II LITERATURE REVIEW 8
2.1 Literature review overview 8
2.2 Comparison six sigma with three sigma and other sigma level
8
2.3 Quality test for wire bonding 10
2.3.1 Wire Pull Tes 12
2.3.2 Ball shear testing 14
2.4 Six Sigma in other services 14
2.5 Statistical process control (SPC) 16
2.6 Control chart 18
2.7 Variation 20
2.7.1 Common cause variation 20 2.7.2 Special cause variation 21
xii
Standard deviation, σ, Control Limit of control chart, (UCL and LCL) 22
2.9 Process Capability 23
2.9.1 Capability and Performance Indices 24
2.9.2 Formula to calculate the Cp, Cpk , Pp, Ppk. 25 2.10 Process Capability pattern recognition 28
III METHODOLOGY 30
3.1 Methodology Overview 30
3.2 Six sigma strategy 31
3.3 Produce the variables chart for subgroup via
Control Chart 33
3.4 Produce the variables chart for individual via
Control Chart 36
3.5 Produce the Probability Plot graph 36 3.6 Producing the process capability graph 38
IV RESULT AND DISCUSSION 40
xiii
4.2 Case 1:External test of IC 40
4.3 Discussion the result of external test IC 46
4.4 Case 2:Internal test IC 48
4.4.1Wire pull test 48
4.2-Ball shear test 49
4.3-Ball thickness consistency 50
4.4.4-Loop height consistency 51
4.4.5-Ball placement consistency 52 4.5 Discussion of the result of external IC test 63
V CONCLUSION AND RECOMMENDATION 66
5.1 Conclusion 66
5.2 Recommendation 67
VI REFERENCE 69
xiv
LIST OF TABLE
NO TITLE PAGE
2.1 DPMO at sigma levels 9
2.2 Six Sigma in service organizations 15
2.3 CSFs, CTQs, KPIs AND TOOLS ACROSS SERVICE ORGANIZATIONS
16
2.4 The relationship Cp, Cpk, Pp, Ppk 25
2.5 The Cp and Cpk in Process Centred and Process off-centre by 1.5σ
27
xv
LIST OF FIGURE
NO TITLE PAGE
1.1 Industry production theories 3
1.2 Project flowchart 6
2.11 Ball bond shape (Note the size of the ball) 11 2.12 Typical gold bond wire loop from the chip to the
leadframe
11
2.13 Bond pull test 12
2.14 Ball lift and wedge (weld) lift failure 12
2.15 Pull test failure modes 13
2.16 Neck break, Midspan break and Heel break 13
2.17 Weld lift 13
2.18 Ball shear test 14
2.19 Control chart patterns 19
2.20 Common cause of variations 21
2.21 Special causes of variations 22
xvi
3.2 Relationship DMADD, DMAIC, DMADV 31
3.3 DMAIC flow chart 32
4.1 Structure of an IC product 40
4.2 Xbar-R Chart for standoff 44
4.3 Xbar-S Chart for standoff 44
4.4 Pb plot for standoff 45
4.5 Xbar-R Chart for spacing 45
4.6 Xbar-S Chart for spacing 46
4.7 Pb plot for spacing 46
xvii
LIST OF ABBREVIATION
DPMO - defects per million opportunities
IC - Integrated Circuit
Cp - Process Capability
PSM - Projek Sarjana Muda
SPC - Statistical Process Control
DFSS - Design for Six Sigma
DMAIC - define, measure, analyze, improve, and control
USL - Upper Specification Limit
LSL - Lower Specification Limit
UCL - Upper Control Limit
LCL - Lower Control Limit
Cpk - Critical Process index
Pp - Process Performance
Ppk - Process Performance Index
xviii
LIST OF APPENDIX
NO TITLE PAGE
1
CHAPTER 1
INTRODUCTION
There is a letter in Greek, σ which is called as sigma used by statisticians to represent the standard deviation for a set of data [16]. The standard deviation is a value which indicated that the total number of individual data deviated from the mean value. This means that an estimation value of the variation in a set of data measurement is provides by the standard deviation. Currently, the sigma levels from one to six have been applied in different industries all over the world. However, the six sigma level is the best used in several manufacturing and non-manufacturing industry which is confirmed by Motorola. Six sigma is a quality-focused program that utilizes worker teams to accomplish projects aimed at improving an organization’s operational performance. The Six Sigma has a vision in term of quality which equates with only 3.4 defects per million opportunities for each product or service transaction and it strives for perfection.
2
its application is gradually following up in other services such as call centers, utilities and publicservices.
1.1-Project background
The Six Sigma concept was first established in the 1980s by Motorola [20]. Motorola has generated the idea which was related to the discussion of quality from measurement of quality level in hundred change into a discussion of parts-per-million or even parts-per-billion. Based on the idea from Motorola, the old ideas about "acceptable quality levels" could no longer be tolerated as the modern technology become more complex. Hence, the perfect quality level was required in modern business.
A good quality services can cause the growth of economies which influence the increase of important services for the developed and developing nations. Therefore, interest in applying the Six Sigma concept is growing in manufacturing and services. Traditionally, the application of Six Sigma was not implemented in majority of manufacturing organization. With the implementation of Six Sigma, many service organizations have improving in terms of success rate and customer satisfaction. Most of the service organizations are Citibank, Bank of America, American Express, Caterpillar and Baxter Healthcare in US and Europe [6],[7],[8],[9],[15].
3
Figure 1.1:Industry production theories
The main objective of this project is to identify and find a possible solution to reduce the variation in semiconductor manufacturing production of IC (Integrated Circuit). Once the variation has identified, the problem can be solved effectively.
1.2-Objective
The objective in this project is:
1. To study and explain the benefits of the implementation of Six Sigma in the semiconductor industry to gain competitive advantage.
2. To identify production problems related to shifts and variations through control charts and Process Capability Index (Cp) analyses.
3. To identify possible solutions in reducing the defective IC in a semiconductor industry.
4. To propose a method using the Six Sigma approach to reduce variation in the production process.
5. To suggest possible ways in improving business performance and process management in semiconductor industry.
Output Production
4
1.3-Problem statement
Today, most of the highly innovative semiconductor industry companies such as Motorola, Toshiba and Agilent Tech have to proceed with high volume production before their process achieve to maturity. The high volume of production is for the company to maintain their reputation and compete with other semiconductor industry. Beside that, the customer product also must have good quality. Therefore, most of the well known companies faced with the problem of high variation in a process when the yielding of output product is increased. Due to this problem, quality of product will also decrease. When product quality is not within the customer specification, other process will affect simultaneously. An increase in variation will cause the increment of expansion in production cost. In addition, time spent for rework for defect products lead a lot of problem and chaos in the production line. This entire problem is required to be overcome to maintain the reputations of the company.
1.4-Scope
In this project, there are three assumptions are made from the data collected:
• Independence of the data.
• Normal-Gaussian distribution also called the Gaussian distribution is an
important family of continuous probability distributions, applicable in many fields. Each member of the family may be defined by two parameters, location and scale: the mean ("average", ) and variance (standard deviation squared) σ2, respectively.
• The data is randomly distributed.
5
Secondly, data collection is confidential and it is handled by the company staff. I have no contact when the data is collected and how data collection is handled. Human error that occurs when taking the data also affects the analysis.
To analyze the data, Six Sigma method used with the help of Statistical Software such as MINTAB 14.
1.5 -Methodology project
6
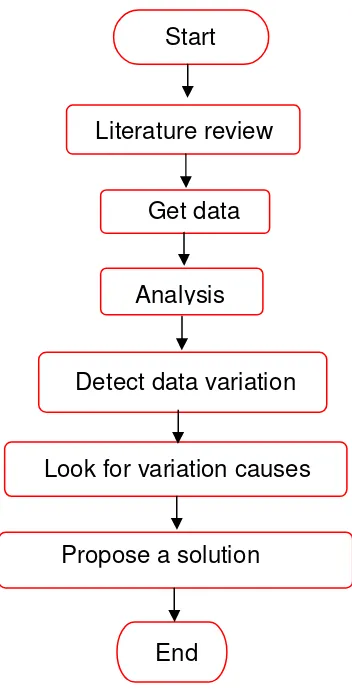
Figure 1.2: Project flowchart
In this project, I propose a method using Six Sigma approach to reduce variation in the production process. This would thus eliminate rework and customer callbacks caused by defects, leading to lower production costs and improve customer’s satisfaction.
1.6-Outline of PSM report
This PSM report consists of five chapters. The first chapter discusses the background, objectives, problem statement, scope and methodology of this project. Chapter two discusses the theory of Six Sigma and includes the literature reviews that have been done. In addition, it also discusses the process flow of producing an IC and
Start
Literature review
Get data
Analysis
Detect data variation
Look for variation causes
Propose a solution