APPROACH
MOHD HISHAMUDDIN BIN MOHAMAD DISA
BORANG PENGESAHAN STATUS LAPORAN
PROJEK SARJANA MUDA II
Tajuk Projek :
IDENTIFICATION OF CAUSES OF VARIATION IN THE SEMICONDUCTOR MANUFACTURING PROCESSES BY GRAPHICAL ANALYSIS: A SIX SIGMA APPROACH Sesi
Pengajian : 2008/2009
Saya MOHD HISHAMUDDIN BIN MOHAMAD DISA
(HURUF BESAR)
mengaku membenarkan Laporan Projek Sarjana Muda ini disimpan di Perpustakaan dengan syarat-syarat kegunaan seperti berikut:
1. Laporan adalah hakmilik Universiti Teknikal Malaysia Melaka.
2. Perpustakaan dibenarkan membuat salinan untuk tujuan pengajian sahaja.
3. Perpustakaan dibenarkan membuat salinan laporan ini sebagai bahan pertukaran antara institusi
pengajian tinggi.
4. Sila tandakan ( √ ) :
SULIT*
(Mengandungi maklumat yang berdarjah keselamatan atau kepentingan Malaysia seperti yang termaktub di dalam AKTA RAHSIA RASMI 1972)
TERHAD* (Mengandungi maklumat terhad yang telah ditentukan oleh
organisasi/badan di mana penyelidikan dijalankan)
TIDAK TERHAD
Disahkan oleh:
__________________________ ___________________________________
(TANDATANGAN PENULIS) (COP DAN TANDATANGAN PENYELIA)
Alamat Tetap: NO 20-A
KAMPUNG TEKAH BARU, 31300 KG KEPAYANG, PERAK
“I hereby declare that this is report is the result of my own work except for quotes as citied in the references.”
Signature :………
“I hereby declare that I have read this report and in my opinion this report is sufficient in terms of scope and quality for the award of Bachelor of Electronic Engineering
(Industrial Electronics) With Honours.”
Signature :………..
Supervisor’s Name : Miss. FARAH SHAHNAZ FEROZ
ACKNOWLEDGEMENT
ABSTRACT
ABSTRAK
TABLE OF CONTENTS
CHAPTER CONTENT PAGE
PROJECT TITLE
BORANG PENGESAHAN STATUS LAPORAN
2.1 Literature review overview 9 2.1.1 Six Sigma vs. Three Sigma 9
2.1.2 6 Sigma vs. Control Charts based on
Three Sigma limits 11 2.1.3
What is Six Sigma and 1.5 shift?
The original concepts and Theories 13
2.1.4 Six Sigma for the Industry 14
Possible cause of variations and solution to
the problems 20 2.4
Controls Chart using Six Sigma 20
2.4.1 A study on control chart pattern
recognition systems 22
2.4.2 The evolution of control chart
pattern recognition 24
2.5 Cp Analysis using Six Sigma 26
2.5.1 Process Capability and product design 27
3 METHODOLOGY 32
3.1 Project Overview 32
3.2 Theory of project. 35
3.3 Six Sigma 35
3.4 Control chart 37
3.5 Statistical Process Control tools 39
3.6 Capability Index (Cp) 40
3.7 Overall Yield per Specification 42 3.8 Implementation Six Sigma in Semiconductor
Industry. 43
4 PRELIMINARY RESLUT AND DISCUSSION 45
4.1 Result overview 45 4.5.3 Vertical dimension for Y1 57
4.5.4 Vertical dimension for Y2 60
4.5.5 Result for X1, X2, Y1 and Y2
analysis in X-bar R control chart. 63
4.6 Cause and Effects 63
4.6.1 5S 65
4.7 Result after detect causes and effects. 67
4.8 Probability Plot (Pp Plot) 68
5 CONCLUSION AND RECOMMENDATION 74
5.1 Conclusion 74
REFERENCE 77
NO TITLE PAGE
2.1 Factor table 19
3.1 Distribution Centered 42
3.2 Distribution Shifts One Sigma 43
NO TITLE PAGE
2.8 Reduce a defects, increase productivity 26
2.9 Stable and Unstable process from Capable Process. 28
2.10 Process with Six Sigma range 29
2.11 Process with Centered mean and Non-centered means. 30 3.1 Flowchart of Methodology and overall of the process 33 3.2 Flow chart of the process with the method and tools requirement 34
3.3 DMAIC flow chart 36
3.4 DMAIC road map 36
3.5 Reduce defects, increase quality and productivity 37
3.6 Standard Deviation from mean 42
3.7 Industry production theory 43
4.1 X-bar R control chart for Process mean and Process Variability 46
4.2 Causes and Effects Diagram 47
4.4 Probability Plot (Pp Plot) for Normal 48
4.5 5 Flowchart of the process 50
4.6 (5X5) IC Package 51
4.7 A test point box in Minitab for X1. 52
4.8 X-bar R control chart for X1. 53
4.9 A special causes at point given with trend description for X1. 53
4.10 A test point box in Minitab for X2 55
4.11 X-bar R control chart for X2. 56
4.12 A special causes at point given with trend description for X2. 56
4.13 A test point box in Minitab for Y1. 58
4.14 X-bar R control chart for Y1. 58
4.15. A special causes at point given with trend description for Y1. 59
4.16 A test point box in Minitab for Y2. 61
4.17 X-bar R control chart for Y2. 61
4.18 A special causes at point given with trend description for Y2 62
4.19 Cause and Effects diagram 63
4.20 Rotations of 5S 67
4.21 A stable process for X2 after removal the outlier 68
4.22 Pp plot graph for X2 69
4.23 Process capability of sample mean for X-bar 70
4.24 Cpk value from capability analysis process 71
LIST OF ABBREVIATION
DPMO defects per million opportunities
IC Integrated Circuit
DMAIC define, measure, analyze, improve, and control
TQM Total Quality management
NNs Neural Networks
USL Upper Specification Limit
LSL Lower Specification Limit
CHAPTERR 1
INTRODUCTION
Six sigma is basically, a quality objective. It is an organization-wide, leadership-driven, process-oriented initiative, designed so that the processes produce no more than 3.4 defects per million opportunities (DPMO). To achieve this, a relentless pursuit of variation reduction in all critical processes needs to be carried out. Processes are required to operate so that the engineering specification is at least plus or minus Six Sigma (sigma stands for standard deviation) from the process target. Six sigma is a management philosophy based on objectives to reducing variation. A disciplined data-driven methodology for decision making and process improvement, to increase process performance, needed to decrease variation of the system.
1.0Project background
sensitive to manufacturing variations.
In semiconductor industry, the output of the production is important. Increasing the output without maintaining the quality would lead to the increase in variation in the process. By reducing this variation, it will improve the quality of the product. However, not all company will do the maintaining continuously, this always happens to the company that wants to achieve a higher output of production by neglecting the quality of the product. This leads to the product outcome that is sold customers are not the best among the best.
Figure 1.1 Industry production theories
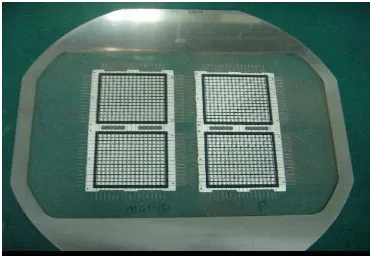
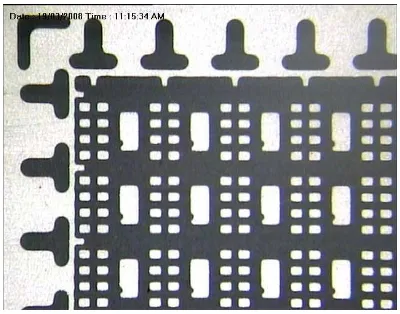
One of the objectives of this project is to identify and find a possible ways to reduce the variation in semiconductor manufacturing production of IC (Integrated Circuit). This project focuses on the ‘End Line’ production, which are the last steps for producing an IC. This part is calling the sawing process, where the chip on strip is sawed to small sizes of IC.
Figure 1.2 Strips on ring
Figure 1.3 Close view of chip on strip
Figure 1.4 a chip of an IC after sawing process
Figure 1.2 to figure 1.4 shown an example of processes that happen in ‘End Line’ of production. A strip of an IC is loaded into a machine and will be sawed to a smaller size like the ones in figure 1.4. After sawing process IC (Integrated Circuit) has been measure to detect if have any saw offset to the package size. It’s important to company to make sure the product that has produce meet the customer’s specification . However, variations do occur in this process, production data from the industry will be analyzed to detect data variation. After the problem-solving methodology is done, a possible solution will be proposed to the industry.
out of limit also give an effect to the root cause of variation and the time of working that influence the mood of operators when do their job. Effects from these special causes will lead to an increase in variation. At the same time, it may lead to a chip defect and damaged. To observed and analysis the variations of the data, that is the Process Capability (Cp) method is use. Process capability is a method by compares the output of an in-control process to the specification limits by using capability indices.
The target to achieve in this analysis is to detect and find possible ways to reduce the special cause variation in the manufacturing of IC (Integrated Circuit). All products and services are a result of some process. Six Sigma benefits others besides the customers. Six Sigma not only treats manufacturing as parts of a larger system, it removes the narrow, inward focus of the traditional approach. A through literature study on Six Sigma, Statistical process Control tools and the implementation of Six Sigma in the semiconductor industry will be performed.
1.1Project Objectives
The aims of doing this project are stated below;
1. To study and explain the benefits of the implementation of Six Sigma in the semiconductor industry to gain competitive advantage.
2. To identify production problems related to shifts and variations through control charts and Process Capability (Cp) analysis.
1.2 Problem statement
The semiconductor industry is highly innovative. The rate of innovation forces companies to proceed with high volume production before their process reach maturity. This is important for the company to maintain their status and compete with other semiconductor industry. Producing high volume of products while ignoring quality would lead to process variations.
Increasing output will influence the defects and process variation to output process. Process variations would cause products failing to meet customers’ requirement. When the quality of products does not follow customers’ spec, it will affect other processes. An increase in variation will lead to an increase in production cost. Time spent for rework for problematic products causes a lot of problem in the production line.
Customer products must be in good condition - quality and quantity wise. All of these requirements should be fulfilled by companies that care about their reputations. Furthermore it gives advantages for both, industry and customers. This would ensure the best quality products delivered to customers by decreasing variation in process that leads to cost reduction when there is less scrap in producing products. In production, less rework = improvement in productivity = employee satisfaction. When products meet customers’ specification, they would promote good feedback from customers and at the same time will increase sales.
1.3Scope
In this project, three assumptions are made for the data collected: • Independence of the data.
and scale: the mean ("average", ) and variance (standard deviation squared)
σ2, respectively.
• The data is randomly distributed.
The most common motto for Six Sigma is “Perfection is Possible”. The subtitle would be “Even when things go wrong, the product is still good”. There are two major qualifiers to the concept of perfection. The major concept is that the perfection specially means that the product meets the customer’s accurately determined specification.
The rest of Six Sigma process understands the statistic behind the charts and controls, learning the methods to determine what are working properly, and how to identify and fix problems that do occur.
In this project, it has two limitation levels that cannot be avoided. Firstly, to get the zero-defects of the variation of producing an IC. As known, each process has its variation. From here, possible ways to reduce process variation will be studied. Secondly, data collection is handled by the company staff. I have no control as to when the data is collected and how data collection is handled. Human error that occurs when taking the data also affects the analysis.
To analyze the data, Six Sigma method has been used. Statistical Software like SPSS and MINITAB are applied to industry data.
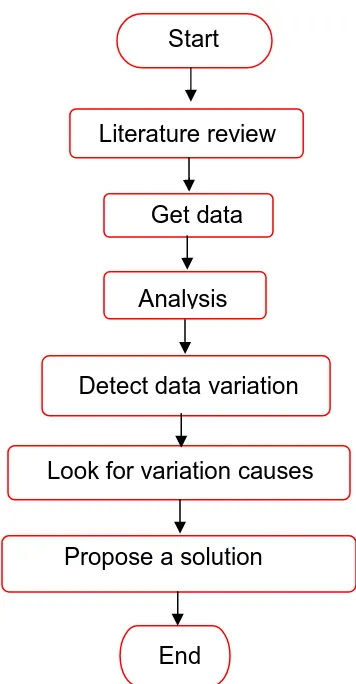
1.4Methodology project
technique of statistical process control, control charts and Process Capability Index (Cp) can be used to identify productions problems related to shifts and variation.
Figure 1.5 Project flowchart
In this project, I propose a method using Six Sigma approach to reduce variation in the production process. The most common comparison between Six Sigma and Three Sigma, Six Sigma was applied to whole an important process while Three Sigma only specific at certain process. This would thus eliminate rework and customer callbacks caused by defects, leading to lower production costs and improve customer’s satisfaction.
1.5Outline of PSM report
Start
Literature review
Get data
Analysis
Detect data variation
Look for variation causes
Propose a solution
This PSM report consists of five chapters. The first chapter discusses about background, objectives, problem statement, scope and methodology of this project. Chapter two discusses more on theory and includes literature reviews that have been done. It also will discuss on components of the analysis and software used in this project. Chapter three discusses on the methodology to solve the variation and graphical analysis development of this project. Chapter four will discuss about project’s analysis and results. Finally in chapter five it will discuss about conclusion and future work proposal for the project.