IDENTIFICATION OF CAUSES OF VARIATION IN THE SEMICONDUCTOR MANUFACTURING PROCESSESS BY STATISTICAL ANALYSIS: A SIX SIGMA APPROACH
TAN SWEE JEN
This report is submitted in particular fulfillment of the requirements for the award of Bachelor of Electronic Engineering (Computer Engineering) with Honours
Faculty of Electronic and Computer Engineering Universiti Teknikal Malaysia Melaka
UNIVERSTI TEKNIKAL MALAYSIA MELAKA
FAKULTI KEJURUTERAAN ELEKTRONIK DAN KEJURUTERAAN KOMPUTER BORANG PENGESAHAN STATUS LAPORAN
PROJEK SARJANA MUDA II
Tajuk Projek : IDENTIFICATION OF CAUSES OF VARIATION IN THE SEMICONDUCTOR MANUFACTURING PROCESSES BY STATISTICAL ANALYSIS: A SIX SIGMA APPROACH
Sesi
Pengajian :
1 0 / 1 1
Saya TAN SWEE JEN mengaku membenarkan Laporan Projek Sarjana Muda ini disimpan di Perpustakaan dengan syarat-syarat kegunaan seperti berikut:
1. Laporan adalah hakmilik Universiti Teknikal Malaysia Melaka.
2. Perpustakaan dibenarkan membuat salinan untuk tujuan pengajian sahaja.
3. Perpustakaan dibenarkan membuat salinan laporan ini sebagai bahan pertukaran antara institusi
pengajian tinggi.
4. Sila tandakan ( √ ) :
SULIT*
(Mengandungi maklumat yang berdarjah keselamatan atau kepentingan Malaysia seperti yang termaktub di dalam AKTA RAHSIA RASMI 1972)
TERHAD* (Mengandungi maklumat terhad yang telah ditentukan oleh organisasi/badan di mana penyelidikan dijalankan)
TIDAK TERHAD
Disahkan oleh:
__________________________ ___________________________________
(TANDATANGAN PENULIS) (COP DAN TANDATANGAN PENYELIA)
Tarikh: Tarikh:
iii
“I declare that this project report is the result of my own research except for quotes as
cited in the references.”
Signature : ………
Name : TAN SWEE JEN
iv
“I hereby declare that I have read this project report and in my opinion this project report is sufficient in terms of scope and quality for award of Bachelor of Electronic
Engineering (Computer Engineering) with Honours.”
Signature : ………
v
Specially dedicated… To supervisors To my beloved parents To my kind brothers and sisters
And to all friends For their
vi
ACKNOWLEDGEMENT
The thesis project I have undertaken would not have been possible without the assistance from the many individuals whom I wish to sincerely thank from the bottom of my heart. First of all, I would like to express my sincere gratitude to my thesis supervisors, Encik Radi Husin bin Ramlee and Miss Farah Shahnaz Feroz, guidance and encouragement throughout the project. Furthermore, I would like to express my appreciation
to company, organization and UTeM providing me the opportunity for carrying out this
project.
vii
ABSTRACT
The purpose of this thesis is to solve the problem of variation in the semiconductor processes by statistical analysis, using the six sigma approach. The current yield loss due to this defect had contributed to the increased production cost due to higher material scrap and rework time. Project objectives were set in Define phase in six sigma approach to detect variation and find possible ways to reduce the variation in the semiconductor manufacturing. The information for the six sigma approach was gathered and the data was collected from a company in the measure phase. A literature review on the six sigma approach will be carried out. The analyze phase results reveal the
relationship of vital few causes of variation issue, which led to the defects’ root cause of
production of integrated chip (IC). Variation was associated with the environmental and physical factors. Therefore, the relationship between these factors and the functionality and rework ability yield was developed. In Improve phase, the solution was proposed to reduce the variation considering factors such as physical dimension. Process capability (Cp)
method is used to observe and analysis the variations of the data. In final Control phase, all
the changes and implementation were properly documented, analyzed and planned for the
possible solutions. Control chart is drawn using appropriate software such as Minitab to use
for analysis of the variation. The result from the project has provided an insight on actual
successful deployment of Six Sigma approach with application of its various statistical tools
and techniques, and as the systematic problem solving framework on solving actual industrial
viii
ABSTRAK
ix
TABLE OF CONTENTS
CHAPTER CONTENTS PAGE
PROJECT TITLE i
REPORT STATUS VERIFICATION FORM ii
STUDENT DECLARATION iii
SUPERVISORY DECLARATION iv
DEDICATION v
ACKNOWLEDGEMENT vi
ABSTRACT vii
ABSTRAK viii
TABLE OF CONTENTS ix
LIST OF TABLES xii
LIST OF FIGURES xiii
I INTRODUCTION 1
1.0 Project Background 2
1.1 Objectives 3
1.2 Problem statement 4
1.3 Scope 4
x
II LITERATURE REVIEW 6
2.0 Introduction 6
2.1 Six Sigma 6
2.2 Comparison of six sigma with other sigma level 7
2.3 Six Sigma Quality Philosophy 9
2.4 Six Sigma Principles 9
2.5 Six Sigma System and Process Improvement 10 2.6 Benefits of Six Sigma of manufacturing process in industry 11 2.7 Quality Control in semiconductor industry 11 2.7.1 Steps in the quality control operation 12
2.8 Statistical Process Control (SPC) 13
2.8.1 Process definition 14
2.9 Process Capability 15
2.9.1 Importance of Process Capability 15
2.10 Control Chart 16
2.10.1 Variable control chart 16
2.10.2 Attribute control chart 17
2.10.3 Basic elements of control charts 17
2.11 Variations 18
2.12 Out of control conditions 19
2.12.1 There is one point outsider the control limit. 19 2.12.2 Seven consecutive points all above or all below the
center line
19
2.12.3 Seven consecutive points increasing or decreasing 20 2.12.4 Two points out of three consecutive points on the
same side
21
2.12.5 Four points out of five consecutive points on the same side of the center line in Zone B and beyond
xi
III METHODOLOGY 23
3.0 Methodology Overview 24
3.1 Six Sigma Strategy 26
3.2. Variable chart for subgroup via control chart 29 3.3 Variable chart for individual via control chart 31
3.4 Probability graph 33
3.5 Process capability graph 35
IV RESULTS AND DISCUSSIONS
35
4.0 Result overview 36
4.1 Ball placement consistency 38
4.2 Results of physical dimension (ball to edge) consistency for x-axis from statistical analysis tool
38
4.2.1 Item A, B, C and D for Point A (x-axis) 40 4.2.2 Item A, B, C and D for Point B (x-axis) 41 4.2.3 Item A, B, C and D for Point C (x-axis) 43 4.2.4 Item A, B, C and D for Point D (x-axis) 44 4.2.5 Item A, B, C and D for Point A (y-axis) 46 4.2.6 Item A, B, C and D for Point B (y-axis) 47 4.2.7 Item A, B, C and D for Point C (y-axis) 49 4.2.8 Item A, B, C and D for Point D (y-axis) 50 4.3 Discussions of the results of physical dimension (x-axis and
y-axis) for point A, B, C and D for item A, B, C and D
51
4.3.2 Process is instable and incapable 52
xii
V CONCLUSION AND RECOMMENDATION 54
5.1 Conclusion 54
5.2 Recommendation 55
5.3 Future Research 55
REFERENCE 56
APPENDIX 58
xiii
LIST OF TABLES
TABLE NO. TITLE PAGE
2.1 DPMO at sigma level 8
2.2 Rating of process improvement techniques 10
2.3 Reported benefits and savings from Six Sigma in manufacturing sector
11
3.1 Overview of DMAIC 26
4.1 Data of physical dimension of point A, B, C, and D for item A 36 4.2 Data of physical dimension of point A, B, C, and D for item B 37 4.3 Data of physical dimension of point A, B, C, and D for item C 37 4.4 Data of physical dimension of point A, B, C, and D for item D 38 4.5 Results of physical dimension (x-axis and y-axis) for point A,
B, C and D for item A, B, C and D
xiv
LIST OF FIGURES
FIGURE NO. TITLE PAGE
1.1 Production theory for industry 3
1.2 Flowchart for the project methodology 5
2.1 Three basic steps in the quality control operation 13
2.2 Process definition 14
2.3 Basic elements in the control charts 17
2.4 One point outsider the control limit 19
2.5 Seven consecutive points all above or all below the center line
19
2.6 Seven consecutive points increasing or decreasing 20 2.7 Two points out of three consecutive points on the same
side of the CL in zone A
21
2.8 Four points out of five consecutive points on the same side of the CL in Zone B
22
3.1 Flowchart of methodology and overall processes 24
xv
3.3 Example of data entered in Minitab 27
3.4 Steps for plotting the Xbar-R chart 28
3.5 Data inserting for plotting the Xbar-R chart 28
3.6 The result for the Xbar-R chart 29
3.7 Steps for plotting the I-chart 30
3.8 Data inserting for plotting the I-chart 30
3.9 The result for the I-chart 31
3.10 Steps for plotting the probability graph 31
3.11 Single Probability Plot Selection 32
3.12 Graph variable selecting for plotting the I-chart 32
3.13 The result for probability graph 33
3.14 Steps for plotting the process capability graph 33 3.15 Information entered for plotting process capability graph 34
3.16 Process Capability Graph 34
4.1 Specification limit for ball placement consistency 36 4.2 Physical Dimension of Point A (x-axis) for item A, B, C
and D
38
4.3 Process capability of Point A (x-axis) for item A, B, C and D
39
4.4 Physical Dimension of Point B (x-axis) for item A, B, C and D
40
4.5 Probability plot of Point B (x-axis) for item A, B, C and D 40 4.6 Process capability of Point B (x-axis) for item A, B, C and
D
41
4.7 Physical Dimension of Point C (x-axis) for item A, B, C and D
41
4.8 Probability plot of Point C (x-axis) for item A, B, C and D 42 4.9 Process capability of Point C (x-axis) for item A, B, C and
D
xvi
4.10 Physical Dimension of Point D (x-axis) for item A, B, C and D
43
4.11 Probability plot of Point D (x-axis) for item A, B, C and D 43 4.12 Process capability of Point D (x-axis) for item A, B, C and
D
44
4.13 Physical Dimension of Point A (y-axis) for item A, B, C and D
44
4.14 Probability plot of Point A (y-axis) for item A, B, C and D 45 4.15 Process capability of Point A (y-axis) for item A, B, C and
D
45
4.16 Physical Dimension of Point B (y-axis) for item A, B, C and D
46
4.17 Probability plot of Point B (y-axis) for item A, B, C and D 46 4.18 Process capability of Point B (y-axis) for item A, B, C and
D
47
4.19 Physical Dimension of Point C (y-axis) for item A, B, C and D
47
4.20 Probability plot of Point C (y-axis) for item A, B, C and D 48
4.21 Process capability of Point C (y-axis) for item A, B, C and D
48
4.22 Physical Dimension of Point D (y-axis) for item A, B, C and D
49
4.23 Probability plot of Point D (y-axis) for item A, B, C and D 49 4.24 Process capability of Point D (y-axis) for item A, B, C and
D
50
4.25 Process capability of Point D (y-axis) for item A, B, C and D
xvii
LIST OF ABBREVIATIONS
Cp Process Capability
DMAIC define-measure-analyze-improve-control
IC Integrated Circuit
PCB printed circuit board
DPMO defects per million opportunities ISO International Organization for
Standardization
SPC Statistical Process Control
DFSS design for six sigma
DMADDD Define, Measure, Analyze, Design, Digitize, and Draw Down
DMADV Define-Measure-Analyze-Design-Verify
X bar R Average and Range Control Chart
X bar S Average and Standard Deviation Control Chart
X Median R Median and Range Control Chart
CHAPTER I
INTRODUCTION
Semiconductor industries are always on the ways to improve their productivity as well as maintain their high quality control for the products. Business improvement methodology has been developing for the last century [1]. In statistics and probability theory, standard deviation of a data set or a probability distribution is the square root of its variance. Standard deviation is widely used for measuring the variability or dispersion. The standard deviation is a value which indicated that the total number of individual data deviated from the mean value. This means that an estimation value of the variation in a set of data measurement provides by the standard deviation. Recently, sigma levels from one to six have been applied in different industries all over the world. The latest approach for improving the quality of products is Six Sigma. This approach is actually modified from the previous approach where there are new concepts, methods and tools added to remove the limitations that had been identified. Six Sigma is an approach that increases
2
for improvement and problem solving for the products of semiconductor industry. Processes do not get better by themselves. So, if there is no improvement for them, it might be become worsen over time. A good approach is needed to improve the performances that measured by cost, quality and customer satisfaction.
1.0 Project Background
Six sigma was first established in the mid-1980s by Motorola under the leadership of Robert W.Galvin who is the initial developer of six sigma [2]. Six Sigma originated in the manufacturing world and grew out of the science of quality engineering. It makes heavy use of statistical process control rather than a simply statistical technique. Furthermore, it is a methodology for solving quality problems and it has applicability far beyond the area of manufacturing in which it was developed. Six sigma is a management to the bottom line results. It is a disciplined way to deliver more money to the bottom line through process improvement. Six sigma approach aim to create near-perfect processes, products and services that aligned to deliver what the customer wants.
3
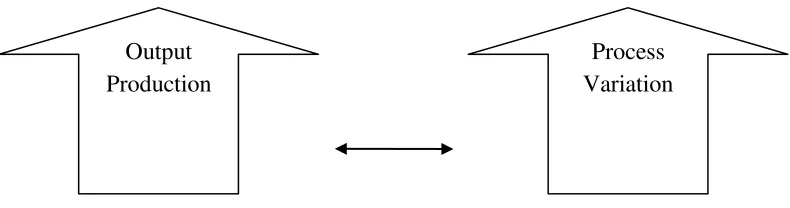
Figure 1.1: Production theory for industry
The main objective of this project is to identify and find a possible solution to reduce the variation in the semiconductor manufacturing that producing integrated circuit (IC). The problem can be solved efficiently once the variation is identified.
1.1 Objectives
The objectives in this project are as shown below.
1.1.1 To study and explain the benefits of the implementation of Six Sigma in the semiconductor industry to gain competitive advantage.
1.1.2 To indentify and analysis variation by using control chart and process capability (Cp).
1.1.3 To apply the Six Sigma approach to reduce the variation in the production process. This can eliminate the rework process and thus saving the cost.
1.1.4 To improve the quality control and product management for a company.
1.1.5 To identify the solution for reducing the variation that occurs in a semiconductor company.
Output Production
4
1.2 Problem statement
A semiconductor industry is highly concerned with the quality of the products as well as to come out with a product that is low cost and high quality which can meet the
customer’s needs or requirements. The volumes for the products may be increased due to
the high demand from the customers. However, there might be variation occurred during the process since some of the products have to be come out in a shorted or in the committed time to the customers. High process variation is not only will cause the product be rejected by customers but also will increase the cost for manufacturing the product. This is because the rework process is needed and will cause the cost and time is needed to be spent to find the solution. This will cause loss to a company since more time and modal have to be spent to overcome the problems of variation.
1.3 Scope
In this project, three assumptions are made for the data collected which are Independence of the data, means that the data is normally distributed, Normal- Gaussian distribution also called the Gaussian distribution is an important family of continuous probability distributions, applicable in many fields. Each member of the family may be defined by two parameters, location and scale: the mean ("average", μ) and variance (standard deviation squared) σ2, respectively, and the data is randomly distributed.
5
1.4 Project Methodology
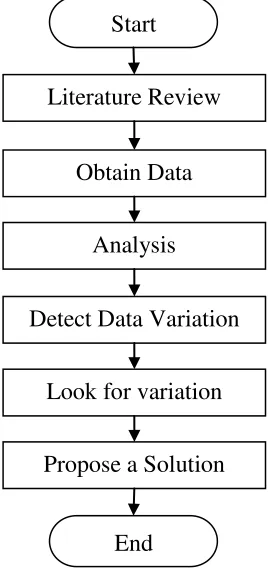
The project methodology will be followed a flowchart which is shown as Figure 1.2 below.
Figure 1.2: Flowchart for the project methodology
A literature review about the Six Sigma is done where information and ideas is gather to understand the concept of the approach. Besides that, this project will also perform the Statistical Process Control method and implementation of Six Sigma approach to a semiconductor company. Control chart and capability analysis are used to identify and find possible solutions for the cause of variation in the semiconductor manufacturing process. Then, sample data is collected from a company. Finally, a Six Sigma approach is used to reduce the variation of the manufacturing process. Thus, this
will eliminate the rework process and fulfill the customer’s requirements as well as the
production costs.
Start
Literature Review
Obtain Data
Analysis
Detect Data Variation
Look for variation causes Propose a Solution
CHAPTER II
LITERATURE REVIEW
2.0 Introduction
The main purpose of this chapter is to give the overview information about the title of this research. This chapter also explored and summarized the related literature about this title. This chapter will give the details explanations about the Six Sigma application in industry, the methodology of Six Sigma in order to increase productivity, process capability, quality control, control chart and others.
2.1 Six Sigma
7
and printed circuit board (PCB) fabrication and assembly. The wordSigma is a statistical term that measures how far a given process deviates from perfection. Six sigma is a methodology that can be used to improve the output quality of a process. Six Sigma not only can be used in manufacturing processes but also can be applied to other business such as marketing plans and designing of products. Recently, there is a significant increase in the use of Six Sigma methodology in manufacturing industry and others. Sigma is standard deviations from the mean of a data set or a measure of variation. Six sigma refers to six standard deviations from the mean. Six Sigma's aim is to eliminate waste and inefficiency, thereby increasing customer satisfaction by delivering what the customer is expecting. Statistical tools can be used to reduce the amount of variation for a process by removing the cause of variations. This can increase the output quality of a process. Six Sigma is a data driven methodology, and requires accurate data collection for the processes being analyzed. Six sigma approaches is used for eliminating the defects in any process where the defects refer to anything that outside the customer’s specification. Basically, Six sigma is an approach for improving processes, lowering defects, reducing process variability, reducing costs, increasing customers’ satisfactions and increasing profits for company. Six sigma is focus on communication between the design, development and manufacturing parts of an organization.
2.2 Comparison of six sigma with other sigma level
In simple terms Six Sigma is a disciplined program or methodology for improving
quality in all aspects of a company’s products and services. The traditional quality model