Thresholding and Fuzzy Rule-Based Classification
Approaches in Handling Mangrove Forest Mixed Pixel
Problems Associated with in QuickBird Remote Sensing
Image Analysis
Othman Mohd
*, Nanna Suryanna, Shahrin Sahib Sahibuddin, Mohd Faizal Abdollah,
Siti Rahayu Selamat
Faculty of Information and Communication Technology, Technical University of M alaysia M elaka, 76100 M elaka, M alaysia
Abstract
Mangrove forest is an important costal ecosystem in the t ropical and sub-tropical coastal reg ions. It is a mong the most productivity, ecologically, environ mentally and biologica lly dive rse ecosystem in the world. With the improvement of re mote sensing technology such as remote sensing images, it provides the alternative for better way of mangrove mapping because covered wider area of ground survey. Image c lassification is the impo rtant part of re mote sensing, image analysis and pattern recognition. It is defined as the e xtraction o f d ifferentiated c lasses; land use and land cover categories fro m ra w re mote sensing digital satellite data. One p ixe l in the satellite image possibly covers more than one object on the ground, within -class variability, or other comple x surface cover patterns that cannot be properly described by one class. A pixel in re mote sensing images might represent a mixture of c lass covers, within-c lass variability, or other co mple x surface cover patterns. However, this pixe l cannot be correct ly described by one class. These may be caused by ground characteristics of the classes and the image spatial resolution. Therefore , the aim of this research is to obtain the optimal threshold value for each class of landuse/landcover using a combination of thresholding and fuzzy rule -based classification techniques. The proposed techniques consist of three ma in steps; selecting train ing site, identify ing threshold value and producing classificat ion map. In order to produce the final mangrove c lassification map, the accuracy assessment is conducted through ground truth data, spectroradiometer and e xpert judg ment. The assessment discovered the relationship between the image and condition on the ground, and the spectral signature of surface materia l in identifying the geographical object.Keywords
Mangrove, Re mote Sensing Satellite Image, Threshold, Fu zzy Rule-Based Classification1. Introduction
Mangrove area is an important costal ecosystem in the tropical and sub-tropical coastal regions. It is among the most productivity, ecologically, environ mentally and biologically d iverse ecosystem in the world. Managing of mangrove is challenging and comple x balanc ing between ecosystem protections and enabling human to enjoy and use these natural resources. Knowledge to obtain informat ion on ecosystem including mangrove commun ity is important.
With the improvement of re mote sensing technology, it provides the alternative for better way of mangrove mapping because covered wider area of ground survey. Furthermore it reduces human energy, time and cost. The informat ion fro m re mote sensing satellite has been re corded re motely and
* Corresponding author:
[email protected] (Othman Mohd) Published online at http://journal.sapub.org/ijaf
Copyright © 2012 Scientific & Academic Publishing. All Rights Reserved
transformed into re mote sensing images. The information that may be generated is directly linked the related characteristics of the images and produces spatial resolution (pixe l size), spectral resolution (wavelength ranges utilized) and spatial e xtend (ground area represented). Reflectance fro m each pixe l is measured at many narro w, contiguous wavelength intervals. Nevertheless the increasing of spatial resolution associated with most satellite sensor systems imaging is higher than the normal sizes of object on the ground.
more than one object on the ground, within-c lass variability, or other comp le x surface cover patterns that cannot be properly described by one class. Although the detail informat ion is recorded, yet there have a serious problem to recognize a part icular geographical ob ject due to overlapping of two or more associated spectral properties. A pixel in re mote sensing images might represent a mixture of class covers, within-c lass variability, or other co mple x surface cover patterns. This pixel cannot be correctly described by one class. These may be caused by ground characteristics of the classes and the image spatial resolution. Since one class cannot describe these pixels, thresholding is most applicable methods used to separates the problems of overlapping pixel.
It is wide ly accepted that selection of correct threshold will lead to good extract ion of object[3]. Unfo rtunately according to Hong Yan,[4] the main issue is to choose an optima l threshold value so that the misclassification of image pixe ls is kept as low as possible. According to[5], although many and good train ing areas are selected, misclassification occurs to some e xtent in case of classification of mangrove area by any classifiers. It is because there are pixe ls having similar spectral reflectance in the categorized area such as land area, mangrove forest and water.
Fuzzy logic theory have been widely use in variety of problem do main. It has invaded a lot of fields such as fuzzy control systems, fuzzy image processing and predictably, fuzzy c lassification of re mote sensed data. The use of fu zzy rule-based classification has become of great interest because of its capacity to provide more useful information for geographic information systems[6]. The fuzzy ru le-based classification, or p ixe l un mixing, estimates the contribution of each c lass in the p ixe l.[7] stated that in supervised classification, mixed pixe ls usually result in misclassification since the mixed pixe ls are different spectrally fro m pure pixe ls of the individual vegetation types. With fuzzy classificat ion, mixtures estimation, spectral mixtu re analysis and subpixe l classification information is obtained about the fraction of different classes within a mixed pixel.
This paper discusses on the use of thresholding selection techniques and fuzzy rule-based classification to identify landcover and mangrove species using QuickBird satellite image. The ma in focus of this study is to classifying mangrove species using two diffe rent thresholding methods; as well as to imp rove the accuracy of mangrove species through the development of new optimal threshold technique base on Fuzzy ru le-based classification. Furthermo re the classification results obtain fro m these methods will be validating through ground truthing data and expert judgement before producing the final mangrove mapping. By doing this; it should help the admin istrator to distinguish mangrove species group and to identify the wavelength regions that defines the inherent spectral curve between each mangrove species.
2. Related Works
Part of this paper is intended to discuss the state of art the combination between thresholding techniques and fuzzy rule-based classification which at the end will provide informat ion of the proposed algorithm for mangrove classification. In other words, they are many techniques have been studied but the decomposition of mixed pixe l proble m using thresholding techniques and fuzzy ru le-based classification still have need more attention for both the ongoing and future research.
Mangrove forest consists of particular do minant species plays an important ro le to protect shoreline fro m erosion, to stabilize banks and coastlines besides it become home to many types of animals. The re mote sensing satellite is an e xcellent tool and has been used for monitoring land use and obtaining data for defining deforested areas and to update manage ment plans of mangrove forest. Research that has been conducted shows that a variety of sensors and image processing methods have been used in the remote sensing of mangroves[8]. In addit ion re mote sensing sensor allows informat ion to be gathered from areas that would otherwise be, logistically and practica lly, very d ifficu lt to survey. Furthermore the improve ment of re mote sensing satellite technology offered the opportunity for better way of mangrove mapping.
Many research has been conducted by previous researchers related to the application of re mote sensing and aeria l photograph techniques for mangrove for e xa mp le [9],[10],[11] and etc. According to[12], imp rovement of land cover classification of re mote sensing images (Qu ickBird, Ikonos, Spot 5 and etc) especially for mangrove can be potentially be made by using techniques such as soft computing, segmentation and classificat ions. In addition the use of remote sensing images offered many advantages especially to study mangrove areas effective ly, besides to manage and monitor changes over time, accurate and fast.
The use of re mote sensing satellite tools and its application is e xce llent and are well established for mangrove mapping at the fundamental level[13]. Unfortunately there is an increasing de mand for detailed mangrove maps at the community or species level ma inly for studying mangrove ecosystems and their d iversity. According to[14, 15], the remote sensing satellite images have not been extensively used for mapping mangrove species due to the limited spectral and spatial resolution of conventional imagery. Hence, there is a need to use advanced re mote sensing techniques to be exp lored for the purpose of mangrove mapping at a finer level.
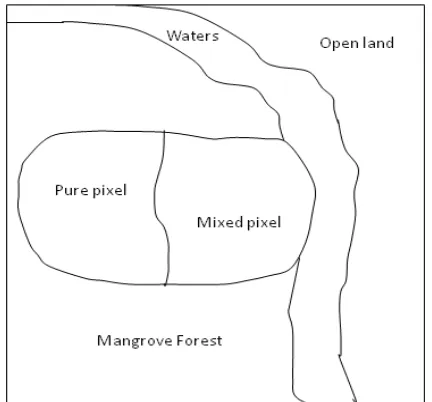
20m spatial resolution can produce one pixe l with purely one class type or one pixel with two or more c lasses’ type.
Figure 1 show the boundaries between different class types and small a rea of class. In most maps, boundaries are drawn as lines but in reality the boundaries are typically zones that separate between classes. Methods of classificati on can be classified in unsupervised classification, supervised classification and hybrid approaches which combination between unsupervised and supervised methods [7]. M ixed p ixe ls in unsupervised classification are typically dealing by using mixed labels, i.e. forested/mangrove, because there is no method for e xt racting informat ion about the amount of each species using traditional per-pixel classifiers. While in supervised classification, mixed pixels usually produce misclassification because the mixed pixels are diffe rent spectrally fro m pure pixe ls of the indiv idual classes. Therefore according to[7], the proble m of mixed pixe ls norma lly dealing with fu zzy classification, mixtures estimation, spectral analysis and subpixel classificat ion[15].
Figure 1. Boundaries between different class types and small area of class
The accuracy of the final map is affected by the ability of the classification method to distinguish[8] between various classes type. It is important to classify satellite images using right thresholding techniques to produce an accurate threshold value of each class.[5] conducted research using Landsat TM 5 satellite image to decide threshold in o rder to avoid the misclassification and to prepare data sets for quantitative estimat ion of stand parameters on mangrove forest. Further research conducted by[16] was imp le ment Receiver Operating Characteristic analysis curve techniques to select threshold and improve classificat ion to determine mangrove and non-mangrove areas Northwestern Mexico Coastal Zones.[17, 18] have studied about classification algorith m and development of understanding system for re mote sensing images. They have been considered the spectral features in diffe rent regions. It was expected that the spectral features for one object are simila r and the spectral features are different for diffe rent objects. However in the
commonly cases, the spectral features for the same objects are often different because of the shadow of mountains, the diffe rence for image acquiring t ime and etc., in the other hand, the spectral features for different objects are the same in sometimes because of the image resolution.
In the studied conducted by[19] a thresholding technique was used to classify the fract ion images into five c lasses after faction images using linear spectral mixture analysis. Furthermore the thresholds were in itia lly selected through the exa mination of sa mple p lots with window size of 3 x 3 pixe ls on the fraction images, i.e. based on the statistical analysis of mean and 2.5 standard deviation by considering a minimu m and ma ximu m fro m the selected samples for each land cover class.
Image classificat ion can be divided into 2 methods; unsupervised and supervised. In an unsupervised method the numerical informat ion in the spectral data classes are firstly been group. It then matched by the researcher to information classes. To determine the natural groupings or structures in the data, the clustering algorith ms are used. The researcher decide how many g roups or clusters are to be identify for in the data, the parameters re lated to the separation distance among the clusters and the variation within each cluster. With the application of the clustering algorith m, the ite rative clustering process may result in so me c lusters to be combined, or some c lusters may be fu rther broken down. Thus, unsupervised classification is not comp letely without human intervention. It does not require training areas, just the number of c lasses researcher would like to end up with[1].
Another method used for image classification is called supervised classification; the identificat ion and location of some of the land cover types are known a prior. Researcher identifies in the imagery ho mogeneous representative samples or tra ining areas of the different surface cover types of interest. Furthermo re the selection of appropriate tra ining areas is based on the analyst's fa miliarity with the geographical area and their knowledge of the actual surface cover types present in the image. The researcher is supervising the categorization of a set of specific c lasses. The classification a lgorith m is trained to perform land cover classification of the rest of the image.
In the classification of re mote sensing images, Wang proposed a supervised mode for fu zzy classification. Mannan et al. applied fu zzy neutral networks to the classification of multi-spectral images. Foody et al found that the fuzzy me mbe rship values for each cover class strongly corre late with the actual ground proportions of those land cover classes. In comp le x fuzzy systems, manual determination and optimization of fu zzy me mbership parameters is impossible. It is desirable that knowledge automation be incorporated into e xisting fu zzy systems in order to ma ke the benefits of fuzzy ru le-based classification available to re mote sensing satellite image classificat ion.
3. Proposed Approach and
Classification Algorithm
Re mote sensing image with high resolution provides valuable data for land-use mapping, environ mental monitoring, disaster management and etc. The efficient decision processes can be achieve if the full value o f these data explore and the appropriate information can be e xtracted and presented in standard format. One of the processes used for e xtracting informat ion fro m these images is based on classification or c lustering.[20] stated classification is the process of automatically grouping a given set of data with similar characteristics will be long to the same cluster. It is usually based on object's attributes. However the process of image c lassification for re mote sensing image is based on multispectral analysis of the pixe ls.
Thresholding techniques is fast and simplest technique which is common ly used in many image processing[21]. Thresholding techniques are image segmentations based on image-space regions. According to[22, 23], it is a process of separation a digital image into equally e xclusive and unique areas.
The selection of correct threshold will lead to good e xtraction of ob jects. A revie w of various methods of image thresholding by[24], mention that thresholding is when there is only a single threshold or T, an object point is any point (x, y) for which f (x, y) ≥ T; and a background is a point (x, y) if f (x, y) < T. Research conducted by[5], use the threshold values from Landsat TM satellite image to separate whole target area into three parts; land area, waters and mangrove forest. Furthermore research fro m[16] using Landsat TM satellite image found that selection of a classification threshold according to the uncertainty level is a ma in advantages for mangrove ecosystem.
Fuzzy logic theory have been widely use in variety of problem do ma in. Fuzzy set theory and fuzzy logic are ideally suited for dealing with uncertainty and imp recision (Krishnapuram, 1998) and (Sugeno, 1985). It has invaded a lot of fie lds such as fuzzy control systems, fuzzy image processing and predictably, fu zzy c lassification of re mote sensed data. The use of fu zzy c lassification has become of great interest because of its capacity to provide more useful
informat ion for geographic info rmation systems. The fuzzy classification, or p ixe l un mixing, estimates the contribution of each class in the p ixe l. It assumes that a pixe l is not an indecomposable unit in the image analysis and, consequently, works on a new princ iple : “one pixel to several classes” to provide more information about the pixe l unlike the hard classification methods which are poor in information e xtraction.
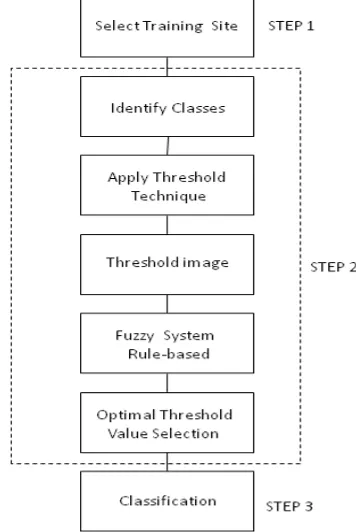
Taking above e xp lanation on the advantage of threshold technique and fuzzy ru le-based classification techniques, therefore the proposed algorithm has adopted both threshold and fuzzy ru le-based classification techniques. The propose steps of QuickBird image algorith ms is illustrated in Figure 2.
Figure 2. Propose steps of QuickBird image algorithms of pre-processing, features extraction using threshold and fuzzy rule-based classification
The proposed steps of image c lassification a lgorith m using QuickBird are divided into three ma in steps.
Step 1: Selecting trai ning site
This step involved the process of identifying area of interest to conduct the research. The process of image pre-processing process was carried out previously.
Step 2: Identi fying threshol d value
This step involved five ma in processes; identifying c lasses, applying thresholding techniques, selection of good threshold, applying fu zzy rule-based classification and finally selection of optima l threshold value.
i. The processes of identifying c lasses were representing each known land cover classes through analysis to the land use map. It co mes out with the homogeneous characteristics on the image.
global and local adaptive threshold technique is used. iii. The threshold values obtain fro m global and local threshold technique will be co mpared. The good threshold value will be applied to the e xisting satellite image.
iv. The proble m of overlapping pixe l or mixed pixel will be carried out by fuzzy rule-based classification.
v. Fina lly the optima l threshold value will be selected and apply to existing satellite imagery.
The global and local adaptive threshold is use to obtain the first threshold value of each class. The global thresholding selects a single threshold value fro m the histogram of the entire image. It is simp ler and easier to imp le ment but its result relies on good illu mination. For visual inspection applications, where non-uniform illu mination is usually not an issue, global thresholding is co mmonly used for its simp lic ity and speed.
The study by[25] concluded that the Otsu method[26] was one of the better threshold selection methods for general real world images with respect to uniformity and shape measures among the global thresholding techniques. The Otsu method works we ll when the images to be threshold have clear peaks and valleys. In other words, it works for images that their histograms show clear bimodal or mu ltimoda l distributions. This method selects threshold value that ma ximizes the between-class variances of the histogram[27].
[27] stated that local thresholding uses localized gray-level information to choose multiple threshold values; each is optimized for a sma ll region in the image. Local thresholding methods can deal with non-uniform illu mination but they are slow. The local thresholding method sets the threshold value dynamically according to the local characteristics to achieve a good separation[28] between classes.
The overlapping pixe l or mixed pixe l proble m after thresholding techniques to produce the final c lassification will be carried out using rule-based classification. While each class description contains a set of fuzzy e xpressions let the evaluation of specific features and their logica l operation. The control knowledge is represented clearly by a set of rules. Each rule is making up of a condition and an action part. The condition is formulated by the means of para meters or class descriptors. The classification rules fo rmulat ion is ca rried out by the context information and relat ionships of the classes. This algorithm can be used to automatic selected the optima l threshold values for each features and the results.
Step 3: Producing classification map
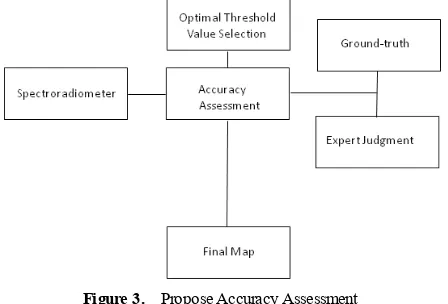
In this step, the optima l value identified fro m step 2 will be used in the satellite image to p roduce the classification map as shown in Figure 2. Then, the accuracy assessment is conducted as depicted in Figure 3 to finalize the optimal threshold value for c lassification map. The final classificati on map then is constructed by comparing the optima l value with the results of ground truth, spectroradiometer and e xpert judg ment.
Figure 3 depicts the process of accuracy assessment conducted in order to construct the classification map. Accuracy assessment is an important part in the image
classification procedure of the c lassified image. According to[29], accuracy is considered to be the degree of closeness of results to the values accepted as true. The e xa mp le o f the accuracy assessment methods are: the variance analysis, minimu m accuracy value used as an index of c lassification accuracy, spatial erro r and c lass attribute errors, a probabilistic approach fo r change detection and land cover classes are abstraction and generalizations of the real world in order to provide discrete values for continues.[30] stated that the classification accuracy assessment generally comprises three basic co mponents: sampling design, response design, and estimat ion and analysis procedures. According to[31] the ma jor co mponents of a sampling strategy include sampling unit (p ixe ls or polygons), sampling design, and samp le size. Research conducted by[32] stated the most frequently used method in accuracy assessment is the error matrix. While[19] added one critical step in accuracy assessment is to select a sufficient number of test sample p lots for each class with a suitable sampling method. Random or stratified random sa mpling approaches are often for a robust assessment of classification results.
Figure 3. Propose Accuracy Assessment
In this research, the accuracy assessment consists of ground truthing, expert judgement and identify ing the spectral reflectance signature through spectroradiometer as discussed in the next subsection.
a. Ground tr uthing
Fie ld data or ground truth consists of observations collected at or near ground level in support of remote sensing analysis. Accurate ground truth permits the analyst to match points or area on the imagery to corresponding regions on the ground surface. It needs to establish with confidence relationships between the image and conditions on the ground. Ground truth data are important for c lassifying the data to informational c lasses and for assessing classification accuracy[33]. In re mote sensing, it is important in o rder to relate image data to real features and materia ls on the ground. Hence the collection of ground-truth data enables calibration of re mote-sensing data, and aids in the interpretation and analysis of what is being sensed.
b. Expert Judg ment
Therefore to conduct this research it required an assistance of e xpert judg ment or e xperience staffs fro m State Fo restry Depart ment, it makes the process of identificat ion mangrove species and other object faster and valuable. The process of identify species was conducted thru tree leaves and their bark[34].
c. S pectr al re flectance signature thr ough Spectr oradi ometer
The spatial resolution of satellite re mote sensing system is too low to identify many objects by their shape or spatial detail. Therefore the measuring of spectral signature of surface materia ls, such as vegetation, soil and water, over the spectral range in Figure 4 is used to identify and de lineate geographical object.
Figure 4. An example of reflectance spectra of six materials: Four types of mangrove species, mud and water
4. Concluding Remarks
In this paper, the mangrove classification approach through threshold techniques and fuzzy ru le-based classification is proposed. It took the advantage of combination o f thresholding techniques and fuzzy ru le-based classification to improve the accuracy of the final classification map. A lgorith m is considered potentially applicable to e xtract informat ion on geographical object recognition fro m Quic kBird images.
ACKNOWLEDGEMENTS
This project is supported financially by a research short grant from UTeM, Durian Tunggal, Melaka. Va luable supports also received fro m FTM K particu larly for allowing us to use fully facilitated Research and Development Lab, Forestry Department Pen insular Malaysia, Malaysia Re mote Sensing Agency, and Department of Land and Survey Malaysia.
REFERENCES
[1] Jindal, S., and Josan, G., "Neural Network and Fuzzy Logic Approach for Satellite Image Classification: A Review", in Proceeding of COIT, pp. 1-4, 2007.
[2] Suryana, N., Rasip, N.M., and M ohd, O., "Data M ining and Neural Network Approaches in Handling M ixed Problems Associated Within Hyperspectral Remote Sensing Image Analysis", Vietnam, 2007.
[3] Chaira, T., and Ray, A.K., "Threshold selection using fuzzy set theory", Pattern Recognition Letters (PRL), vol. 25, no. 8, pp. 865–874, 2004.
[4] Yan, H., "Unified Formulation of A Class of Image Thresholding Techniques", Pattern Recognition, vol. 29, no. 12, pp. 8, 1996.
[5] Sato, K., Nakajima, M ., and Hoshi, T., "Threshold Operation for Extraction of M angrove Forest with TM Data of Landsat", in Proceeding of ACRS, 1999.
[6] M elgani, F., Hashemy, R.B.A.A., and Taha, R.S.M ., "An evaluation of the explicit fuzzy method using parametric and non-parametric approaches for supervised classification of multispectral remote sensing data", Engineering Journal Of University Of Qatar, vol. 14, pp. 77-104, 2001.
[7] Ozesmi, S.L., and Bauer, M .E., "Satellite remote sensing of wetlands", Wetlands Ecology and M anagement, vol.10, pp. 381-402, 2002.
[8] Green, E.P., Clark, C.D., M umby, P.J., Edwards, A.J., and Ellis, A.C., "Remote sensing techniques for mangrove mapping", International Journal of Remote Sensing, vol. 19, no. 5, pp. 22, 1998.
[9] Ali, Y., M ahfuz, H., Zuhair, M ., and Weir, M ., "Monitoring M angrove Forest using Remote Sensing and GIS", in Proceeding of ACRS, 1999.
[10] Azlan, N.I., and Othman, R., "M onitoring of M angrove Area Using Remote Sensing Toward Shoreline Protection ", in Proceeding of GIS Conference Ostava, 2009.
[11] I, M .H., K.O, C.K.A.C., Norsaliza, U., and I., K., "Comparison of several vegetation indices for mangrove mapping using remotely sensed data", International Geoinformatics Research and Development Journal, vol. 1, no. 3, pp. 9, 2010.
[12] Singh, R.K., "Pattern recognition in remote-sensing imagery using data mining and statistical techniques", PhD thesis, Purdue University, 2005.
[13] Vaiphasa, C., "Remote Sensing Techniques for M angrove M apping", PhD thesis, Wageningen University, 2006. [14] Wang, L., Sousa, W.P., Gong, P., and Biging, G.S.,
"Comparison of IKONOS and QuickBird images for mapping mangrove species on the Caribbean coast of Panam", Journal of Remote Sensing and Environment, vol. 91, pp. 8, 2004. [15] Kanniah, K.D., Wai, N.S., Shin, A.L.M ., and Rasib, A.W.,
"Per-pixel and sub-pixel classifications of high-resolution satellite data for mangrove species mapping", Applied GIS, vol. 3, no. 8, pp. 22, 2007.
[16] Alatorre, L.C., Sánchez-Andrés, R., Cirujano, S., Beguería, S., and Sánchez-Carrillo, S., "Identification of M angrove Areas 0.0
by Remote Sensing: The ROC Curve Technique Applied to the Northwestern M exico Coastal Zone Using Landsat Imagery", Journal of Remote Sensing, vol. 3, pp. 1568-1583, 2011.
[17] Liu, Y., Yan, S., and Wang, T., "Study on Image-segmented Classification", in Proceeding of ICII, pp. 296-301, 2001. [18] M ing, D., Luo, J., Shen, Z., and Li, J., "Features Based Parcel
Unit Extraction From High Resolution Image", in Proceeding of Geoscience and Remote Sensing Symposium, 2005. [19] Zhang, Y., Lu, D., Yang, B., Sun, C., and Sun, M ., "Coastal
wetland vegetation classification with a Landsat Thematic M apper image", International Journal of Remote Sensing, vol. 32, no. 2, pp. 545-561, 2011.
[20] Droj, G., "The Applicability of Fuzzy Theory In Remote Sensing Image Classification", Informatica, vol. II, no. 1, pp. 8, 2007.
[21] Sezgin, M ., and Sankur, B., "Survey over image thresholding techniques and quantitative performance evaluation", Journal of Electronic Imaging, vol. 13, pp. 19, 2004.
[22] Yang, Q., and Kang, W., "General Research on Image Segmentation Algorithms", International Journal Image, Graphics and Signal Processing, vol. 1, pp. 1-8, 2009. [23] Al-Kubati, A.A.M ., Saif, J.A.M ., and Taher, M .A.A.,
"Evaluation of Canny and Otsu Image Segmentation", in Proceeding International Conference on Emerging Trends in Computer and Electronics Engineering Dubai, 2012. [24] Kaur, E.N., and Kaur, E.R., "A Review on Various M ethods
of Image Thresholding", International Journal of Computer Science and Engineering, vol. 3, no. 10, pp. 3, 2011. [25] Sahoo, P.K., Soltani, S., and Wong, A.K.C., "A Survey of
Thresholding Techniques", Computer Vision, Graphics and Image Processing, vol. 41, no. 2, pp. 233-260, 1988. [26] Otsu, N., "A threshold selection method from gray-level
histograms", IEEE Transactions on Systems, M an, And Cybernetics, vol. 9, no.1, pp. 62-66, 1979.
[27] Ng, H.-F., "Automatic Thresholding for Defect Detection ", Pattern Recognition Letters (PRL), vol. 27, no. 14, pp. 1644-1649, 2006.
[28] Liu, H., and Jezek, K.C., "Automated extraction of coastline from satellite imagery by integrating Canny edge detection and locally adaptive thresholding methods", International Journal of Remote Sensing, vol. 25, no. 5, pp. 937-958, 2004. [29] Zăvoianu, F., Caramizoiu, A., and Badea, D., "Study And Accuracy Assessment of Remote Sensing Data for Environmental Change Detection in Romanian Coastal Zone Of The Black Sea", in Proceeding of ISPRS, pp. 778-783, 2004.
[30] Stehman, S.V., and Czaplewski, R.L., "Basic structures of a statistically rigorous thematic accuracy assessment", in Proceeding of the 1997 ACSM /ASPRS Annual Convention, ASPRS Technical Papers, vol. 3, pp. 543-553, 1997. [31] M uller, S.V., Walker, D.A., Nelson, F.E., Auerbach, N.A.,
Bockheim, J.G., Guyer, S., and Sherba, D., "Accuracy Assessment of a Land-Cover M ap of the Kuparu k River Basin, Alaska:Considerations for Remote Regions", Photogrammetric Engineering & Remote Sensing, vol. 64, no. 6, pp. 619-628, 1998.
[32] Foody, G.M ., "Status of land cover classification accuracy assessment", Remote Sensing of Environment, vol. 80, pp. 185- 201, 2002.
[33] Her, Y., and Heatwole, C., "Land use classification in Zambia using Quickbird and Landsat imagery", in Proceeding of American Society of Agriculture and Biological Engineers, M inneapolis Convention Center, M inneapolis, M innesota, 2007.