P
H Y SI CS
The Effect of Repetition Time on
the Maximum Linear Relationship
Between Contrast Agent
Concentration and Signal Intensity
on T1-Weighted Image Using
Inversion Recovery (IR) Sequence
Background/Objective: The relaxation time T1 depends on the concentration of paramagnetic
contrast agent. To calculate perfusion parameters from dynamic contrast-enhanced MRI
ac-quisitions, measurement of the concentration is necessary. At low concentrations, the
rela-tionship between changes in 1/T1 and concentration can be considered to be linear. To
max-imize the concentration, and hence the signal to noise ratio (SNR) in perfusion images, the
range of this linearity should be known. This work studied the effect of two repetition times
(TR) on the linearity using inversion recovery Turbo Fast Low Angle Shot (TurboFLASH)
se-quences at different effective inversion times (TI).
Patients and Methods: To assess the relationship between signal intensity (SI) and
concentra-tion, a water-filled phantom containing vials of different concentrations of Gd-DTPA (0 to
19.77 mmol/L) was used. The mean SI was obtained in the region of interest using
T1-weighted images. Coil non-uniformity was corrected on SI.
Results: This study shows that an increase in TR is associated with a decrease in the
maxi-mum linear relationship between effective TI and concentration where the square correlation
(R
2) between corrected SI and concentration were equal to 0.95 or 0.99.
Conclusion: In spite of TR = 2 or 3s and r
2= 0.95 or 0.99 at a typical effective TI = 800ms,
which is normally used for in vivo perfusion, the maximum linearity is about twice that
pre-viously reported (i.e. 0.8mmol/L) for measuring the perfusion parameters. The higher dose
will improve the SNR in perfusion images.
K e yw ords: I nve rsion Re c ove ry, T 1 -We ight e d I m a ge , Signa l I nt e nsit y, I nve r-sion T im e , Re pe t it ion T im e
Introduction
ifferent investigations suggest that perfusion parameters may be assessed by studying signal intensity (SI) changes after the first pass of a paramagnetic contrast medium through tissue.1-2
Changes in signal intensity depend on the magnetic susceptibility of contrast agent, the magnetic field strength, the pulse sequence parameters, the dose of contrast agent, the injection rate and bolus volume, the cardiac output and blood volume, and the topology of tissue.3
MRI is not able to measure the concentration of contrast agent directly; it is measured indirectly from signal intensity. Therefore, the resulting signal intensi-ty time curves should be converted into concentration time curves.4
At low concentrations, the relationship between changes in signal intensity and concentration may be considered to be linear. To maximize the
D
M. Nazarpoor PhD
11. Assistant Professor, Department of Radiology, Faculty of Paramedicine, Tabriz University of Medical Sciences, Tabriz, Iran.
Corresponding Author: Mahmood Nazarpoor
Address: Department of Radiology, Faculty of Paramedicine, Tabriz University of Medical Sciences, Daneshgah St., Tabriz, Iran. Tel/Fax: +98411-336-8733 Email: [email protected]
Received July 4 2009;
Accepted after revision November 7, 2009.
angle shot (TurboFLASH) sequence at different effec-tive TIs.
Materials and Methods
For T1-weighted monitoring of contrast agent a
number of T1-weighted sequences are available.10
The standard inversion recovery sequence, which is dependent on TI and repetition time (TR), is de-scribed by the following equation8
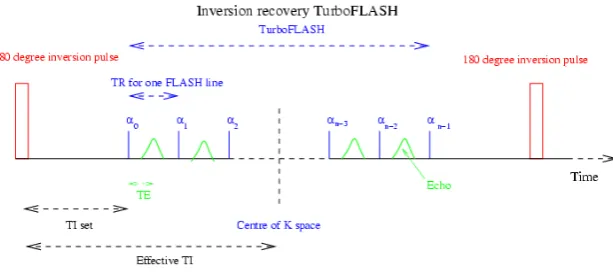
in which S(t) is the signal intensity after administra-tion of contrast agent and S0 is the observed signal intensity in the absence of any magnetization prepa-ration pre pulses or contrast agent. T1(t) is the longi-tudinal relaxation time at time t after contrast appli-cation and T1Pre is the longitudinal relaxation time at time t before contrast application. C(t) is the concen-tration of contrast agent at time t. K is a constant that depends on the contrast media.Figure 1 shows sche-matic representation of the inversion recovery
gra-vials of different concentrations were used to meas-ure the relationship between SI and concentration.
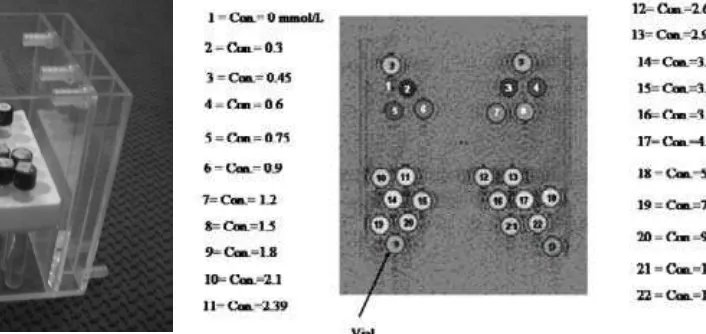
The phantom of different concentrations consisted of 25 vials (glass tube, inner diameter approximately 15 mm filled with different concentrations of Gd-DTPA (Magnevist, Schering Health Care Ltd, West Sussex, UK). The concentration of Gd-DTPA varied between 0 and 19.77 mmol/L (0.00, 0.30, 0.45, 0.60, 0.75, 0.90, 1.20, 1.50, 1.80, 2.10, 2.39, 2.69, 2.99, 3.28, 3.58, 3.98, 4.96, 5.95, 7.93, 9.90, 13.85 and 19.77 mmol/L).
Clinical head and neck coil was used with the phan-tom. The vials were set vertically and the axes of the vials were perpendicular to the image plane (coronal image).
Two experiments were performed, one using the vials with different concentrations and one using the vials of constant concentration.
The vials in the phantom with constant concentra-tion (1.20 mmol/L) were placed in exactly the same positions of the vials with different concentrations.
(1)
The non-uniformity of the coil was calculated from each vial with constant concentration and it was normalized to give a correction factor. To calculate the corrected SI for different concentrations, the SI of each vial was multiplied by its correction factor.
The phantom was positioned within the coil. All studies were carried out using a 1.5-T clinical MR scanner (Vision, Siemens Medical, Erhlangen, Ger-many). T1-weighted TurboFLASH images were used to measure signal intensity in the vials with different and constant concentration.
The TurboFLASH imaging parameters were as fol-lows:
matrix size, 128×128; time for one FLASH line, 8.5 ms; echo time [TE], 4 ms; effective inversion time [TI] was varied between 644 and 1944 ms; pixel size, 2×2 mm. The images were acquired (TR) every 2 and 3 seconds with a slice thickness of 10 mm and a flip angle of 15˚.
The image data were transferred from the MR scan-ner to a Unix workstation. The image processing software interactive data language (IDL, Research Systems, Inc. http://www.rsinc.com) was used for processing.
Programs were written to automatically find: 1- The correction factors of the coil non-uniformity from vials with constant concentration. The SI of the vials with different concentration was then multip-lied by these factors.
2- To draw the best fit curve of concentration ver-sus SI curve using equation 1.
3- To find the maximum concentration, where the
square correlation coefficient (r2) between corrected SI and concentration were equal to 0.95 or 0.99 from the best fit curve. The square correlation coefficient (r2) gives the strength of the linear relationship be-tween SI and concentration. When r2 is 0.95, it indi-cates that 95% of the variation in SI is explained by the variation of concentration.12
These programs could be run from either a Unix workstation or a personal computer.
Results
Figure 3 shows the coronal image of the phantom. The position of different concentrations inside the vials can be seen in the figure.
Figure 4 shows a typical result of corrected SI versus concentration of the contrast agent. The maximum linear relationship between concentrations and cor-rected SI that gave a square correlation (r2) equal to 0.95 and 0.99 were 3.92 and 2.25 mmol/L, respective-ly at effective TI =644 ms at TR=2 s.
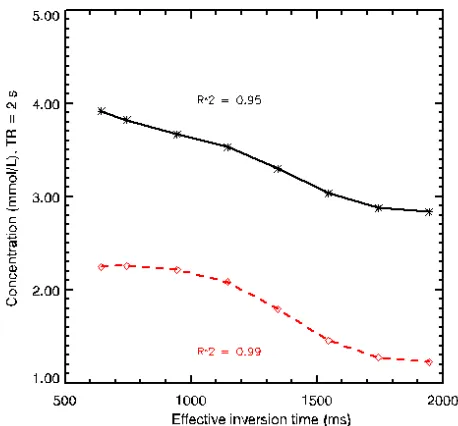
Figure 5 shows that the maximum linear relation-ship between SI and concentration is up to 3.92 and 2.84 mmol/L for short effective TI (644 ms) and long effective TI (1944 ms), respectively (r2 = 0.95). In ad-dition, these values reduced to 2.25 and 1.23 mmol/L for these effective inversion times where r2 = 0.99 at TR = 2 s.
The figure indicates that an increase in effective TI is associated with a decrease in the maximum concen-tration. The R2 was measured from the best fit curve for each TI similar to that obtained from Figure 4. Fig. 2. Phantomwith different concentrations placed inside the
head and neck coil.
Figure 6 shows a typical result of corrected SI versus concentration of the contrast agent. The maximum linear relationship between concentrations and cor-rected SI that gave a square correlation (r2) equal to 0.95 and 0.99 were 3.50 and 1.84 mmol/L, respective-ly at effective TI = 644 ms at TR=3 s.
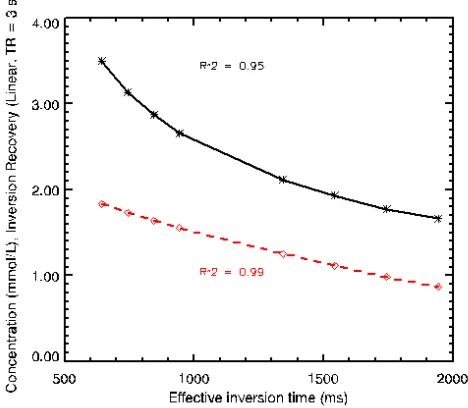
Figure 7 illustrates that the maximum linear rela-tionship between SI and concentration is up to 3.50 and 1.66 mmol/L for the short effective TI (644 ms) and long effective TI (1944 ms), respectively where R2 = 0.95. In addition, these values reduced to 1.84 and 0.87 mmol/L for these effective inversion times where r2 = 0.99 at TR = 3 s.
Discussion
The concentration of contrast agent in CT or radioi-sotope scintigraphy linearly correlates with CT num-ber or radioactivity, but in MRI, the concentration of Gd-DTPA does not necessarily correlate linearly with SI. Gd-DTPA has both a T1 shortening effect and T2 shortening effect. The T1 shortening effect is domi-nant at low concentrations of Gd-DTPA as modeled by equation 1, and the T2 shortening effect is domi-nant at high concentrations.6 At high concentrations, both T1 and T2 can be affected as the SI response be-came non-linear with an unsteady plateau.
MRI is unable to measure the concentration of con-trast within the ROI; therefore, it is measured indi-rectly from the SI. Consequently, in order to calculate concentration from SI, the maximum concentration for this linearity should be measured.
Correlation between MR signal intensity values on T1-weighted TurboFLASH and concentration of Gd-DOTA (Gadoterate, 0.5 mol/mL) was reported by Ca-net et al.5 They investigated a broad range of in-vitro concentrations (0-5.0 mmol/L, Gd-DOTA diluted in saline). MR images were obtained using a 1.5-T MR scanner (Vision, Siemens Medical, Erhlangen, Ger-many) with an inversion time of 300 ms. They showed that the SI increase on T1-weighted images was linearly proportional to the Gd chelate concen-tration at lower concenconcen-trations (≤ 0.8 mmol/L); how-ever, SI response became non-linear at higher con-centrations. In this study, SI was corrected by the correction factor of the coil non-uniformity.
The present results, using the inversion recovery TurboFLASH sequence from the vials indicate that an increase in TI is associated with a decrease in the maximum linear concentration, where r2 is equal to 0.95 or 0.99. The result also shows that at long TI (1944 ms) the maximum linear relationship between SI and concentration is up to 2.84 mmol/L where r2 is 0.95 or up to 1.23 mmol/L where r2 is 0.99 at TR =2s. Fig. 4. A typical result of mean corrected SI from the 9 innermost
pixels of the vials versus concentration of contrast agent. The max-imum linear relationship between concentrations and corrected SI that gave a square correlation (r2) equal to 0.95 and 0.99 were 3.92 and 2.25 mmol/L, respectively at effective TI = 644 ms (TI set = 100 ms). The error bars show the standard deviation of each vial (TR = 2 s).
Fig. 5. The maximum concentration that gives r2 = 0.95 and 0.99 versus effective TI. The linear relationship between SI and con-centration is up to 3.92 and 2.84 mmol/L for short effective TI (644 ms) and long effective TI (1944 ms), respectively (r2 = 0.95). In addition, these values reduce to 2.25 and 1.23 mmol/L for these effective inversion times where r2
These values can increase at short TI.
Although Canet et al.5 found a linear relationship up to 0.8 mmol/L using Gd-DOTA contrast agent at TI = 300 ms (effective TI = 716 ms), our results using Gd-DTPA contrast agent under similar conditions were about 3.75 mmol/L (r2 = 0.95) or 2.25 mmol/L (r2 = 0.99) at TR=2s. It should be noted that the two con-trast agents have roughly the same relaxivity.3
As was mentioned before, the non-uniformity of the coils can affect SI and this contributes to a large error in measuring the SI. Since Canet did not men-tion the correcmen-tion of the non-uniformity of the coil, the difference between the present study and that of Canet et al.'s report may be due to non-uniformity of the coil. Another reason may be due to using differ-ent TR, or a differdiffer-ent value of r2 used to find the max-imum linear relationship between SI and concentra-tion. Neither of these values was quoted by Canet.
In addition, Fritz-Hansen et al.13 found linearity be-tween signal changes and tracer concentrations up to 1.0 mmol/L (r2=0.999), an effective TI of 720 ms using IR TurboFLASH sequence (Linear Phase-Encoding) (TR, Time for one FLASH line = 6.5 ms, TE = 3.0 ms, flip angle = 12˚, effective TI varied between 170 and 2000 ms). They did not mention the actual TR.
Our image parameters are slightly different from the Fritz-Hansen's image parameters. The present
study (Figs. 4 and 5) shows the maximum linearity is about 2.25 and 1.70 for TR =2 and 3 ms, respectively where r2 is 0.99 at the effective TI of 720.
Dean et al.14 and Evan et al.3 reported that this li-nearity is up to 1 mmol/L, but they did not mention how they found this value in detail to compare with the results of this study.
Vallee et al.7 reported the relationship between sig-nal intensity and 1/T1 (in s-1) up to 11 s-1 was linear in FAST sequence. The 1/T1 ratio linearly related to the Gd concentration. Nevertheless, they did not men-tion the exact Gd concentramen-tion to compare with this study.
As mentioned above, different papers have reported different values for the maximum linear relationship between SI and the concentration of contrast agent in T1-weighted imaging. These values varied between
concentrations of 0.8 (inversion recovery)5 and 3
mmol/L (saturation recovery sequence).6
For finding this linearity, the value of the square correlation (r2) which gives the strength of linear re-lationship between SI and concentration is important. The use of r2 to measure the linearity is mentioned with different values in different papers. Takeda et al.6 accepted the value of 0.76 for the linearity and Bourke et al.15 also stated that an r2 equal to 0.74 shows a reasonably strong association between two Fig. 6. A typical result of mean corrected SI from the 9 innermost
pixels of the vials versus concentration of contrast agent. The maxi-mum linear relationship between concentrations and corrected SI that gave a square correlation (r2) equal to 0.95 and 0.99 were 3.50 and 1.84 mmol/L, respectively at effective TI = 644 ms (TI set = 100 ms). The error bars show the standard deviation of each vial (TR = 3 s).
using the T1-weighted technique for measuring blood flow because the changes in SI due to the contrast agent are small; it makes SI time curves very noisy.
The results of this study show that the maximum li-nearity will be increased in short TI and TR, which will improve the perfusion measurement in clinical studies.
This study indicates that in spite of TR=2 or 3s and r2=0.95 or 0.99, at a typical effective TI=800ms, which is normally used for in vivo perfusion, the blood sig-nal is nulled at 1.5-T, the maximum linearity for measuring the perfusion parameters on T1-weighted imaging is about twice that previously reported (i.e.
0.8mmol/L).16-17 The higher dose will improve the
signal to noise ratio in perfusion images.
Conflict of interest
The author has no financial and personal relation-ship with other people or organizations that could inappropriately influence this work.
References
1. Calamante F, Vonken EJ, Van Osch MJ. Contrast agent concentration measurements affecting quantification of bolus-tracking perfusion MRI. Magn Reson Med 2007;58(3):544–53.
2. Paulia M, Saxena V, Haris M, Husain N, Rathore RKS, Gupta RK. Improved T1-weighted dynamic contrast-enhanced MRI to probe
7. Vallee JP, Lazeyras F, Kasuboski L, Chatelain P, Howarth N, Righetti A et al. Quantification of myocardial perfusion with FAST sequence and Gd bolus in patients with normal cardiac function. J Magn Reson Imaging 1999;9(2):197-203.
8. Nazarpoor M, Moody AR, Martel AL, Morgan PS. The relationship between contrast agent concentration and SI on T1 weighted images for measuring perfusion with MRI. MAGMA 2003;16(Suppl 1):243-4. 9. Nessaiver M, editor. All you really need to know about MRI phycics.
1st ed. Maryland: University of Maryland Medical Center; 1997. p. 6-7.
10. Bernstein MA, King KF, Zhou XJ. Handbook of MRI pulse sequences, Academic Press; 2004.
11. Mohamed FB, Vinitski S, Faro SH, Ortega HV, Enochs S. A simple method to improve image nonuniformity of brain MR images at the edges of a head coil. J Comput Assist Tomogr 1999;23(6):1008-12. 12. Kleinbaum DG, Kupper LL, Muller KE, editors. Applied regression
analysis and other multivariable methods. Wadsworth: Duxbury Press; 1998. p. 85-6.
13. Fritz- Hansen T, Rostrup E, Ring P, Larsson HB. Quantification of gadolinium-DTPA concentrations for different inversion times using an IR-turbo flash pulse sequence: A study on optimizing multislice perfusion imaging. Magn Reson Imaging 1998;16(8):893-9.
14. Dean BL, Lee C, Kirsch JE, Runge VM, Dempsey RM, Pettigrew LC. Cerebral hemodynamics and cerebral blood volume: MR assessment using gadolinium contrast agents and T1-weighted Turbo-FLASH im-aging. AJNR Am J Neuroradiol 1992;13(1):39-48.
15. Bourke GJ, Daly LE, Gilvray JM, editors. Interpretation and uses of medical statistics. Oxford: Blakwell Scientific Publications, third edi-tion; 1985.
16. Martel AL, Moody AR. Assessment of brain perfusion using parame-tric and factor images extracted from dynamic contrast-enhanced MR images. In: Book of Abstract: Part of SPIE conference on physiology and function from multidimensional images, Vol 3337. San Diego: 1998. p. 270-80.