See discussions, stats, and author profiles for this publication at:
https://www.researchgate.net/publication/260679871
Weighted approach for multivariate analysis of
variance in measurement system analysis
ARTICLE
in
PRECISION ENGINEERING · JULY 2014
Impact Factor: 1.52 · DOI: 10.1016/j.precisioneng.2014.03.001
CITATIONS
5
READS
81
5 AUTHORS
, INCLUDING:
Rogério Santana Peruchi
Universidade Federal de Goiás
27
PUBLICATIONS21
CITATIONSSEE PROFILE
Anderson Paulo Paiva
Universidade Federal de Itajubá (UNIFEI)
75
PUBLICATIONS360
CITATIONSSEE PROFILE
Pedro Paulo Balestrassi
Universidade Federal de Itajubá (UNIFEI)
61
PUBLICATIONS365
CITATIONSSEE PROFILE
João R. Ferreira
Universidade Federal de Itajubá (UNIFEI)
32
PUBLICATIONS267
CITATIONSSEE PROFILE
All in-text references underlined in blue are linked to publications on ResearchGate, letting you access and read them immediately.
ContentslistsavailableatScienceDirect
Precision
Engineering
j ou rn a l h om epa g e :w w w . e l s e v i e r . c o m / l o c a t e / p r e c i s i o n
Weighted
approach
for
multivariate
analysis
of
variance
in
measurement
system
analysis
R.S.
Peruchi
a,b,c,
A.P.
Paiva
b,
P.P.
Balestrassi
b,∗,
J.R.
Ferreira
b,
R.
Sawhney
caCAPESFoundation,MinistryofEducationofBrazil,Brasília,DF70040-020,Brazil
bInstituteofProductionEngineeringandManagement,FederalUniversityofItajubá,Itajubá,MG37500-903,Brazil cDepartmentofIndustrialandSystemsEngineering,UniversityofTennessee,Knoxville,TN37996,USA
a
r
t
i
c
l
e
i
n
f
o
Articlehistory: Received19July2013
Receivedinrevisedform11January2014 Accepted1March2014
Availableonline11March2014
Keywords:
Measurementsystemanalysis Repeatabilityandreproducibility Multivariateanalysisofvariance Turningprocess
a
b
s
t
r
a
c
t
Inaprocessthatisintegraltoameasurementsystem,somevariationislikelytooccur.Measurement systemanalysisisanimportantareaofstudythatisabletodeterminetheamountofvariation.In evalu-atingameasurementsystem’svariation,themostadequatetechnique,onceaninstrumentiscalibrated, isgaugerepeatabilityandreproducibility(GR&R).Forevaluatingmultivariatemeasurementsystems, however,discussionhasbeenscarce.Someresearchershaveappliedmultivariateanalysisofvariance toestimatetheevaluationindexes;herethegeometricmeanisusedasanagglutinationstrategyfor theeigenvaluesextractedfromvariance–covariancematrices.Thisapproach,however,hassome weak-nesses.Thispaperthusproposesnewmultivariateindexesbasedonfourweightedapproaches.Statistical analysisofempiricalanddatafromtheliteratureindicatesthatthemosteffectiveweightingstrategyin multivariateGR&Rstudiesisbasedonanexplanationofthepercentagesoftheeigenvaluesextracted fromameasurementsystem’matrix.
©2014ElsevierInc.Allrightsreserved.
1. Introduction
Toproperlymonitorandimproveamanufacturingprocess,itis necessarytomeasureattributesoftheprocess’soutput.Forany groupofmeasurementscollectedfor thispurpose, atleast part ofthevariationisduetothemeasurementsystemitself.Thisis becauserepeatedmeasurementsofanyparticularitem occasion-allyresultindifferentvalues[1–7].Toensurethatmeasurement systemvariabilityisnotdetrimentallylarge,itisnecessaryto con-duct measurementsystemanalysis(MSA). Such a studycanbe conductedinvirtuallyanytypeofmanufacturingindustry.MSA helpstoquantifytheabilityofagaugeormeasuringdeviceto pro-ducedatathatsupportsanalyst’sdecision-making requirements
[8].Thepurposeofthisstudyisto(i)determinetheamountof vari-abilityincollecteddatathatisduetothemeasurementsystem,(ii) isolatethesourcesofvariabilityinthemeasurementsystem,and (iii)assesswhetherthemeasurementsystemissuitableforusein abroaderprojectorotherapplications[9,10].AccordingtoHeetal.
∗Correspondingauthor.Tel.:++553588776958.
E-mailaddresses:[email protected](R.S.Peruchi), [email protected](A.P.Paiva),[email protected],
[email protected](P.P.Balestrassi),[email protected](J.R.Ferreira), [email protected](R.Sawhney).
[11],MSAisanimportantelementofSixSigmaaswellasofthe ISO/TS16949standards.
ThemostcommonstudyinMSAtoevaluatetheprecisionof measurementsystemsisgaugerepeatabilityandreproducibility (GR&R).Repeatabilityrepresentsthevariabilityfromthegaugeor measurementinstrumentwhenitisusedtomeasurethesameunit (withthesameoperatororsetuporinthesametimeperiod). Repro-ducibilityreflectsthevariabilityarisingfromdifferentoperators, setups,ortimeperiods[7,10,12–17].Someworksintheliterature
[18–21]haveusedrepeatabilityand/orreproducibilityconcepts; these, however,ignored GR&R statisticalanalysis in comparing measurementsystemvariationtoprocessvariation.These stud-iesinvolvingonlygaugevariabilityareinsufficienttodetermine whetherthemeasurementsystemisabletomonitoraparticular manufacturingprocess.Ifvariationduetothemeasurementsystem issmallrelativetothevariationoftheprocess,thenthe measure-mentsystemisdeemedcapable.Thismeansthesystemcanbe usedtomonitortheprocess[9].GR&Rstudiesmustbeperformed anytimeaprocessismodified.Thisisbecauseasprocess varia-tiondecreases,aonce-capablemeasurementsystemmaynowbe incapable.TwomethodscommonlyusedintheanalysisofaGR&R studyare:(1)analysisofvariance(ANOVA)and(2)XbarandRchart
[5,10].AnalystsprefertheANOVAmethodbecauseitmeasuresthe operator-to-partinteractiongaugeerror—avariationnotincluded intheXbarandRmethod[4].
652 R.S.Peruchietal./PrecisionEngineering38(2014)651–658
Currently,theANOVAmethodforGR&Rstudiescanbeapplied onlytounivariate data[5,22].To discriminateamongproducts, however,manufacturersoftenusemorethana single measure-mentonasingleproductcharacteristic[9].Toestimateevaluation indexesinsuchaGR&Rstudy,theanalystmustconsiderthe cor-relationstructure amongthecharacteristics,a taskmore suited tomultivariatemethods[7].Usingautomotivebodypanel gauge-study data, Majeske [3] demonstrated how to fit multivariate analysisof variance(MANOVA)modelandestimatethe evalua-tionindexestomultivariatemeasurementsystems.Inhisanalysis, it wasshown that themultivariateapproach had resulted in a more practical representation of the errors and ledthe manu-facturertoapprovethegauge.WangandYang[22] presenteda GR&Rstudywithmultiplecharacteristicsusingprincipal compo-nentanalysis(PCA).Theauthorspointedoutthatwhencorrelated quality characteristicsare present a GR&R study must be con-ducted carefully. In this case study,the composite indexes P/T (precision-to-tolerance)and%R&R(percentageofrepeatabilityand reproducibility)withANOVAmethodwereoverestimatedbythe PCAby35.75%and11.54%,respectively.WangandChien[5] ana-lyzeda measurement systemusing a multivariateGR&R study andprovided theconfidenceinterval fortwo measuresP/T and thenumberofdistinctcategories(ndc).Throughacasestudy,the authorsassessedtheperformanceofthreemethods(ANOVA,PCA andPOBREP—process-orientedbasisrepresentation).Theauthors arguedthat POBREP outperformed the others by beingable to identifythecausesofproductionproblems.Peruchietal.[7] pro-posedamultivariateGR&RmethodbasedonweightedPCA.The methodwasappliedtoexperimentalandsimulateddatato com-pareitsperformancetounivariateandmultivariatemethods.The authorsdemonstrated thattheirweightedprincipal component (WPC)methodwasmorerobustthantheothers,consideringnot onlyseveralcorrelationstructuresbutalsodistinctmeasurement systems.
Larsen [23] extended the univariate GR&R study to a com-monmanufacturingtestscenariowheremultiplecharacteristics weretestedoneachdevice.Illustrating withexamplesfroman industrialapplication,theauthorshowedthattotalyield,false fail-ures,andmissed falseestimatescouldleadtoimprovementsin theproductiontestprocessandhencetolowerproductioncosts and,ultimately,tocustomers receivinghigherqualityproducts. Flynnetal.[24]usedregressionanalysistoanalyzethe compar-ativeperformancecapabilitybetweentwofunctionallyequivalent buttechnologicallydifferentautomaticmeasurementsystems.For suchaccuratemeasurementsasrepeatabilityandreproducibility, theauthorsfoundasinappropriatethe“pass/fail”criteriaforthe unitbeingtested.Hence,theyproposedamethodologybasedon PCAandMANOVAtoexaminewhethertherewasastatistically sig-nificantdifferenceamongthemeasurementsystems.Heetal.[11]
proposedaPCA-basedapproachinMSAforthein-process monitor-ingofallinstrumentsinmultisitetesting.Theapproachconsiders afaultyinstrumenttobeonewhosestatisticaldistributionof mea-surementsdifferssignificantlyfromtheoveralldistributionacross multipletestinstruments.Theirapproachcanbeimplementedas anonlinemonitoringtechniquefortestinstrumentssothat,until afaultyinstrumentisidentified,productiongoesuninterrupted. Parenteetal. [25]appliedunivariate and multivariatemethods toevaluaterepeatabilityandreproducibilityofthemeasurement ofreverse phase chromatography (RP-HPLC)peptideprofiles of extractsfromcheddarcheese.Theabilitytodiscriminatedifferent sampleswasassessedaccordingtothesourcesofvariabilityintheir measurementand analysisprocedure. Theauthorsshowedthat theirstudyhadanimportantimpactonthedesignandanalysisof experimentsfortheprofilingofcheeseproteolysis.Inferential sta-tisticaltechniqueshelpedthemanalyzetherelationshipsbetween designvariablesandproteolysis.
Thispaperfocusesonmultivariateanalysisofvariancemethod appliedtoGR&Rstudies(Section2).The relevanceofthistopic liesinthefactthatthevariationofmorecomplexmeasurement systemsmustbeevaluatedbymoresophisticatedmethods.When multiplecorrelatedcharacteristicsarebeingmonitored, multivari-ateanalysisofvariance canbeappliedtomorepreciselyassess ameasurementsystem.Forcalculatingamultivariateevaluation index,however,alimitationcanbefoundwiththegeometricmean strategy.Toestimatethemultivariateevaluationindex,noattempt wasmadetoquantifythegreaterimportancetothemostsignificant pairofeigenvalues,extractedfromvariance–covariancematrices forprocess,measurementsystem,andtotalvariation.Therefore, theaimofthisresearchistocomeupwithsolutionstothis prob-lembyadoptingweightedapproachestoestimatethemultivariate evaluationindex(Section3).Theproblemstatementinthispaper hasbeenraisedwhileassessingcorrelatedroughnessparameters fromtheAISI12L14turningprocess(Sections4and5).Dueto dis-tinctestimatesamongthemultivariateindexes,theauthorshave alsoincludedmorenumericalexamplesfromtheliteraturetoshow howthenewproposedindexesobtainedbetteraccuracy(Section
6).Basedonthelargedatasetanalyzed,theauthorsconcludedthat theweightedapproachesusingtheexplanationpercentagesofthe eigenvaluesextractedfrommeasurementsystemmatrixwerethe mostappropriatestrategyformultivariateGR&Rstudiesassessed bymultivariateanalysisofvariance(Section7).
2. MeasurementsystemanalysisbymultivariateGR&R study
Whenreportingtheresultofameasurementofaphysical quan-tity,itisrequiredthatsomequantitativeindicationofthequality oftheresultbegiventoassessitsreliability.Measurement Uncer-taintyisatermthatisusedinternationallytodescribethequalityof ameasurementvalue.Inessence,uncertaintyisthevalueassigned toameasurementresultthatdescribes,withinadefinedlevelof confidence,therangeexpectedtocontainthetruemeasurement result[26,27].AIAG[4]statesthatthemajordifferencebetween uncertaintyandtheMSAisthattheMSAfocusison understand-ingthemeasurementprocesstopromoteimprovements(variation reduction).MSAdeterminestheamountoferrorintheprocessand assessestheadequacyofthemeasurementsystemforproductand processcontrol.MSAappliesstatisticaltechniquestoquantify pro-cessandmeasurementsystemcomponentsofvariation.Ageneral ANOVAmodelinMSAisrepresentedbyEq.(1)[4,8,9,17,28]:
Y=X+E (1)
In this expression, Y is the measured value of a randomly selectedpartfromamanufacturingprocess,Xisthetruevalueof thepart,andEisthemeasurementerrorattributedtothe measure-mentsystem.ThetermsXandEareindependentnormalrandom variableswithmeanspandmsandvariances2pandms2 ,
respec-tively.Themeanmsisreferredtoasthemeasurementsystem’s
bias.Typically,thisbiascanbeeliminatedbypropercalibrationof thesystem[9].Thus,ifitisassumedms=0,itcanalsobe
con-cludedthatY=p.Ifthisassumptionisviolated,itwillaffectthe
estimationofpbutnottheestimationofthevariances.Sinceina
GR&Rstudythevariancesareofprimaryinterest,theANOVAmodel withpparts,ooperatorsandrreplicatescanbeexpandedtoEq.(2) [6,7,17,29]:
Y=+˛i+ˇj+(˛ˇ)ij+εijk
⎧
⎨
⎩
i=1,2,...,p j=1,2,...,o k=1,2,...,r
(2)
variance for process, ˇj is the variance for operators, (˛ˇ)ij is
thevarianceforprocessandoperatorsinteraction,andεijkisthe
varianceforrepeatability(randomerror).TheANOVAmethodfor GR&Rstudiescanbeappliedtoonesinglequalitycharacteristic only. For measurement systems that are capable of measur-ing q correlated Ys, the model in Eq. (2) turns into a matrix representation,throughmultivariateanalysisofvariance,where
Y=(Y1,Y2,...,Yq) and =(1,2,...,q) are constant vectors; ␣i∼N(0,˛),j∼N(0,ˇ),␣ij∼N(0,˛ˇ),andijk∼N(0,ε)are
randomvectorsstatisticallyindependentofeach other.To esti-matethevariance–covariance matricesinEq.(2),meansquares matrices MSP (process variation), MSO (operator), MSPO (pro-cess×operator interaction) and MSE (random error term) are calculatedassuch,Eqs.(3)–(6):
MSPYaYb= or p−1
p
i=1
( ¯Yai..−Ya¯ ...)( ¯Ybi..−Yb¯ ...)′ (3)
MSOYaYb= pr
(o−1)
o
j=1
( ¯Ya.j.−Ya¯ ...)( ¯Yb.j.−Yb¯ ...)′ (4)
MSPOYaYb = r
(p−1)(o−1)
p
i=1
o
j=1
( ¯Yaij.−Ya¯ i..−Ya¯ .j.+Ya¯ ...)
× ( ¯Ybij.−Yb¯ i..−Yb¯ .j.+Yb¯ ...)′ (5)
MSEYaYb=
1
po(r−1)
p
i=1
o
j=1
r
k=1
(Yaijk−Ya¯ ...)(Ybijk−Yb¯ ...)′ (6)
Intheseexpressions, thesubscriptYaYb referstothepairof
variables for calculating meansquare matrices, Yaijk represents
thekthreadingbyjthoperatoroftheithpartforthemeasurand a. Y a...¯ =
pi=1
oj=1
rk=1Yaijk/por, Y ai..¯ =
oj=1
rk=1Yaijk/or,
¯
Y a.j.=
p i=1 rk=1Yaijk/pr,and ¯Y aij.=
rk=1Yaijk/rindicate
aver-ages taken acrossthe subscripts replaced by a period [30–32]. Then,thevariance–covariancematricesareestimatedforprocess ( ˆp), reproducibility ( ˆreproducibility), repeatability ( ˆrepeatability),
measurementsystem( ˆms)andtotalvariation( ˆt),accordingto
Eqs.(7)–(11):
ˆ
p=ˆ˛= MSP−orMSPO (7)
ˆ
reproducibility=ˇˆ +ˆ˛ˇ=
MSO−MSPO
pr +
MSPO−MSE
r (8)
ˆ
repeatability=ˆε=MSE (9)
ˆ
ms=ˆrepeatability+reproducibilityˆ (10)
ˆ
t=ˆp+ˆms (11)
Iftheinteractioneffectisnotsignificant,themodelofEq.(2)can bereducedtothemodelofEq.(12).Inthiscase,themeansquare matrixofMSEisestimatedbyEq.(13)andvariance–covariance matrices for part (process) and reproducibility (operator) are estimated using, respectively, Eqs. (14) and (15). MSP, MSO,
ˆ
repeatability, ˆmsand ˆtareestimatedusingpreviouslymentioned
Eqs.(3),(4),(9),(10)and(11),respectively.
Y=+␣i+j+ijk
⎧
⎨
⎩
i=1,2,...,p j=1,2,...,o k=1,2,...,r
(12)
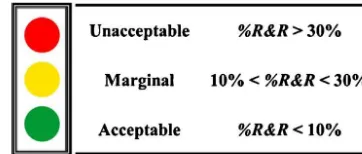
Fig.1.GR&Rcriteriaformeasurementsystemacceptability.
MSEYaYb =
1
por−p−o+1
p
i=1
o
j=1
r
k=1
(Yaijk−Ya¯ i..−Ya¯ .j.+Ya¯ ...)
× (Ybijk−Yb¯ i..−Yb¯ .j.+Yb¯ ...)
′
(13)
ˆ
p=ˆ˛=MSPor−MSE (14)
ˆ
reproducibility=ˇˆ =MSOpr−MSE (15)
The multivariate version of the %R&R index with q charac-teristics proposedby Majeske [3]is called hereG indexand is calculatedbyEq.(16).msi and ti
∀
i=1,2,...,qare eigenval-uesextractedfromvariance-covariancematrices,msandt:G=
qi=1 msi
ti
1
/q×100% (16)
Formeasurementsystemswhosepurposeistoanalyzea pro-cess,ageneralguidelineformeasurementsystemacceptabilityis presentedinFig.1.Ifthemeasurementsystem,accordingtothe index,is<10%,thenitisconsideredacceptable.Ifitisbetween10% and30%,thenitisconsideredmarginal—acceptabledependingon theapplication,thecostofthemeasurementdevice,thecostof repairandotherfactors.Ifthemeasurementsystemexceeds30%, thenitisconsideredunacceptableandshouldbeimproved[3,5,7].
3. MultivariateGR&Rstudyusingweightedapproaches
To obtaintheevaluation indexto themeasurement system, Majeske [3] applied geometricmean to theratio
ms/t.To estimateGindex,noattemptwasmadetoquantifythegreater importancetothemostsignificantpairofeigenvalues,extracted fromvariance-covariancematrices.Amoreaccurateindexwould determineastrategyofweightingtotakeintoconsiderationthe mostsignificantinformationconcerningthems/tratiosand accordinglyrefinethemultivariateindexestimation.Asaresult, thisarticleadoptsweightedapproachesuponms/tratiothat arebasedongeometricandarithmeticmeanstoproposefournew evaluationindexesformultivariatemeasurementsystems.These newindexes,WAt,WAms,WGtandWGms,canbeobtainedbasedonEqs.(17)and(18):
WA=
q
i=1
Wi
ms
i
ti
×100% (17)
WG=
q
i=1
msi
ti
Wi×100% (18)
Inthisexpression,Wi
∀
i=1,...,qaretheexplanationpercentageoftheeigenvaluesextractedfromeither ˆ˙t:Wi=(ti/
qj=1tj)
or ˆ˙ms:Wi=(msi/
q [image:4.612.347.528.56.133.2] [image:4.612.44.286.209.391.2]654 R.S.Peruchietal./PrecisionEngineering38(2014)651–658
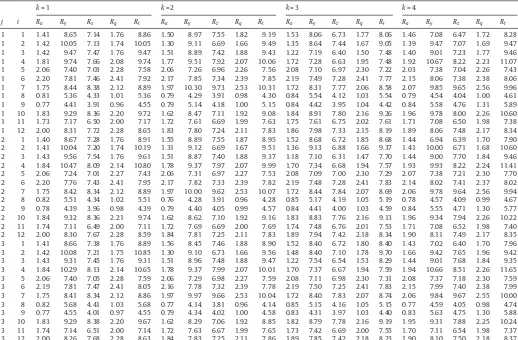
Table1
Roughnessmeasuredfortheturningprocessofmildsteel.
k=1 k=2 k=3 k=4
j i Ra Ry Rz Rq Rt Ra Ry Rz Rq Rt Ra Ry Rz Rq Rt Ra Ry Rz Rq Rt
1 1 1.41 8.65 7.14 1.76 8.86 1.50 8.97 7.55 1.82 9.19 1.53 8.06 6.73 1.77 8.06 1.46 7.08 6.47 1.72 8.28
1 2 1.42 10.05 7.13 1.74 10.05 1.30 9.11 6.69 1.66 9.49 1.35 8.64 7.44 1.67 9.05 1.39 9.47 7.07 1.69 9.47
1 3 1.42 9.47 7.47 1.76 9.47 1.51 8.89 7.42 1.88 9.43 1.22 7.19 6.40 1.50 7.48 1.40 9.01 7.23 1.77 9.46
1 4 1.81 9.74 7.66 2.08 9.74 1.77 9.51 7.92 2.07 10.06 1.72 7.28 6.63 1.95 7.48 1.92 10.67 8.22 2.23 11.07
1 5 2.06 7.40 7.03 2.28 7.58 2.06 7.26 6.96 2.26 7.56 2.08 7.10 6.97 2.30 7.22 2.03 7.38 7.04 2.26 7.43
1 6 2.20 7.81 7.46 2.41 7.92 2.17 7.85 7.34 2.39 7.85 2.19 7.49 7.28 2.41 7.77 2.15 8.06 7.38 2.38 8.06
1 7 1.75 8.44 8.38 2.12 8.89 1.97 10.30 9.73 2.53 10.31 1.72 8.31 7.77 2.06 8.58 2.07 9.85 9.65 2.56 9.96
1 8 0.81 5.36 4.33 1.01 5.36 0.79 4.29 3.91 0.98 4.30 0.84 5.54 4.12 1.03 5.54 0.79 4.54 4.04 1.00 4.61
1 9 0.77 4.41 3.91 0.96 4.55 0.79 5.14 4.18 1.00 5.15 0.84 4.42 3.95 1.04 4.42 0.84 5.58 4.76 1.31 5.89
1 10 1.83 9.29 8.36 2.20 9.72 1.62 8.47 7.11 1.92 9.08 1.84 8.91 7.80 2.16 9.26 1.96 9.78 8.00 2.26 10.60
1 11 1.73 7.17 6.50 2.00 7.17 1.72 7.61 6.69 1.99 7.63 1.75 7.61 6.75 2.02 7.61 1.71 7.08 6.50 1.98 7.38
1 12 2.00 8.31 7.72 2.28 8.65 1.83 7.80 7.24 2.11 7.83 1.86 7.98 7.33 2.15 8.19 1.89 8.06 7.48 2.17 8.34
2 1 1.40 8.67 7.28 1.76 8.91 1.55 8.89 7.55 1.87 8.95 1.52 8.68 6.72 1.85 8.68 1.44 6.94 6.39 1.70 7.90
2 2 1.41 10.04 7.20 1.74 10.19 1.31 9.12 6.69 1.67 9.51 1.36 9.13 6.88 1.66 9.37 1.41 10.00 6.71 1.68 10.60
2 3 1.43 9.56 7.54 1.76 9.61 1.51 8.87 7.40 1.88 9.37 1.18 7.10 6.31 1.47 7.70 1.44 9.00 7.70 1.84 9.46
2 4 1.84 10.47 8.09 2.14 10.80 1.78 9.37 7.97 2.07 9.99 1.70 7.34 6.68 1.94 7.57 1.93 9.93 8.22 2.24 11.41
2 5 2.06 7.24 7.01 2.27 7.43 2.06 7.31 6.97 2.27 7.53 2.08 7.09 7.00 2.30 7.29 2.07 7.38 7.21 2.30 7.70
2 6 2.20 7.76 7.43 2.41 7.95 2.17 7.82 7.33 2.39 7.82 2.19 7.48 7.28 2.41 7.83 2.14 8.02 7.41 2.37 8.02
2 7 1.75 8.42 8.34 2.12 8.89 1.97 10.00 9.62 2.53 10.07 1.72 8.44 7.84 2.07 8.69 2.06 9.78 9.64 2.56 9.94
2 8 0.82 5.51 4.34 1.02 5.51 0.76 4.28 3.91 0.96 4.28 0.85 5.17 4.19 1.05 5.19 0.78 4.57 4.09 0.99 4.67
2 9 0.78 4.39 3.96 0.98 4.39 0.79 4.40 4.05 0.99 4.57 0.84 4.41 4.00 1.03 4.59 0.84 5.55 4.71 1.30 5.77
2 10 1.84 9.32 8.36 2.21 9.74 1.62 8.62 7.10 1.92 9.16 1.83 8.83 7.76 2.16 9.13 1.96 9.34 7.94 2.26 10.22
2 11 1.74 7.11 6.49 2.00 7.11 1.72 7.69 6.69 2.00 7.69 1.74 7.48 6.76 2.01 7.53 1.71 7.08 6.52 1.98 7.40
2 12 2.00 8.30 7.67 2.28 8.59 1.84 7.81 7.25 2.11 7.83 1.89 7.94 7.42 2.18 8.34 1.90 8.11 7.49 2.17 8.35
3 1 1.41 8.66 7.38 1.76 8.89 1.56 8.45 7.46 1.88 8.90 1.52 8.40 6.72 1.80 8.40 1.43 7.02 6.40 1.70 7.96
3 2 1.42 10.08 7.21 1.75 10.85 1.30 9.10 6.73 1.66 9.56 1.48 8.40 7.10 1.78 9.70 1.66 9.42 7.65 1.96 9.42
3 3 1.43 9.31 7.45 1.76 9.31 1.51 8.96 7.48 1.88 9.47 1.22 7.54 6.54 1.53 8.29 1.44 9.01 7.68 1.84 9.35
3 4 1.84 10.29 8.13 2.14 10.65 1.78 9.37 7.99 2.07 10.01 1.70 7.37 6.67 1.94 7.59 1.94 10.66 8.51 2.26 11.65
3 5 2.06 7.40 7.05 2.28 7.59 2.06 7.29 6.98 2.27 7.59 2.08 7.11 6.98 2.30 7.31 2.08 7.37 7.18 2.30 7.59
3 6 2.19 7.81 7.47 2.41 8.05 2.16 7.78 7.32 2.39 7.78 2.19 7.50 7.25 2.41 7.83 2.15 7.99 7.40 2.38 7.99
3 7 1.75 8.41 8.34 2.12 8.86 1.97 9.97 9.66 2.53 10.04 1.72 8.40 7.83 2.07 8.74 2.06 9.84 9.67 2.55 10.00
3 8 0.82 5.68 4.41 1.03 5.68 0.77 4.14 3.81 0.96 4.14 0.85 5.15 4.16 1.05 5.15 0.77 4.59 4.05 0.98 4.74
3 9 0.77 4.55 4.01 0.97 4.55 0.79 4.34 4.02 1.00 4.58 0.83 4.31 3.97 1.03 4.40 0.83 5.63 4.75 1.30 5.88
3 10 1.83 9.29 8.38 2.20 9.67 1.62 8.29 7.06 1.92 8.85 1.82 8.79 7.78 2.16 9.19 1.95 9.31 7.88 2.25 10.24
3 11 1.74 7.14 6.51 2.00 7.14 1.72 7.63 6.67 1.99 7.65 1.73 7.42 6.69 2.00 7.55 1.70 7.11 6.54 1.98 7.37
3 12 2.00 8.26 7.68 2.28 8.63 1.84 7.83 7.25 2.11 7.86 1.89 7.85 7.42 2.18 8.23 1.90 8.10 7.50 2.18 8.37
obtainedby calculating the weighted arithmetic mean accord-ingtoEq.(17).Thefirstindex,WAt,weightsthe
ms/t ratio using the explanation percentage of the eigenvalues extracted fromtotalvariationmatrix( ˆt).Thesecondindex,WAms,weights
the
ms/t ratio through the explanation percentage of the eigenvaluesextracted frommeasurement system matrix ( ˆms).On the other hand, the WGt and WGms indexes are calculated
usingweightedgeometricmeaninEq.(18).Thefirstindex,WGt,
weightsthe
ms/t ratiousingtheexplanationpercentage of theeigenvaluesextracted fromtotal variation matrix ( ˆt).Thesecond index, WGms, weights the
ms/t ratio through theexplanationpercentage oftheeigenvaluesextractedfrom mea-surement system matrix ( ˆms). The acceptance criteria of the
multivariatemeasurement systemarethesameasdescribed in Section2.
4. Experimentalsetup
Whenstructuralintegrityisnotthemostimportant require-mentofaproduct(e.g.,appliances,componentstopumps,plugs, andconnections),manufacturershaveusedmildsteels.In produc-ingsuchgoods,themanufacturingprocessincludessuchfeatures assatisfactoryductility,strength,andthermaltreatmentbehavior aswellasgoodmachiningconditionsand excellentchip forma-tion[33].Researchershaverecentlygivenattentiontotheeffectof noisefactorsinsurfacefinishingforturningprocesses[34].The qualityofthesurfacefinishingofa workpiececanbeassessed throughroughnessparameterssuchas: Ra (arithmeticaverage),
Ry(maximum),Rz(tenpointheight),Rq(rootmeansquare),and
Rt (maximumpeak tovalley).For this empiricalstudy,the
tur-ningprocesswithfivecritical-to-quality characteristicsconsists ofamultivariateGR&Rstudy.Thestudyinvestigateswhetherthe variationoftheroughnesscheckerandthemeasurement proce-dureissignificantlysmallerthantheprocessvariationprovided bythenoiseconditions(slendernessofthepart,measuring posi-tion,andtoolwear).Theslenderness(S)relatesthediameter(D)to thelength(L)ofthepart,accordingtotherelationS=L/D.Theparts wereclassifiedasslenderandnon-slender,forthesamepartlength, withD=30mmandD=50mm,respectively.Thestudyadoptedthe followingregionsofmeasurement:closetothemainspindle,the center,andclosetothebarrel.Thetoolwearnoiseconsidereda newtooland aworntool, whichwasmeasuredontheedgeof approximately0.3mm[7].
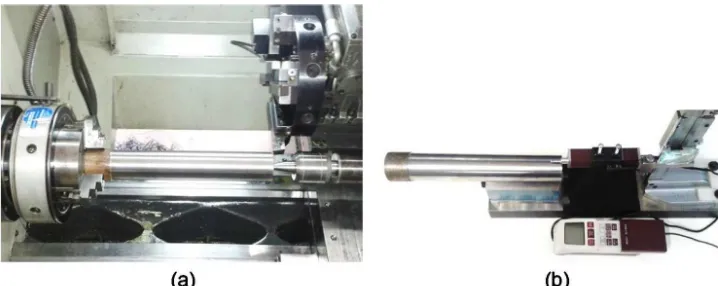
Theexperimentsweresetupasfollows.Theworkpieces,AISI 12L14(0.09%C,0.03%Si,1.24%Mn,0.046%P,0.273%S,0.15%Cr, 0.08%Ni,0.26%Cu,0.001%Al,0.02%Mo,0.28%Pb,0.0079%N2),were machinedonaNARDINICNClathe(seeFig.2(a))with7.5cvpower andmaximumrotationof 4000rpm.Themachiningparameters usedinthisstudywereacuttingspeedof345mmin−1,afeedrate
of0.086mmrev−1,andadepthofcutof0.680mm.Carbideinserts
wereusedofISOP35class,coatedwiththreetoppings[Ti(C,N), Al2O3,TiN],(GCSandvik4035)geometryISOSNMG0903 04–
[image:5.612.37.555.75.415.2]Fig.2.(a)MildsteelmachinedonaNARDINICNClathewithconventionalrollerbearingsand(b)MitutoyoportableroughnesscheckermodelSurftestSJ-201P.
Table2
Measurementsystemclassificationthroughtheunivariatemethod.
Source Ra Ry Rz Rq Rt
p 0.444 1.564 1.383 0.456 1.696
ms 0.082 0.646 0.428 0.111 0.643
t 0.452 1.693 1.448 0.470 1.813
%R&R 18.22 38.18 29.52 23.66 35.47
5. Resultanalysis
Initially, theroughness measurements in Table1 were ana-lyzedusingaunivariateapproachaccordingtotheANOVAmodel inEq. (2).Variationcomponentsforprocess, measurement sys-tem,andtotalwerecomputedandstoredasstandarddeviationsin
Table2.RyandRtclassifiedthemeasurementsystemas
unaccept-able,whilstRa,RzandRqasmarginal.Assessingtheentiredatasetin Table1,thecorrelationstructureamongtheroughnessparameters wasdeemedsignificant,multivariateanalysisshouldbeperformed so(seeTable3).
ThedatasetinTable1wasstandardizedusing(Yi−Y¯)/Y
∀
i=1,...,ntominimizetheeffectofhavingvariablesindifferentscales forthemultivariateanalysis.Thispretreatmentdeterminesthatall roughnessparametersareconsideredequallyimportant[35].The interactioneffectwasnotsignificantfor0.05ofsignificancelevel; consequently,atwo-wayMANOVAmodelwithoutinteractionwas adjustedtothemultivariatedataset,accordingtoEq.(12).First, meansquarematriceswerecalculatedusingEqs.(3),(4)and(13). TheseresultsobservedinEqs.(19)–(21)werethenappliedtoobtain variance-covariancematricesforprocess(p),measurement
sys-tem(ms)andtotalvariation(t)usingtheEqs.(10),(11)and(14).
Table3
Roughnessparameters’correlations.
Ra Ry Rz Rq Rt
Ra1.000 – Ry0.621a
0.000b
1.000 – Rz0.819
0.000
0.906 0.000
1.000 – Rq0.985
0.000 0.701 0.000 0.891 0.000 1.000 – Rt0.601
0.000 0.989 0.000 0.892 0.000 0.681 0.000 1.000 –
aPearsoncorrelation bp-value.
Compositionsofthemeansquareandvariance-covariancematrices followthesamestructureofthecorrelationmatrixinTable3:
MSP=
⎛
⎜
⎜
⎜
⎜
⎝
12.557 8.139 10.401 12.397 8.139 11.803 11.239 9.106 10.401 11.239 12.500 11.165 12.397
7.756
9.106 11.596
11.165 10.953
12.500 8.731
7.756 11.596 10.953 8.731 11.517
⎞
⎟
⎟
⎟
⎟
⎠
(19) MSO=⎛
⎜
⎜
⎜
⎜
⎝
0.002 −0.004 0.003 0.002
−0.004 0.011 −0.004 −0.004 0.003 −0.004 0.003 0.003 0.002
0.006
−0.004
−0.014
0.003 0.006
0.002 0.006
0.006
−0.014 0.006 0.006 0.018
⎞
⎟
⎟
⎟
⎟
⎠
(20) MSE=⎛
⎜
⎜
⎜
⎜
⎝
0.037 0.028 0.043 0.039 0.028 0.101 0.061 0.037 0.043 0.061 0.081 0.051 0.039
0.029 0.037 0.105
0.051 0.072
0.042 0.040
0.029 0.105 0.072 0.040 0.125
⎞
⎟
⎟
⎟
⎟
⎠
(21)Eigenvaluesextractedfromp,ms,andtmatrices,inTable4,
are required to estimate the multivariate evaluation index for assessingthismeasurementsystem.UsingEq.(16)andeigenvalues inTable4,G=44.64%classifiedthemeasurementsystemas unac-ceptable. Nevertheless, whencompared tothe univariate %R&R indexes,G=44.64%seemstomisestimatethemultivariateindex forassessingthemeasurementsystem.Therefore,fourmultivariate indexeswereproposedinadditiontotheGindex.Asimple geo-metricmeandoesnotdeterminegreaterimportancetothemost significantpairofeigenvalues,extractedfromvariance–covariance matrices.Thus,WAt,WAms,WGtandWGmswerecalculatedusing
weightedapproachesupon
ms/tratio.AccordingtoEqs.(17) and(18),thenewmultivariateindexesareshowninEqs.(22)–(25):WAt = 29.8×0.845+23.7×0.137+39.9×0.015+88.8
× 0.002+70.7×0.001=29.30% (22)
WAms = 29.8×0.860+23.7×0.088+39.9×0.027+88.8
× 0.019+70.7×0.006=30.92% (23)
WGt =29.80.845×23.70.137×39.90.015×88.80.002×70.70.001
[image:6.612.125.484.55.198.2] [image:6.612.313.564.255.454.2] [image:6.612.41.295.620.724.2]656 R.S.Peruchietal./PrecisionEngineering38(2014)651–658
Table4
EigenvaluesandWiofthevariance-covariancematrices ˆp, ˆmsand ˆt.
Eigenvalues
Sourcesofvariation 1(W1b) 2(W2) 3(W3) 4(W4) 5(W5)
Process ˙ˆp=
⎛
⎜
⎝
1.043a 0.676 0.863 1.030 0.676 0.975 0.932 0.756 0.863 0.932 1.035 0.926 1.030
0.644 0.756 0.958
0.926 0.907
1.038 0.724
0.644 0.958 0.907 0.724 0.949
⎞
⎟
⎠
4.195(85.0) 0.673(13.6) 0.063(1.3) 0.002(0.0) 0.000(0.0)Measurementsystem ˙ˆms=
⎛
⎜
⎝
0.037 0.027 0.042 0.038 0.027 0.099 0.059 0.036 0.042 0.059 0.079 0.050 0.038
0.028 0.036 0.103
0.050 0.070
0.041 0.039
0.028 0.103 0.070 0.039 0.123
⎞
⎟
⎠
0.406(86.0) 0.042(8.8) 0.013(2.7) 0.009(1.9) 0.003(0.6)Totalvariation ˙ˆt=
⎛
⎜
⎝
1.080 0.703 0.905 1.068 0.703 1.074 0.991 0.792 0.905 0.991 1.114 0.977 1.068
0.672 0.792 1.061
0.977 0.977
1.080 0.764
0.672 1.061 0.977 0.764 1.072
⎞
⎟
⎠
4.567(84.5) 0.743(13.7) 0.079(1.5) 0.011(0.2) 0.006(0.1)aStandardizeddata. b W
i=(i/
qj=1j)×100% i=1,2,...,q.
WGms=29.80.860×23.70.088×39.90.027×88.80.019×70.70.006
=30.23% (25)
TocompareGindextomultivariateindexesproposedinthis paper,the95%confidenceintervalwascomputedusingEq.(26) [7]:
CI=Y¯±tN−1,˛/2√s
N (26)
Inthisexpression, ¯Yisthemeanof%R&RbetweenY1,Y2,Y3,
andY4;sisthestandarddeviation;NisthesamplesizeandtN−1,˛is
the(1–˛)100thpercentileofatdistributionwith(N−1)degrees offreedom.
Whencomparedtothe95%confidenceinterval[18.797;39.23] obtainedbyunivariateindexes,Gindexseemstomisestimatethe multivariateevaluationindex.Additionalindexesproposedinthis articleseemtoobtainmorecoherentresultsinassessing multi-variateGR&Rstudies,sinceallindexeswerecalculatedinsidethe 95%confidenceinterval.Duetothesefindings,additional numeri-calexamplestakenfromtheliteraturewereconsideredtoexamine morescenariosinvolvingmeasurementsystems andcorrelation structuresamongYs.
6. Additionalnumericalexamples
6.1. Automotivebodystamped-panelmeasurementsystem
Majeske [3]presented an industrialapplication in which an automobilemanufacturer constructeda hard gauge tomeasure fourYs on a sheet-metal body panel. Hisstudy consisted of a GR&Rstudywithp=5parts,o=2operators,and r=3replicates. Thecritical-to-qualitycharacteristics“M”inhispaperwerecalled hereY.AdjustingthedatatoanANOVAmodel,the%R&Rindexesfor themeasurementsystemwere:%R&RY1=22.20%,%R&RY2=15.66%,
%R&RY3=15.09%and%R&RY4=9.26%.Now,consideringthe
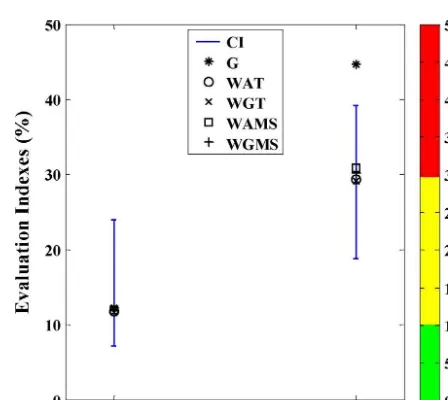
corre-lationstructureamongtheYs,asingleindexthatrepresentedthe multivariatemeasurementsystemwascalculated.Theresultwas G=12.28%.ThesamecriterioninEq.(26)wasappliedtoassessthe indexes’adequacy.TheresultsforG,WAt,WAms,WGt andWGms
wereestimatedforbothturningprocess(Section5)andautomotive bodystamped-panel(Section6.1)andarepresentedinFig.3.
AscanbeseenfromFig.3,nosignificantdifferenceswerefound amongthemultivariateindexesfortheautomobilemanufacturer data.Allindexes werecalculatedinside theconfidence interval [7.13%;23.97%].However,turningbacktotheexperimental evi-denceintheturningprocess,amotivationlingeredtoinvestigate whyGindexwasestimatedfarfromtheconfidenceinterval.
6.2. Asimulationstudy
A recent work by Peruchi et al. [7] provided a simulation studyforamultivariateGR&Rstudyusingthesamesetupasthat usedinMajeske[3].Intheirarticle,15scenariosweresimulated consideringbothseveralcorrelationstructuresforYsand differ-enttypesofmeasurementsystems.Threetypesofmeasurement systemswereconsidered:acceptable(AC:%R&R<10%),marginal (MA:10%<%R&R<30%),andunacceptable(UN:%R&R>30%).The correlationstructurewereclassifiedas:verylow(VL:W1≤65%),
low (L: 65%<W1≤75%), medium (M:75%<W1≤85%), high(H:
85%<W1≤95%),and veryhigh(VH:W1>95%).W1 istheresult
obtainedfromT1/
qj=1Tj.Thecriteriontoassessindexes’
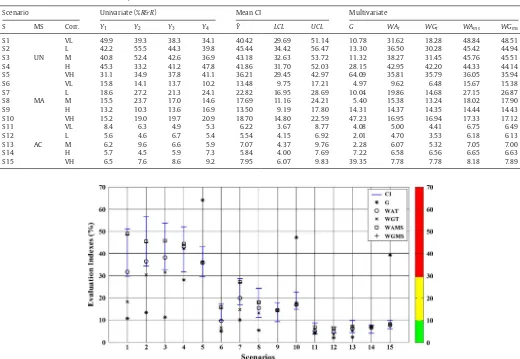
ade-quacywasthesame asin Eq.(26).Table5 shows theirresults andtheestimatesofthefourweightedapproachesarealsoadded.
[image:7.612.31.560.75.239.2] [image:7.612.314.538.518.718.2]Table5
Resultsforcalculationsofunivariateindex,95%confidenceintervalandmultivariateindexes.
Scenario Univariate(%R&R) MeanCI Multivariate
S MS Corr. Y1 Y2 Y3 Y4 Y¯ LCL UCL G WAt WGt WAms WGms
S1 VL 49.9 39.3 38.3 34.1 40.42 29.69 51.14 10.78 31.62 18.28 48.84 48.51
S2 L 42.2 55.5 44.3 39.8 45.44 34.42 56.47 13.30 36.50 30.28 45.42 44.94
S3 UN M 40.8 52.4 42.6 36.9 43.18 32.63 53.72 11.32 38.27 31.45 45.76 45.51
S4 H 45.3 33.2 41.2 47.8 41.86 31.70 52.03 28.15 42.95 42.20 44.33 44.14
S5 VH 31.1 34.9 37.8 41.1 36.21 29.45 42.97 64.09 35.81 35.79 36.05 35.94
S6 VL 15.8 14.1 13.7 10.2 13.48 9.75 17.21 4.97 9.62 6.48 15.67 15.38
S7 L 18.6 27.2 21.3 24.1 22.82 16.95 28.69 10.04 19.86 14.68 27.15 26.87
S8 MA M 15.5 23.7 17.0 14.6 17.69 11.16 24.21 5.40 15.38 13.24 18.02 17.90
S9 H 13.2 10.3 13.6 16.9 13.50 9.19 17.80 14.31 14.37 14.35 14.44 14.43
S10 VH 15.2 19.0 19.7 20.9 18.70 14.80 22.59 47.23 16.95 16.94 17.33 17.12
S11 VL 8.4 6.3 4.9 5.3 6.22 3.67 8.77 4.08 5.00 4.41 6.75 6.49
S12 L 5.6 4.6 6.7 5.4 5.54 4.15 6.92 2.01 4.70 3.53 6.18 6.13
S13 AC M 6.2 9.6 6.6 5.9 7.07 4.37 9.76 2.28 6.07 5.32 7.05 7.00
S14 H 5.7 4.5 5.9 7.3 5.84 4.00 7.69 7.22 6.58 6.56 6.65 6.63
S15 VH 6.5 7.6 8.6 9.2 7.95 6.07 9.83 39.35 7.78 7.78 8.18 7.89
Fig.4.Multivariateevaluationindexesestimatedfor15distinctscenarios.
Moreover,Fig.4graphicallypresentshowaccuratethemultivariate indexeswereestimatedcomparedtothe95%confidenceinterval. InthesamemannerasPeruchietal.[7],thisstudywillleadthe anal-ysisandcomparisonintwoways:intra-andinter-indexes.Froma generalperspective,theintra-indexanalysiswillshowanoverview oftheindexes’performance;theinter-indexanalysis,incontrast, willpresentamoredetailedassessmentaddressingtheindexes’ deviationsfromtheconfidenceintervals.
The intra-index analysis verified that the WAms and WGms
indexesweremoreaccuratethanG,WAt,andWGt.Onlyin
scenar-iosS9,S11,andS14wasGindexestimatedwithintheconfidence interval. WAt and WGt indexes failed in one and six scenarios,
respectively.As canbeseen inFig. 4,WAms and WGms indexes
wereestimatedwithintheconfidenceintervalinall15scenarios evaluated.
Fortheinter-indexanalysis,Gindexwasverifiedtobecalculated withintheconfidenceintervalinonlyS9,S11,andS14scenarios. Thisindexwasobtainedusinggeometricmeanofthe
ms/tratioaccordingtotheamountofqualitycharacteristics.Geometric meanprovidesthesamedegreeofimportanceintheanalysisof eachpairofeigenvalues.AsPeruchietal.[7]havealreadyproved thatGindexmaynotrepresentwelltheperformanceofthe mea-surementsystemiftheindividualratio
ms/t foreachpairof eigenvalues,extractedfrom ˆmsand ˆt,providedifferentinter-pretations.Itisessentialtoemphasize thatthefirsteigenvalues haveagreaterpercentageofexplainingthemeasuredphenomenon thandothelast.Therefore,weightedapproachesinmultivariate
analysisofvarianceforGR&RstudieswereproposedtoimproveG indexestimation.
In the inter-index analysis by WAt and WGt, the weighted
approachthroughtheexplanationpercentageoftheeigenvalues extractedfrom ˆt:Wi=(ti/
qj=1tj)wasunsatisfactory.These
indexes(mainlyWGt)failedinscenarioswithcorrelationsdeemed
lowerduetohigherweightsassignedtolesssignificant
ms/tratios.
In the inter-index analysis by WAms and WGms, the
expla-nation percentage of the eigenvalues extracted from ˆms: Wi=(msi/
qj=1msj)proved tobethemosteffectiveweighted
approach for assessing a multivariate measurement system. In mostscenarios,thefirstpairofeigenvaluestocalculate
ms/tratioreceiveda greaterdegreeofimportance,including scenar-ioswithalowercorrelationstructure.Conceptually,theweighted approach using theexplanation percentages ofthe eigenvalues extractedfromthemeasurementsystemmatrixmakemoresense thanfromthetotalvariationmatrix,inestimatingtheevaluation indexforGR&Rstudies.
7. Conclusions
[image:8.612.47.567.70.429.2]658 R.S.Peruchietal./PrecisionEngineering38(2014)651–658
proposenewmultivariateindexesbasedonweightedapproaches toovercomesuchdrawbacks.Theempiricalfindingssuggestthat Gindex maymisclassify themultivariatemeasurement system duetoitssignificantshiftfromtheunivariateestimates.In this case, G=44.64% was estimated outside the confidence interval [18.78%;39.23%].Analyzingthefirstliteraturedataset,no signifi-cantdifferenceswerefoundbetweenGindexesandtheweighted indexesproposedinthisstudy.Allindexeswerecalculatedinside theconfidenceinterval[7.13%;23.97%].However,thesecond lit-eraturedatasetpresentedstrongevidenceofGindexlimitations andWAmsandWGmsasbeingthebestweightedindexes.Taking
intoaccounttheempiricalandliteraturefindings,WAmsandWGms
betterestimatedthemultivariateevaluationindexthandidG,WAt
andWGt.Thisisbecausethefirstpairofeigenvaluestocalculate
ms/t ratioreceivedagreaterdegreeofimportance, includ-ingscenarioswithlowercorrelations.Accordingly,theweighted approachusingthevariationinregardtothemeasurement sys-temmatrix wasshown to bethe bestmanner toestimatethe evaluationindexinmultivariateGR&RstudieswiththeMANOVA method.
Further research might explore the effectiveness of using weightedapproachestoestimateotherevaluationindexes(ndcand P/T,forexample)inmultivariateGR&Rstudies.Inthiswork,only theMANOVAmethodwasappliedtoassessmeasurementsystems. Afurtherstudycouldalsocomparemultivariateevaluationindexes obtainedusingMANOVAandPCAmethods.
Acknowledgments
Fortheirsupportinthisresearch,theauthorswouldliketothank FAPEMIG,CNPqand,mainly,CAPES(throughitsdoctorate “sand-wich”program,Fellow–Processnumber12944/12-2).Inaddition, theauthorswishtogratefullyacknowledgerefereesofthispaper, whohelpedclarifyandimproveitspresentation.
AppendixA. Supplementarydata
Supplementarymaterialrelated tothis article canbefound, intheonlineversion,athttp://dx.doi.org/10.1016/j.precisioneng. 2014.03.001.
References
[1]SenolS.Measurementsystemanalysisusingdesignedexperimentswith min-imum˛–ˇrisksandn.Measurement2004;36:131–41.
[2]WoodallWH,BorrorCM.SomerelationshipsbetweengageR&Rcriteria.Qual ReliabEngInt2008;24:99–106.
[3]MajeskeKD.Approvalcriteriaformultivariatemeasurementsystems.JQual Technol2008;40:140–54.
[4]AIAG.Measurementsystemsanalysis:referencemanual.4thed.Detroit,MI, USA:AutomotiveIndustryActionGroup;2010.
[5]WangFK,ChienTW.Process-orientedbasisrepresentationforamultivariate gaugestudy.ComputIndEng2010;58:143–50.
[6]Al-RefaieA,BataN.EvaluatingmeasurementandprocesscapabilitiesbyGR&R withfourqualitymeasures.Measurement2010;43:842–51.
[7]PeruchiRS,BalestrassiPP,PaivaAP,FerreiraJR,CarmelossiMS.Anew mul-tivariate gageR&R methodforcorrelatedcharacteristics.IntJProd Econ 2013;144:301–15.
[8]MajeskeKD.Two-sampletestsforcomparingmeasurementsystems.QualEng 2012;24:501–13.
[9]BurdickRK,BorrorCM,MontgomeryDC.DesignandanalysisofgaugeR&R stud-ies:makingdecisionswithconfidenceintervalsinrandomandmixedANOVA models.ASA-SIAMseriesonstatisticsandappliedprobability.Philadelphia,PA, USA:SocietyforIndustrialandAppliedMathematics;2005.
[10]BurdickRK,BorrorCM,MontgomeryDC.Areviewofmethodsformeasurement systemscapabilityanalysis.JQualTechnol2003;35:342–54.
[11]HeSG,WangGA,CookDF.Multivariatemeasurementsystemanalysisin mul-tisitetesting:anonlinetechniqueusingprincipalcomponentanalysis.Expert SystAppl2011;38:14602–8.
[12]PoliniW,TurchettaS.Testprotocolformicro-geometricwearofsintered dia-mondtools.Wear2004;257:246–56.
[13]WuCW,PearnWL,KotzS.Anoverviewoftheoryandpracticeonprocess capabilityindexesforqualityassurance.IntJProdEcon2009;117:338–59. [14]AwadM,ErdmannTP,ShanshalY,BarthB.Ameasurementsystemanalysis
approachforhard-to-repeatevents.QualEng2009;21:300–5.
[15]ErdmannTP,DoesRJMM,BisgaardS.Qualityquandaries:agageR&Rstudyin ahospital.QualEng2010;22:46–53.
[16]Kaija K, Pekkanen V, Mäntysalo M,Koskinen S,Niittynen J, Halonen E, etal.Inkjettingdielectriclayerforelectronicapplications.MicroelectronEng 2010;87:1984–91.
[17]WeaverBP,HamadaMS,VardemanSB,WilsonAG.ABayesianapproachtothe analysisofgaugeR&Rdata.QualEng2012;24:486–500.
[18]GrejdaR,MarshE,VallanceR.Techniquesforcalibratingspindleswith nano-metererrormotion.PrecisEng2005;29:113–23.
[19]ParkerDH,AndersonR,EganD,FakesT,RadcliffB,SheltonJW.Weighingthe world’sheaviesttelescopeateightpointswithcorrectionsforlifting perturba-tions.PrecisEng2005;29:354–60.
[20]Piratelli-FilhoA,FernandesFHT,ArencibiaRV.Applicationofvirtualspheres plateforAACMMsevaluation.PrecisEng2012;36:349–55.
[21]XiaoM,TakamuraT,TakahashiS,TakamasuK.Randomerroranalysisofprofile measurementoflargeasphericopticalsurfaceusingscanningdeflectometry withrotationstage.PrecisEng2013;37:599–605.
[22]WangFK,YangCW.ApplyingprincipalcomponentanalysistoaGR&Rstudy.J ChinInstIndEng2007;24:182–9.
[23]LarsenGA.Measurementsystemanalysisinaproductionenvironmentwith multipletestparameters.QualEng2003–2004;16(2):297–306.
[24]FlynnMJ,SarkaniS,MazzuchiTA.Regressionanalysisofautomatic measure-mentsystems.IEEETransInstrumMeas2009;58:3373–9.
[25]ParenteE,PatelH,CaldeoV,PirainoP,McSweeneyPLH.RP-HPLCpeptide profilingofcheeseextracts:astudyofsourcesofvariation,repeatabilityand reproducibility.FoodChem2012;131:1552–60.
[26]ISO/IECGUM:2008.Guidetotheexpressionofuncertaintyinmeasurements. Geneva,Switzerland:InternationalOrganizationforStandardization;2008. [27]ISO/TS14253-2:1999.Geometricalproductspecifications(GPS)–inspection
bymeasurementofworkpiecesandmeasuringequipment–Part2.Guideto theestimationofuncertaintyinGPSmeasurement,calibrationofmeasuring equipmentandproductverification.Geneva,Switzerland:International Orga-nizationforStandarization;1999.
[28]MajeskeKD.Approvingvision-basedmeasurementsystemsinthepresenceof within-partvariation.QualEng2012;24:49–59.
[29]DeldossiL,ZappaD.Measurementuncertaintywithnestedmixedeffect mod-els.QualReliabEngInt2011;27:373–9.
[30]JohnsonRA,WichernDW.Appliedmultivariatestatisticalanalysis.6thed.New Jersey:PearsonPrentice-Hall;2007.
[31]RencherAC.Methodsofmultivariateanalysis.2nded.NewJersey:JohnWiley andSons;2002.
[32]ScagliariniM.Multivariateprocesscapabilityusingprincipalcomponent anal-ysisinthepresenceofmeasurementerrors.AdvStatAnal2011;95:113–28. [33]GomesJHF,Salgado JrAR,PaivaAP, FerreiraJR,CostaSC,BalestrassiPP.
Globalcriterionmethodbasedonprincipalcomponentstotheoptimization ofmanufacturingprocesseswithmultipleresponses.StrojVestn–JMechEng 2012;58(5):345–53.
[34]PaivaAP,CamposPH,FerreiraJR,LopesLGD,PaivaEJ,BalestrassiPP.A mul-tivariaterobustparameterdesignapproachforoptimizationofAISI52100 hardenedsteelturningwithwipermixedceramictool.IntJRefractMetH 2012;30:152–63.