i
A NEW APPROACH FOR INDUSTRIAL PRODUCT INSPECTION BASED ON COMPUTER VISION AND IMAGE PROCESSING TECHNIQUE
MOHD KHAIRULDIN BIN HASSAN
This Report Is Submitted In Partial Fulfillment of Requirements For The Bachelor Degree in Electronic Engineering (Computer Engineering)
Fakulti Kejuruteraan Elektronik dan Kejuruteraan Komputer Universiti Teknikal Malaysia Melaka
ii
UNIVERSTI TEKNIKAL MALAYSIA MELAKA FAKULTI KEJURUTERAAN ELEKTRONIK DAN KEJURUTERAAN
KOMPUTER
BORANG PENGESAHAN STATUS LAPORAN
PROJEK SARJANA MUDA II
Tajuk Projek :
A NEW APPROACH FOR INDUSTRIAL PRODUCT INSPECTION BASED ON COMPUTER VISION AND IMAGE PROCESSING TECHNIQUE
Sesi
Pengajian : 1 3 / 1 4
Saya MOHD KHAIRULDIN BIN HASSAN mengaku membenarkan Laporan Projek Sarjana Muda ini disimpan di Perpustakaan dengan syarat-syarat kegunaan seperti berikut:
1. Laporan adalah hakmilik Universiti Teknikal Malaysia Melaka.
2. Perpustakaan dibenarkan membuat salinan untuk tujuan pengajian sahaja.
3. Perpustakaan dibenarkan membuat salinan laporan ini sebagai bahan pertukaran antara institusi
pengajian tinggi.
4. Sila tandakan ( √ ) :
SULIT* *(Mengandungi maklumat yang berdarjah keselamatan atau kepentingan Malaysia seperti yang termaktub di dalam AKTA RAHSIA RASMI 1972)
TERHAD** **(Mengandungi maklumat terhad yang telah ditentukan oleh organisasi/badan di mana penyelidikan dijalankan)
TIDAK TERHAD
Disahkan oleh:
__________________________ ___________________________________
(TANDATANGAN PENULIS) (COP DAN TANDATANGAN PENYELIA)
iii
“Saya akui laporan ini adalah hasil kerja saya sendiri kecuali ringkasan dan petikan yang tiap-tiap satunya telah saya jelaskan sumbernya.”
Tandatangan : ………..
Nama Penulis : MOHD KHAIRULDIN BIN HASSAN
iv
“Saya/kami akui bahawa saya telah membaca karya ini pada pandangan saya/kami karya ini adalah memadai dari skop dan kualiti untuk tujuan penganugerahan Ijazah Sarjana
Muda Kejuruteraan Elektronik (Elektronik Komputer).”
Tandatangan : ………...
Nama Penyelia : NORHASHIMAH BINTI MOHD SAAD
v
vi
ACKNOWLEDGEMENT
vii
ABSTRACT
viii
ABSTRAK
ix
CONTENTS
CONTENT TITLE PAGES
PROJECT TITLE i
DECLARATION ii
DEDICATION iii
ACKNOWLEDGEMENT vi
ABSTRACT vii
ABSTRAK viii
CONTENTS ix
LIST OF TABLES xiii
LIST OF FIGURES xiv
LIST OF ABBREVIATION xvi
I INTRODUCTION 1
1.1 Project Background 1
1.2 Problem Statement 2
1.3 Objectives 4
1.4 Scope 4
1.5 Research Methodology 5
1.6 Thesis Organization 5
x
2.1 Introduction 7
2.2 Color System 8
2.2.1 Color Models 8
2.2.2 RGB Color System 8
2.3 Quality Inspection System 14
2.3.1 Level Inspection in Bottle 14
2.3.2 Product Defect 15
2.4 Platform Automated Quality Inspection 18 2.4.1 Fundamentals of Computer Vision 19
2.4.2 System Hardwae 20
2.4.3 Image Processing and Analysis 21
2.5 Classification System 24
2.5.1 Classification Method 25
III METHODOLOGY 26
3.1 System Overview 27
3.2 Color Prosess 29
3.2.1 Input Image 29
3.2.2 Feature Extraction 30
3.2.2.1 RGB to HSV 30
3.2.2.2 Otsu’ Method 31
3.2.2.3 Bwareaopen 32
3.2.3 Classification Process 33
3.3 Level Process 34
3.4 Graphical User Interface 36
xi
4.1 Introduction 37
4.2 Experimental Setup 38
4.3 Color Classification Analysis 41
4.4 Level Analysis 49
4.5 Gui Analysis 53
4.6 Analysis Accuracy of System 55
V CONCLUSION AND FUTURE WORK 56
5.1 Overview 56
5.2 Recommendation for Future Development 57
xii
LIST OF TABLES
NO TITLE PAGE
2.1 Valid values of each RGB component in a safe color 12
4.1 Total samples of images 38
4.2 Value red histogram of reference image 43
4.3 Value green histogram of reference image 43
4.4 Value blue histogram of reference image 44
4.5 Value RGB histogram of reference image 45
4.6 Value red histogram of test image 47
4.7 Value green histogram of test image 47
4.8 Value blue histogram of test image 48
xiii
LIST OF FIGURES
NO TITLE PAGE
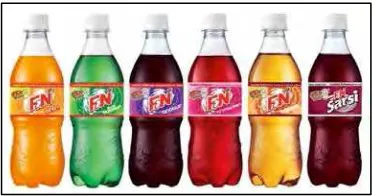
1.1 Six types of product 5
2.1 Schematic of the RGB color cube 9
2.2 RGB 24-bit color cube 10
2.3 (a) Generating the RGB image of the cross-sectional color
plane (127, G, B) 11
2.3 (b) The hidden surface planes in the color cube 11
2.4 (a) The 216 safe RGB colors 13
2.4 (b) All the grays in the 256-color RGB system 13
2.5 The RGB safe-color cube 13
2.6 Outline of Bottle level filling System 15
2.7 Over and Under filled bottles 15
2.8 Bottle under-filled or not filled at all 16
2.9 Bottle over-filled 16
2.10 Bottle has label missing 16
2.11 Bottle has label but label printing has failed 16
2.12 Bottle label is not straight 17
2.13 Bottle cap is missing 17
2.14 Bottle is deformed 17
2.15 Normal bottle 17
xiv 2.17 Components of a computer vision system 20
2.18 Different levels in the image processing process 22
2.19 Typical segmentation techniques 23
3.1 Overall project flow chart 28
3.2 Color beverage classification process 29 3.3 The single-hexcone model of color space 31
3.4 syntax of Otsu’ method 32
3.5 syntax of bwareaopen 33
3.6 Quadratic Distance formula 33
3.7 bwareaopen syntax 34
3.8 Flow chart of level process 35
4.1 Six type products of reference image 39
4.2 Six type products of color fail 39
4.3 Six type products of level overfill 40
4.4 Six type product level underfill 40
4.5 Color process of reference image (i1) 42
4.6 Red histogram of reference image 43
4.7 Green histogram of reference image 43
4.8 Blue histogram of reference image 44
4.9 RGB histogram of reference image 45
4.10 Color process of test image (i2) 46
4.11 Red histogram of test image 47
4.12 Green histogram of test image 47
4.13 Blue histogram of test image 48
4.14 RGB histogram of test image 48
4.15 Level PASS 50
4.16 Level OVERFILL 51
4.17 Level UNDERFILL 52
xv
4.19 Complete system GUI 54
xvi
LIST OF ABBREVIATION
1
CHAPTER 1
INTRODUCTION
1.1 Project Background
2 variety and change, the visual inspection process, on the other hand, requires observing the same type of image repeatedly to inspect the product [1]. Some studies [2]-[5], [6] show that the accuracy of human visual inspection declines with dull, endlessly routine jobs. Slow, expensive, erratic inspection is the result. Automated visual inspection is obviously the alternative to the human inspector. The need for industrial automation and show the general acceptance among manufacturers that automated systems will increase productivity and improve product quality [7], [8].
Nowadays many industries upgraded from human to automated visual inspection to inspect everything from pharmaceutical drugs to textile production. Image processing most common used in an industrial setting is for the automated visual inspection of products leaving a production facility. It is estimated that the majority of products bought on supermarket shelves are inspected using automated “machine vision” based systems prior to dispatch cause to avoid the cost of shipping a faulty or sub-standard item to a supermarket shelf that no-one wants to buy. One of the industry used automated visual inspection is coca-cola for beverage industry [9]. There is dealing with a bottling production line in a facility bottling coca-cola for the domestic market. It has a set of images, taken under near constant factory lighting conditions, of the bottles as they leave the bottling line. The bottling company requires a vision system to automatically identify a number of different faults that may occur during filling, labeling and capping stages of production so that these bottles can be intercepted prior to packaging. Thus, in this project there is dealing with beverage industry to develop algorithm that inspect the quality of beverage product.
1.2 Problem Statement
3 industry, American, European and Asian beverage manufacturers are becoming increasingly better equipped at manufacturing and packaging beverages at high speeds.
Today's current market demands are creating challenges for production schedules and are applying pressures for quality standards like never before. Ensuring the quality of products before they reach the retailer’s shelf or the consumer is now more important than ever. Now top beverage manufacturers are starting to implement vision inspection programs.
A vision inspection program can be a valuable tool for a wide range of beverage manufacturers. The ability of vision inspection to detect and prevent defective product packaging from being distributed to consumers is invaluable. In recent years, retailers and consumers have become much less tolerant of with poor packaging quality that results in either health risks or increased retailer costs because of manual inspection by human. If a vision inspection program is correctly implemented and managed, it can become a powerful tool to reduce rework and help safeguard brand from recalls, increase retailer confidence, protect consumers from defective products.
4
1.3 Objective
The objective of this project is:
1. To automate the beverage product quality inspection process. However, the automation process covers a wide range of work, which can be generally categorized into software design and hardware design. In this project, the work focused on the development of beverage product quality inspection algorithm implemented in software.
2. To design algorithms to classify the color concentration of beverage and level of beverage in the bottle.
3. To design GUI for color and level quality inspection. The design GUI will complete the system for software.
1.4 Scope
5
Figure 1.1: Six types of product
1.5 Research Methodology
- Data collection: For sample of product, images were taken by using digital color camera and web-cam.
- Analysis of color: Color was analysis by using RGB component, HSV component, Saturation component, Otsu’ method.
- Classification color concentration is using Quadratic Distance Classifier.
- Level of water: Level of water in bottle image is set by range of water level which is pass, overfill and underfill. For range of level, two point coordinate was set, if water level between two point level is pass, if above two point level is overfill and if level below two point level is underfill.
- GUI was design using user interface available in matlab software.
1.6 Thesis Organization
6 Chapter 1 will describe about introduction of the automated visual system quality inspection, problem statement that describe the reason for developing the project, objective of the project, scope of work, significant study of the project and thesis organization.
Chapter 2 is about review on previous research by other researcher in foreign country. Various methods and approaches that related to our project have been discussed and reviewed.
Chapter 3 explains about method that will be used in this project. RGB and HSV color model, Otsu method and Quadratic distance classifier will be applied in this project. Chapter 4 explains about result of the simulation from the 6 type of soft drink. Next, results will be analyzed to classify the reject soft drink based on the concentration and level.
7
CHAPTER 2
LITERITURE REVIEW
2.1 Introduction
8
2.2 Color System
This subsection will be discussed about color system, color model and RGB color system.
2.2.1 Color models
The purpose of a color model (also called color space or color system) is to facilitate the specification of colors in some standard, generally accepted way. In essence, a color model is a specification of a coordinate system and a subspace within that system where each color is represented by a single point. Most color models in use today are oriented either toward hardware (such as for color monitors and printers) or toward applications where color manipulations is a goal (such as in the creation of color graphics for animation). In terms of digital image processing, the hardware-oriented models most commonly used in practice are the RGB (red, green, blue) model for color monitors and a broad class of color video cameras [10].