iK-BASED PERFORMANCE EVALUATION OF INVESTMENT FUND BY USING SHARPE, TREYNOR AND JENSEN APPROACH
SKRIP SI
Submitted to Faculty of Economics and Social Sciences As Partial Requirements for The Title of Bachelor of Economics
Submitted by:
A YSA NA WAZIR Student ID: 604081000005
I
I
PER PUST AKAA.N UT AMA UIN SYAHID JAl<t\RTA IINTERNATIONAL CLASS PROGRAM MANAGEMENT DEPARTMENT
FACULTY OF ECONOMICS AND SOCIAL SCIENCES UNIVERSITAS ISLAM NEGERI SY ARIF HIDAYATULLAH
RISK-BASED PERFORMANCE EVALUATION OF
INVESTMENT FUND
BY USING SHARPE, TRENOR AND JENSEN APPROACH
SKIUPSI
Submitted to Faculty of Economics and Social Sciences As Partial Requirement for Acquiring the Swjana Ekonomi Degree
Academic Advisor I
Dr. Rofikoh Rokhim
Submitted by: A YSA NA W AZIR Student ID: 604081000005
Under Guidance of
Academic Advisor II
セO@
CJPJ:
OOセ@
Sisdjiatmo Kusumosuwidho, SE, MSc (1'
INTERNATIONAL CLASS PROGRAM
MANAGEMENT DEPARTMENT
FACULTY OF ECONOMICS AND SOCIAL SCIENCES
UNIVERSITAS ISLAM NEGERI SY ARIF HIDAYATULLAH
RISK-BASED PERFORMANCE EVALUATION OF INVESTMENT FUND BY USING SHARPE, TREYNOR AND JENSEN APPROACH
SKRJPSI
Submitted to Faculty of Economics and Social Sciences As Partial Requirements for The Title of Bachelor of Economics
Academic Advisor I
Dr. Rofikoh Rokhim
Submitted by:
Aysa Nawazir Student id: 604081000005
Under Guidance of
Sisdjiatmo Kusumosuwidho, SE, MSc
INTERNATIONAL CLASS PROGRAM MANAGEMENT DEPARTMENT
FA CUL TY OF ECONOMY AND SOCIAL SCIENCES ST A TE ISLAMIC UNIVERSITY SY ARIF HIDAY A TULLAH
Today, we administered a comprehensive examination to Aysa Nawazir, Student ID 604081000005. The title of her thesis is "Risk-Based Performance Evaluation of Investment Fund by Using Sharpe, Treynor and Jensen Approach".
After proper examination of the work of the student, we have decided that she has met all requirements for the title of Bachelor of Economics in the field of Management, State Islamic University (Universitas Islam Negeri) Syarif Hidayatullah Jakarta.
Jakarta, 6'h September 2008
Comprehensive Examination Team
PROF. DR. ABDUL HAMID. MS
Deputy of Dean
Full Name POB/DOB Address
Sex
Faculty I Major
University CGPA Occupation Cell Phone E-Mail Address Language Skills Education
BRIEF ACCOUNT
Aysa Nawazir
Bukittinggi I November 131h 1986
JI. Kamboja II No: 4, Komplek Inkorba, Bukittinggi Utara - Sumatera Barat. 26128. Indonesia
or
JI. Ibn Rusd II No: 155, Komplek UIN SyarifHidayatullah Jakarta, Kee Ciputat, Tangerang- Banten. 15419.
Indonesia Female
Faculty of Economics and Social Sciences I Management Department
State Islamic University Syarif Hidayatulah Jakarta
3.47
Student and Freelance Translator +628561813995
[email protected] & [email protected] English and Araoic
FEIS UIN SyarifHidayatullah Jakarta
Diniyyah Islamic Boarding School (Middle/High School) SDN 28 Pasia (Elementary School)
ABSTRAK
Berkembangnya pasar investasi di indonesia setelah krisis keuangan tahun 1997 sejalan dengan perkembangan produk investasi. Reksadana sebagai wadah investasi dari investor individu dan dana yang dikoleksi digunakan untuk mengakomodasi kebutuhan akan uang oleh pemerintah atau perusahan di pasar modal, reksadana menawarkan para investor bermacam-macam underlying assets yang tentunya juga mengandung risiko investasi yang berbeda termasuk risiko sistematis yang diwakili oleh beta portfolio dan risiko tidak sistematis yang diwakili oleh standar deviasi. Para investor yang berani mengambil risiko ataupun sebaliknya bisa memilih untuk berinvestasi di instrumen yang berbeda dan juga tergantung kepada tujuan lama invetasi mereka.
Studi ini mencoba mengukur kinerja tiga Jems reksadana dengan meranking mereka dan untuk mengetahui apakah rekdana tersebut underperformed atau aboveperformed yang diwakili oleh 24 reksadana. Studi ini menggunakan Sharpe ratio, Treynor ratio dan Jensen's Alpha serta SPSS seri 14.0 untuk mendukung penelitian.
ABSTRACT
Emerging market of investment after the Indonesian financial crisis 1997 is inline with the growth of investment product. The investment fund as the pool of investments by individual investors and use the funds to accommodate financing needs of governmnets and corporations in the primary market, offers the investors various investment funds' underlying assets, thus it may vary in risks including systematic risk represented by beta and unsystematic risk reperesented by standard deviations. Those who risk taker and risk averse can choose to which investment product to invest and in accordance to whether they want to choose in long term investment and short term investment, but still the product contain risk.
Therefore this study measure the performance of three types of investment fund presented by 24 investmnet fund products. To analyze their performance and to analyze whether the portfolio is underperformed or overperformed by using alpha. The other tool used in this study is Sharpe ratio, Treynor Ratio and Jensen's Alpha, and SPSS 14.0.
ACKNOWLEDGEMENTS
My gratitude and my prayer only to Allah SWT for giving me mercies, and blessed me those people to whom I would like to express my thank yous:
• Ayah Nawazir Muchtar and !bu Yelli Erida to whom I dedicated this skripsi. Thank you for your support, yom advice, for believing in me, for being my Daddypitt and Mommyjolie, for everything. Thank you.
To my sister and brother: Nabeel and Mujahid whom sometimes or in fact often more mature than me. I learn a lot of things from you bro and lets grab the world!
• The family ofUda Amsal Bakhtiar and Uni Nani Radiastuti, thank you for taking care of me during my study in Ciputat. Thanks to my cousins: Reani, Zanti and Dara for your hospitality.
• Ms. Dr. Rofikoh Rokhim and Mr. Sisdjiatmo Kusumosuwidho, SE, MSc for advising and guiding me during my research. Thank you for your advice, and it is been a blessed that I ever taught in your class, ever taught by wonderful lecturers.
• Mr. Arisman Msi the boss of International Class, thanks for making it easier..
• Mr. Prof. Achmad Rodoni, MM for your advice as head of Management Department and for revising my research proposal.
and Financial Management), Ms. Rosdiana Mustafa, SE, MBA (Marketing Management), Mr. Irfan S Zahiruddin, MBA (Strategic Management). • The big family of Koto in Jakarta: Mak Tuo Naida, Mak Tuo Na, Ma Mi,
Uni Henny, Uni Nadra, Uda Ardan, Uda Andar, Pak Tuo Almas, Uni Ria, Uda Rino, Uda Riza and Rika, De Ce, Alm. Inyik Nairn, Bu De and other Koto. Thank you for taking care of me.
• FEIS International program academic administrators and ex-academic administrators : Mr. Arisman Msi, Ka Mutiara Pertiwi, !bu Murdiyah Hayati, Ka Solatiah, Ka Fitri Damayanti and Ilham Prawira, sorry for making you fed up and annoyed by what l did and Fitry did to you ... • My friends, especially to Fitry Amri for being my company in all
conditions. To Munthe, lyah, Faqih, Sofyan (kamsa hamida Sof ... ) and lq bal thanks for sharing ideas, dreams, jokes, dvd, and telling gossip to me. To Nada, Hendry, Donal and Faizal for being my company when I am so lonely, thanks ...
• To the rest of my class mates, SEMANGAT!
• Maya, Fera, Daisy, Eni, Ayu Cumi, Ka Aniz and Ka Luki. It is been three years, thanks for the friendship and thank you gals for teaching me how to run SPSS.
• My midle and high school friends: Nana', Forse and Izul thanks for this long lasting friendship and for your support during my research.
TABLE OF CONTENTS
Page Approval Page ... .
Brief Account ... 1v
Abstrak ... v
Abstract VI Acknowledgements ... ... .... ... ... vn Table of Contents ... ix
List of Tables ... xn List of Figures ... ... ... ... ... xiii
Appendix ... ... ... ... ... ... ... ... 106
CHAPTER I INTRODUCTION A. Background ... . B. Problem Identification... 3
C. Purpose of Study ... ... .... ... ... ... 4
D. Use of Study... 5
E. Object of Study... 5
CHAPTER II THEORITICAL FRAMEWORK. A. Investment . ... ... ... ... ... . . ... ... .. ... .... ... .... .. ... 7
B. Securities Traded in Financial Market... 7
C. Investment Fund... 8
I. Type oflnvestment Fund ... 8
2. Investment Fund Regulations... 10
4.
Risks in Investment Fund ... .5.
Aspects that affect Net Asset Value oflnvestment Fund .... .6.
Return of Investment Fund ... .7.
Expenses of Investment Fund ... .8. Investment Manager ... .
9. Sharia and Conventional Investment Fund ... . D. Risk
E. Sharia Supervisory Board ... .
F. BAP EP AM -LK. ... .
G. BI Rate, Inflation Rate, SBI Rate ... . H. Custodian Bank ... . I. Variance and Standard Deviation ... . J. Beta
K. Alpha
13 15 16 17 17 17 20
21
22 23 24
25
26
27
L. Methods for Investment Fund Performance Measurement... 28
1. Sharpe Method ... 29
2. Treynor Method... 30
3. Jensen Method... 31
CHAPTER III RESEARCH METHODOLOGY A. Type and Nature of Study... 35
B. Sampling Method... 35
C. Data Collection... 35
D. Data Analysis... 37
E. Step of Analysis... 38
F. Data Analysis Method... 39
1. T-Test ... 40
CHAPTER IV ANALYSIS
A. Profile of!nvestment Fund... 42
B. Performance Evaluation oflnvestment Fund... 47
1. Sharpe Measure Approach ... ... ... ... .. .. .. .. 4 7 2. Treynor Measure Approach ... 52
3. Jensen Measure Approach... 94
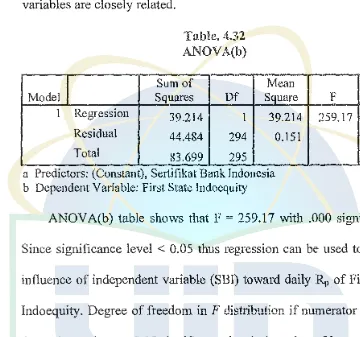
C. Regression Equations... 96
D. Top-ten Perfonners... 98
E. Best Method in Accordance to Indonesian Case... 98
CHAPTER V CONCLUSION AND RECOMMENDATION A. Conclusion... 100
B. Recommendation... 101
Table. 4.1 Table. 4.2 Table. 4.3
LIST OF TABLES
Page
47 48 51 Table. 4.4 - Table. 4. 75 ... 53 - 90 Table. 4.76 ... 91 Table. 4.77
Table. 4.78 Table. 4.79
[image:13.595.50.457.204.558.2]LIST OF FIGURES
[image:14.595.50.452.196.667.2]Page
Figure!.!... 6
Figure. 2.1... 21
Figure. 2.2... ... ... ... ... .... .... .. . .. ... ... .. . . ... .. ... .. ... .. ... .. .... ... .. 29
Figure. 2.3 ... .. ... ... .. . ... ... . .. ... ... ... ... ... ... . . ... .... ... ... .. ... 31
APPENDIX
Page
Appendix 1 .. .. .. .. .. ... ... ... ... .... ... ... .. ... 106
Appendix 2 ... 130
Appendix 3 ... 132
A. Background
CHAPTER I
INTRODUCTION
Investment fund firstly was introduced to market in 1996, it has been 11 years and investment fund in Indonesia shows its development and recession in the market. During 1996 to 2000, Investment fund did not show significant development, it can be seen throngh quantity of investment fund products, quantity of investment fund nnit trnst, quantity of investors and investment fund's net asset value, but from the 2001 to 2004 investment fund showed significant increase from four factors mentioned above (Turino, Haris 2007).
and Makmun: 2005). But, nowadays the issue of investment fund to be taxable investment object has been discussed by policy maker.
In the 2005, when big redemption happened because investors panic about the increase of inflation caused by government policy to increase fuel price and there was also decision of Indonesian central bank, Bank of Indonesia, to increase BI rate.
There is also syariah investment fund which introduced in Indonesia's market in the 2000. The award from Bloomberg LP which goes to Batasa Syariah Based Fund in 2005, second place on the league of 413 Bond Fund in Asia; had become another attraction for investing in investment fund, especially syariah investment fund in Indonesia.
Investment fund consists of many underlying assets which may consists of systematic and unsystematic risk, risk free and risky assets. The term of "high risk-high return and low risk-low return" should be understood by all investors. The panic that happened in iinvestment fund market in 2005 should be a valuable experience, which to be understood that in every investment there are many risks that need to considered, including systematic and unsystematic risk.
investment manager to diversify their portfolio into corporate bond since it offer higher return compared to government bond-based underlying asset.
According to Jones (2002); Reilly and Brown (2000); Bodie, Kane and Marcus (2004); and Gruber, Elton, et al (2002) there are many methods used by investors in measuring performance: there are methods like Single Index Model, Multi Index Model, Security Market Line, Sharpe, Jansen, Treynor model and Arbitrage Pricing Theory model. Investing in investment fund need to consider two risks that mentioned above, later in this paper the first three methods will be used for comparing investment fund performance by using Shmpe & Jansen and Treynor models, those three models will be compared to each other in order to find out the rank of portfolio based on its underlying risk.
There are many types of investment fund in Indonesia; equity fund, fixed income fund, money market fund, discretionary fund, and index fund, with various choice of investment syariah underlying asset is emerging issue in invetment fund. thus to find out which investment fund the study need to rank performance of investment funds based on their underlying risk and return.
B. Problem Identification
Since the investment fund consists of many underlying risk (systematic risk and unsystematic risk), the study will compare the performance of investment fund based on three approaches and will compare three types of
The choice to invest in syariah-underlying asset or conventional-underlying asset will be the consideration for investor, before the investor needs to know the performance of each type of investment. There are many choices of investment, like investing in government bond, corporate bond and corporate stock, whether investing in capital market or money market, there are choices. Investment fund one of the alternative for investment, with its fund investment manager are required to manage the risk and return of that fond.
Thus this study identifies three problems:
1. Is the performance between three types of investment funds are the same?
2. Does syariah-based investment fund performed worse compared to conventional investment fund (vice versa)?
3. Does the study eventually offered the investment manager and investors choice in investment?
C. Purpose of Study
While the special purpose of this study is:
1. To find out the performance of investment fund in accordance with the type of its underlying asset.
2. To find the influence of risk free rate to investment fund portfolio, and to find out whether the investment managers are able to manage his/her portfolio.
3. To compare three types of investment fund for consideration of future investment and to give alternative choices of investment for investment manager like in syariah mutual fund or in conventional mutual fund.
D. Use of Study
By achieving purposes of study above it is expected that:
I. Understanding the steps that are taken to find the result of Sharpe method, Treynor method and Jensen method.
2. To show the growth of investment fund since its effective date and to compare the performance to each other.
E. Object of Study
To avoid confusion and bias in result of computation, writer gave limitation in variable that need to be computed. Variable of data will be about: 1. Net Asset Value of investment funds.
2. Rate of Sertifikat Bank Indonesia 3. Rate of Portfolio
6
r---
1: Investment Funds: 1
I
: 1. Fixed Income Fund
2. Discretionary Fund
3. Fixed Income Fund
I I I I
I I
セMMMMMMMMMMMMMMj@
- -o--- -
-Critical School of Thought
r -M[・[・セイZ[@ セ[イセセiセZM
-I. NAV
2. SB! as Rr
3. Beta
4. St Dev
5. Alpha I I I I
_______________
,
.---
' Conclusions :I I
I I
1 1. 70% of top-ten performers are fixed-income fund and 30% of top-ten perfonncrs are 1
balanced fund. While all of money market fund are the best big IO in Rp. 1
2. The study rejects all null (Ho) hypothesis and accept all alternate hypothesis (H1). Rr
gives negative impact to the performance of all mutual funds (-p). Average alpha of
portfolio shows that fixed-income fund has the highest alpha (a) -- the investment
managers of fixed-inco1ne fund \Vere unable to maximize the performance of portfolio (even though fixed-income fund \Vere perform very good ainong other fund).
3. There is alternative choice of investment for investors in accordance to portfolios' underlying assets and in accordance to risk composed in the portfolio.
I I セMMMMMMMMMMMMMMMMMMMMMMMMMMMMMMMMMMMMMMMMMMMMMMMMA@
_,
セL@ I Methods of Computation:I. Sharpe ratio
2. Treynor Ratio
A. Investment
CHAPTER II LITERATURE REVIEW
Investments are usually referred with deferring consumption or choice to save. The investors are compensated with return because they have to bear risks and forgo opportunities which may be gained if they not choose to invest, this is called opportunity cost.
There are two types of investment; they are short-term investment and long-term investment. In short-term investment, investors are expected their portfolio is able to be converted into cash within one year, while long-term investment are defined as those securities that are not readily convertible to cash or are not intended to be converted into cash in the shmt-term (Madura, 2006: 4).
B. Securities Traded in Financial Market
There are three types of securities traded in financial market, they are money market securities or commonly referred as short-term investment, capital market securities or commonly referred as long-term investment and derivative securities.
financial contracts whose values are derived from the values of underlying assets (such as debt securities or equity securities).
C. Investment Fund
Investment fund is an intermediary between individual or organizational investors to accommodate financing needs of deficit unit like government and corporations with surplus unit like households and business, these funds are aimed to be invested in capital market securities such in long-term government bond and corporate securities, and to be invested in money market securities (Madura, 2006:655).
Fund is managed by investment manager from specific investment corporation. Investment fund investment managers just like other investment managers, they analyze economic and industry trends forecast and assess the potential impact of various conditions on companies.
There are three types of funds, they are open-end funds which means that investors can purchase shares or redeem their shares at any time, closed-end fund which means that investors do not repurchase (redeem) the shares they sell, and Exchange Traded Fund management goal is to mimic an index so that the share price of the ETF moves in line with that index.
1. Type of Investment Fund: a. Money Market Fund
financial contracts whose values are derived from the values of underlying assets (such as debt securities or equity securities).
C. Investment Fund
Investment fund 1s an intermediary between individual or organizational investors to accommodate financing needs of deficit unit like government and corporations with surplus unit like households and business, these funds are aimed to be invested in capital market securities such in long-term government bond and corporate securities, and to be invested in money market securities (Madura, 2006:655).
Fund is managed by investment manager from specific investment corporation. Investment fund investment managers just like other investment managers, they analyze economic and industry trends forecast and assess the potential impact of various conditions on companies.
There are three types of funds, they are open-end funds which means that investors can purchase shares or redeem their shares at any time, closed-end fund which means that investors do not repurchase (redeem) the shares they sell, and Exchange Traded Fund management goal is to mimic an index so that the share price of the ETF moves in line with that i,idex.
1. Type oflnvestment Fund: a. Money Market Fund
b. Fixed Income Fund
This investment fund invests at least 80% of its asset in capital market securities such as treasury notes and bonds, municipal bonds, corporate bonds and mortgages. This investment fund is relatively has higher risk compared to funds invested in money market securities; this is aimed in result of maintaining stable return.
c. Equity Fund
Investment manager invests at least 80% of asset in stock in the form of equity. Because the investment is in stock thus the risk is higher compared to two previous investment fund but result in higher return.
d. Protected Fund
A type of investment fund that guarantees an investor at least the initial investment, plus any capital gains, if it is held for the contractual term. The idea behind this type of fund is that investor will be exposed to market returns because the fund is :oblp to invest in the stock market, but investor will have the safety of the guaranteed principal. Disadvantage of this investment is the investors are limited to buy this fund until a certain amount of fund.
e. Index Fund
movements of an index of a specific financial market, or a set of rules of ownership that are held constant, regardless of market conditions.
Besides many types of investment funds above, the term of discretionary fund always misundarstood by many people. Discretionary fund is traded in capital market, almost like time deposit. What makes discrationary fund different with time deposit is return of time deposit is taxable, while discretimanary fund is nontaxable. Discretionary fund can not be withdrawn unto certain petiod of time.
2. Investment Fund Regulations
Based on Undang-Undang Pasar Modal Nomor 8 Tahun 1995 pasal 18, ayat (I), law body of investment fund in Indonesia is in form Limited Corporation (Perseroan Terbatas) and in the form of Collective Investment Scheme (Kontak Jnvestasi Kolekti./).
a. Investment Fund in Indonesia Is in Form Limited Corporation
A limited corporation, which in law side there is no difference with other corporations. Difference is in type of business that is managing investment portfolio.
b. Collective Investment Contract
and custodian bank is given the authority to bring out depositing and investment administration.
Up to now, there are 20 regulations related to investment fund m Indonesia, these regulation formulated by the Indonesian Capital Markets and Financial Institutions Supervisory Agency (BAPEPAM
LK), these 20 regulations talked about auditing, submissive
examination, business operation permission, statutes, management guidelines, guidelines for asset savmg contract, fair market value, guidelines for daily net asset value announcement, advertising guidelines, investors profile, permission for custodian, accounting principle, financial report, required information in prospectus and investment fund report guidelines.
3. Advantage oflnvestment Fund a. Investment Diversificalion
b. Easy Acess to Investment
Investment fund eases the investors to invest in capital market. The easiness of investment can be reflected from m<my administration service offices provided by investment fund's investment company in buying or redeem unit of Investment fund. Easiness also enjoyed by investors in reinvesting the return they gained so than unit trust can continuously grow.
c. Time and Money Efficiency
Investment fund is collection of fund from many investors, thus investors' expenses can be cheaper compared if investor conduct transaction in stock market. Management is conducted professionally by investment manager so no need for investor to control his investment performance individually.
d. Liquidity
Investor can redeem his unit trust every time based on regulations from each of investment fund, so can ease investors in managing his liquidity. Investment fund has obligation to buy back its unit trust, so its characteristic is liquid.
e. Transparency
f. LowPrice
Investing m investment :fund in Indonesia relatively required small amount of money, Rp. 200,000 ($20), it means that it is easy to anybody including housewife and students.
g. Nontaxable Object
Return from Investment fund is nontaxable, because tax liability had been fulfilled by Investment Fund Company.
4. Risks in Investment Fund
Investing in investment funds make investors and investment managers are exposed to those various 1isk (according to Fitch rating and BAPEPAM):
a. Value Risk
Reduction in the value of trust fund is influenced by price m portfolio (stock, bond) which included in specified investment fund's portfolio.
b. Liquidity Risk
This risk is related to difficulty faced by investment manager if most of investment units' holders redeem all the units they held. Investment manager will face difficulty in supplying cash for that redemption.
f. Leverage
g. Politic and Economic Risk
Changing in economic and politic policy can influence stock market performance together with corporate performance thus security price will be influenced than influence portfolios owned by investment fund.
h. Market Risk
This 1s happen because the value of security in capital market fluctuated based on general economic condition. Fluctuations in capital market will directly influence net asset value of portfolio, especially if there is correction of negative movement.
1. Inflation Risk
Inflation will cause decreasing total real return of investment. Return gained from investment in Investment fund can not cover the loss of purchasing power.
J. Foreign Exchange Risk
This risk happen if there is foreign security in portfolio. The movement of foreign exchange can influence value of security which included foreign investment after converted to domestic currency. k. Investment Fund's Sysematic Risk
decreasing if performance of its corporation is decreases, and there is possibility of default where investment company can not pay its liability.
5. Aspects that affect Net Asset Value oflnvestment Fund:
a. Changing price of stock, bond and investment instrument of investment fund.
Performance of investment fund depends on investment instruments chosen by investment manager, from the choice of investment instrument it can be found increase of the value of investment since the time it bought. If the price of underlying asset of investment fund rises it increases the Net Asset Value of investment fund, conversely if the value of investment fund portfolio decreases thus the Net Asset Value of investment fund decreases that market movement of investment fund portfolio causes the voiatiiity and changing price of Net Asset Value of investment fund.
b. Interest income I dividend.
c. The size of liability committed to investment fund.
Investment managers have liability to pay third party in the form of management fee. This fee is salary for managing the assets which includes I% - 2% fee for investment manager taken from Net Asset Value of investment fund. Custodian fee is the fee paid for custodian bank whom offer the service for holding investment portfolio. Usually the fee is 0,25% per annum. Besides, investment fund also has to pay transaction cost and registration cost, also investment fund has to pay fee for Public Accountant, Law Consultant. That amount of fees affect the level of investment fund NA V.
cl. Systematic Risk
The study finds that there has been a consistent relationship between certain variables like interest rate, inflation, money supply, equity market and the net asse1 vaiues of the mutual funds. However, a few variables like exchange rate or the index of industrial production have shown very negligible influence on the net asset values.
6. Return oflnvestment Fund
7. Expenses oflnvestment Fund
There are three expenses in investment fund; they are transaction fees, periodic fees and loads fee.
8. Investment Manager
Up to December l 5t11
2007 there 111 investment manager that are listed in the Indonesian Capital Markets and Financial Institutions Supervisory Agency's web site, with 454 active investment fund products and 137 non-active products.
9. Syariah and Conventional Investment Fund
Based on Indonesia Ularna Councils' workshop on investment fund which was held by Indonesian Ularna Council in cooperation with Bank Muamalat Indonesia on 24-25 Rabiul Awwal 1417 H, the existence of Syariah investment fund is an alternative for Moslem in muamalat not to use their welfare with bathil;
セL@
-, .)
29 :,.LJI ...
Syariah and conventional are the same in the meaning of collecting
syariah and conventional investment fund different are in the matter of type of portfolios, institution and investors' relation with investment manager.
a. Portfolio.
The investmnet portfolio must not consists of corporations who conducts or gain profit from activities below:
I) Conventional Banking.
2) Conventional Insurance Corporation.
3) Financial services; interest based instruments;
4) Entertaimnent; hotel, casino, cinema, music, etc.
5) Manufacturing corporation who sells pork, alcohol or haraam goods.
6) Gambling.
7) Activities that produce distribute or provide products and services which damage moral standards and/or provide no useful natural purpose.
b. Supervisor
Ulama National Syariah Supervisory Board. Thus activities of investment fund are expected to stick with syariah principle.
Another way that an Islamic fund may ensure Shari' ah supervision without retaining the services of a Shari'ah Supervisory Board is for it to appoint a Shari'ah scholar to the fund's Board of Trustees. Then the scholar may either chair a subcommittee or work alone to supervise the fund for Shari'ah compliance and oversee the other Shari'ahrelated matters (DeLorenzo, 2005).
c. Investors Relation with Investment Manager
Agreement between investors and investment manager should be in wakaalah and mudharabah system. Investors trusted their fund to investment manager by wakaalah system, and investment manager will act as using mudharabah system as mudharib who manage collected fund from investors. Technically, mudharabah is agreement where a party provide 100% capital for investment and another party manage this capital. Return on mudharabah is arranged on written agreement between both parties, if investment suffers losses it goes to investors as long as this loss is not from investment manager fault. If the loss is result from investment manager's fault or fraud, thus investment manager has to put his responsibility upon it.
d. Problems in Syariah Finance
D. Risk
complied yet in all moslem countries, because certain countries still behold to their own Syariah Supervisory Board.
2) Syariah compliance risk (Hosen, 2008). 3) Operational cost, (Karim, 2008).
4) Very limited expert in islamic economics who masters integrative modern economic science (Agustianto, 2008).
5) Gradual assessment on islamic economic and financial system. 6) National and international tools, regulations, law and policies is not
imperfected yet.
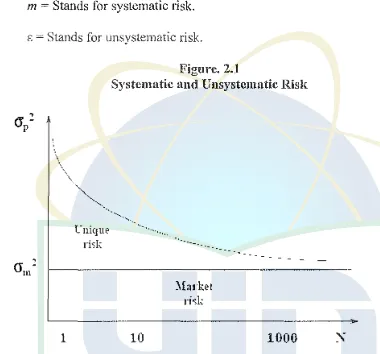
The return of the company called Flyers which comprises systematic risk, also known as undiversifiable risk, and unsystematic risk which is also known as idiosyncratic risk or diversifiable risk. Systematic risk refers to the risk common to aii securities - i.e. market risk. Unsystematic risk is the risk associated with individual assets. Unsystematic risk can be diversified away to smaller levels by including a greater number of assets in the po11folio; systematic risk (within one market) cannot. Investment manager are diversifying the investment funrl portfolio into many stocks in order to minimize unsystematic risk. It can be diversified into more than a hundred · portfolios.
Systematic and unsystematic components of Flyers return ( U) can be written:
R = E (R) + Systematic portion+ Unsystematic portion ... (2.2) R=E(R)+m + e ... (2.3)
Where:
m = Stands for systematic risk.
[image:38.595.64.444.198.552.2]e = Stands for unsystematic risk. Figure. 2.1
Systematic and Unsystematic Risk
\
\.
"'-,,
"'-.,
l·nique
risk
1
-· ... .__ ...
10
...
セヲ。Qᄋォ・エ@
イゥセォ@
Source: PPT by Prof. Gordon M. Phillips E. Syariah Supervisory Board
1000
I. Syariah Supervisory Board is part of relating syariah financial institution, which its replacement is based on agreement of National Syariah Board. 2. Syariah financial institution is every institution whose business activities
F. The Indonesian Capital Markets and Financial Institutions Supervisory
Agency (BAPEPAM LK)
BAPEPAM LK has duty to develop, manage and control daily activities of capital market and formulate and execute policies and technical standardization in financial field based on policies decided by Ministry of Finance based on valid legislation.
In conducting duties, BAPEP AM LK has the following roles:
1. Formulating rules for capital market; 2. Reinforcement of rules in capital market;
3. To develop and control party who receive business perm1ss10n, agreements, application from institution or other party who move in capital market;
4. Decision of open-principles for listed corporations and public corporations;
5. Objection solving which proposed by party whom punished by Stock Market, Clearing and Lending, and Depository Institution and;
6. To make decision on accounting system in capital market. 7. To prepare policy fcrmulation in financial institution field.
9. Standard formulation, norm, direction and procedure in financial institution filed.
10. To give teclmical supervision and evaluation in financial institution field.
11. Implementation of institutions' administration.
H. BI Rate, Inflation Rate, SBI Rate
Bl rate is a risk free rate set by central bank in Indonesia, Bank of Indonesia, BI rate is the rate that charged to banks that want to borrow from Bank of Indonesia, than one of Bank of Indonesia duty beside changing discount rate, and its open market operations that affect the amount of reserve in the banking system and hence the money supply. BI rate is decided based on board meeting by considering inflation rate, government policy, economic conditions and many other factors. In November 1st 2005, BI rate reached 12.25% where this decision was made because government policy to increase fuel price. From July 5'11 2005 up to December 6'11 2007, it was 14 times continuously Bank of Indonesia decreased BI rate because conducive economic condition.
I. Custodian Bank
Referred to Investopedia, custodian bank is a party that holds fund than this fund is not held directly by investment manager in order to avoid misuse of fund by investment manager. Custodian bank supervises every uses of fund, and according to Indonesian Capital Markets and Financial Institutions Supervisory Agency (BAPEPAM) custodian bank is commercial bank that is given operational pennission to manage investment fund by BAPEPAM. They allowed giving custodian service or collective portfolio ttust, accepting other capital, and accepting dividend, interest and others. Custodian bank asks certain percentage for custodian fee from Net Asset Value of investment.
J. Variance and Standard Deviations
In probability theory and statistics, the variance of a random variable, probability distribution, or sample is one measure of statistical dispersion, averaging the squared distance of its possible values from the expected value. Whereas the mean is a way to describe the location of a distribution, the variance is a way to capture its scale or degree of being spread out. The unit of variance is the square of the unit of the original variable.
The standard deviation, as always, is the square root of the variance; it is usually denoted with the letter a (sigma). The standard deviation is the most common measure of statistical dispersion, measuring how widely spread the values in a data set is. If many data points are close to the mean, and then the standard deviation is small; if many data points are far from the mean, then the siandard deviation is large. If all ihe data values are equal, then the standard deviation is zero.
. ... (2.4)
Standard deviation may serve as a measure of uncertainty. In finance, standard deviation is a representation of the risk associated with a given security (stocks, bonds, etc.), or the risk of a portfolio of securities. Risk is an important factor m determining how to efficiently manage a portfolio of
portfolio and gives investors a mathematical basis for investment decisions. The overall concept of risk is that as it increases, the expected return on the asset will increase as a result of the risk premium earned - in other words, investors should expect a higher return on an investment when said investment carries a higher level of risk.
Calculating the average return (or arithmetic mean) of a security over a given number of periods will generate an expected return on the asset. For each period, subtracting the expected return from the actual return results in the variance. Square the variance in each period to find the effect of the result on the overall risk of the asset. The larger the variance in a period, the greater risk the security carries. Taking the average of the squared variances results in the measurement of overall units of risk associated with the asset. Finding the square root of this variance will result in the standard deviation of the investment tool in question. Use this measurement, combined with the average return on the security, as a basis for comparing securities.
K. Beta (p)
--
l(N
l:R;_,Rm.I -RiRm
J-==
/J
I-
_
N
セHエrLセLjMrL[L@
1=1...
(2.5)Or
Cov (Ri,Jlm2
2 0m
Where:
... ···-··· ... (2.6)
Rm =the return on the market portfolio.
Beta thus measures the responsiveness of a security to movements in the
market portfolio. Base on beta, assets can be classified into:
I. Risk-free asset
p,
= 02. Market portfolio Pm= I
3. Defensive portfolio
p;
<I4. Aggressive portfolio
p;
> I5. Neutral portfolio
p;
= 1L. Alpha (a)
A measure of performance on a risk-adjusted basis. Alpha takes the
volatility (price risk) of a mutual fund and compares its risk-adjusted
A positive alpha of 1.0 means the fund has outperformed its
benchmark index by 1 %. Correspondingly, a similar negative alpha would
indicate an underperformance of I%.
a=y-bi ... (2.7)
Where the slope b is calculated as: l;(x - i)(y - y)
b= ... (2.8)
I<x-xF
M. Methods for Investment Funds Performance Measurement
1. Sharpe Method
The Sharpe measure is calculated as the ratio of the average portfolio
excess returns to the standard deviation of portfolio returns over a particular
period c' time. It therefore measures excess returns per unit of total risk. Sharpe ratio is based on the assumption that total risk, including film-specific
risk, is valued by the market and should be taken into consideration when
comparing one investment to another (Frohlich: 2004), and according to
Sharpe ratio, the highest performance is awarded to the investment fund
whom has the best risk-adjusted average rate of return (Siahaan: 2007)
R - R
1 I ... (2.9)
(J" J
Where Rj is average return of portfolio j in period of measurement,
Rr is average risk free investment for a period of measurement, and Cij is
Where Rj is average return of portfolio i in period of measurement, Rr is average risk free investment for a period of measurement, and crj is standard deviation i for period of measurement (Seeratan, 2005).
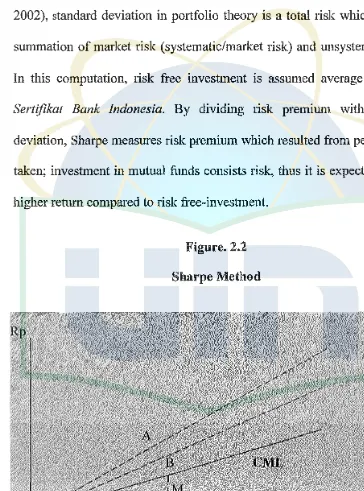
Sharpe measure focuses on the total risk (Mishra and Rahman: 2002), standard deviation in portfolio theory is a total risk which it is the summation of market risk (systematic/market risk) and w1systematic risk. In this computation, risk free investment is assumed average return of
[image:46.595.82.446.221.712.2]Sertijikat Bank Indonesia. By dividing risk premium with standard deviation, Sharpe measures risk premium which resulted from per unit risk taken; investment in mutual funds consists risk, thus it is expected to give higher return compared to risk free-investment.
From figure above, there is Capital Market Line (CML) in Sharpe Ratio while 2 other lines that existst above CML is Sharpe Ratio for portfolio A and portfolio B.
2. Treynor Method
Performance measurement with Treynor index is also based on risk premium likewise Sharpe method, but it uses beta for denominator HセI@ as relative fluctuation toward market risk, formulated as follow (Elton et al., 2003:344).
R -R
T
=
j.r
j
/31
. ... (2.10)
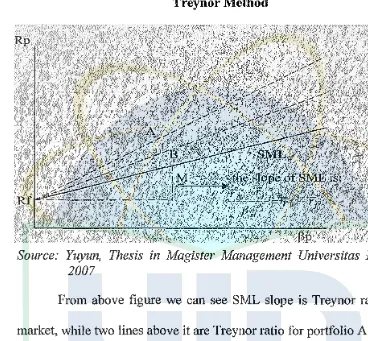
Figure. 2.3 Treynor Method
Source: Yuyun, Thesis in Magister Management Universitas Indonesia,
2007
From above figure we can see SML slope is Treynor ration from market, while two lines above it are Treynor ratio for portfolio A and B.
3. Jensen Method
In tenns of the Jensen alpha it provides an easily interpreted performance measure (excess returns in percentage tenns) and it can also be easily estimated from a CAPM equation that can be evaluated by the full range of statistical tests (Seeratan: 2005).
alpha notation. The higher the value of alpha positive, the better the performance of portfolio (Yuyun: 2006).
Jensen measure is formulated as follow:
E(Rj) = RFR + jJj[E(R.J - RFR
Where:
E(Rj) = expected return of portfolio j
RFR = risk ji-ee interest rate
/Jj
= 5ystematic risk or beta of portfolio jE(Rm) =expected return of risky asset
... (2.11)
Jensen method uses time series data, Jensen measurement in the form of positive alpha, where alpha represents the level of return contributed from investment manager ability in creating above adjusted average return toward its risk.
2% return per period higher than expected return of portfolio in certain level of risk. Second advantage of Jensen alpha is, because it is estimated from regression equivalent, thus it is easier to make evident by using statistical significance toward investment manager ability or distinction of skill level from two different investment manager. And the last advantage of Jensen method is the flexibility for using other alternative model beside risk and expected return of CAPM; multifactor models. In particular, risk adjusted performance can be calculated relative to many multifactor models like:
Rjl - RFR1 = aj + [ bj1F1t + bj2F21 + ... ... ... bjkFk1 } + ejl
... (2.12) Where:
Fki = period of return 1 toward k risky factor
From above explanation, those three methods tries to measure activities conducted by investment manager in order to increase added return thus it can be compared to its benchmark. Although there is similarity between Sharpe Method and Treynor method but the use of it is depends on the risk that will be taken. If investor likes to use total risk (systematic risk plus unsystematic risk) thns Sharpe method is more alike, but if investor only aim to know proper systematic risk, thus Treynor measure is more definite.
If a portfolio is perfectly diversified, thus the uses o:f three methods will give same ranking of portfolio. This happened because diversified portfolio's total risk will be the same with systematic risk, while if a portfolio is imperfectly undiversified thus Treynor method and Jensen method will result in higher ranking performance compared to Sharpe method.
From three models above, there are many limitations: 1. Based on CAPM - based on used assumptions.
2. Market portfolio proxy with market index - result in wrong benchmark (benchmark eITor).
3. Depends of which index that will be used as proxy on market portfolio - thus beta can change.
4. Global investment will lead to benchmark eITor.
CHAPTER Ill
RESEARCH METHODOLOGY
A. Type and Nature of Study
This is a qualitative descriptive study that will help understanding the problem discussed in this paper by elaborating related issues (Sekaran, 2006) and showing the result of computation which transformed from tables and curves to readers through written description. This study is undertaken to ascertain and be able to describe the result of three methods used to measure three types of investment fund.
B. Sampling Method
Samples are taken by using systematic sampling: involves drawing every nth element in the population starting with a randomly chosen element between 1 and n (Sekaran, 2006: 270). Here the samples taken in this research are the big eight investment fund products from ihree types of investment fund. The big eight investment fund products are chosen based on the rating of investment fund products in Indonesia published by Investor Magazine in February 28 2007.
C. Data Collection
Choice for Sample
a. Investment Fund Products
The samples taken in this research are the big eight investment fund products from three types of investment fund. The big eight investment fund products are chosen based on the rating of investment fund products in Indonesia published by Investor Magazine in February 28 2007.
b. Net Asset Value (NAV)
The Net Asset Value of investment fund is derived from daily NA V data that published during 2007 in the website of Bisnis Indonesia newspaper.
c. Rr
D. Data Analysis
In this study there are five procedures taken to conduct data analysis, they are:
L Data Collection 2. Data Grouping
In order to compute variables that needed for finding the result of Sharpe, Jensen and Treynor theory data that gathered in the previous procedure is grouped into field that want to computed.
a. Return of Portfolio (Rp)
This data is gathered by computing daily NA V value divided by Rp. I 000; which it is an official value per unit of investment fund regulated by BAPEP AM.
The formula for gathering
Rp
is in the following equation:... (3.1)
b. Risk Free Investment (Rr)
This average SBI return will be used as real number for risk free investment.
c. Risk Premium
Risk premium is the result of subtraction of return of portfolio (Rp) and risk free investment (Rr).
d. Standard Deviation of Portfolio (ap)
The standard deviation of portfolio is the total risk of portfolio (systematic and unsystematic risk) computed from the fluctuation of NA V of investment fund.
e. Beta
CB)
Beta derived through linest between return of portfolio and Sertifikat Bank Indonesia. The equation of Beta can be read in the Chapter II.
f. Alpha (u)
Alpha of investment fund derived through intercept between return of portfolio and Sertifikat Bank Indonesia. The equation of alpha can be read in the Chapter II.
E. Step of Analysis
I. Inputs
a. Daily NA V of24 investment fund in 2007. b. Return of Sertifikat Bank Indonesia
2. Output
a. Return of portfolio (Rp). b. Risk free returns (Rr). c. Risk premium(Rm).
d. Standard deviation of portfolio ( crp).
e. Beta of ーッイエヲッャゥッHセイIN@
f. Alpha of portfolio ( ap).
F. Data Analysis Method
This minithesis uses dependent data analysis method, that this method examine whether there is or there is no relationship between two sets of variable (Ghozali, 2005:6).
Statictical calculation tries to find out these hypotheses: I. Ho= µi =: 12
H 1 = The mean score are not equal
2. Ho= p = 0 (The correlation in the population is zero)
H1 =pi 0 (The correlation in the population is different from zero) 3. hッ]セ^@ 0 (the linearity in the poputaion is positive)
This study use qualitative data, which is data that are not immediately quantifiable 1mless they are coded and categorized in some ways.
1. I-Test
I-Test is a statistical test that establishes a significant mean difference in a variable between two groups. To know whether there is or there is no influence of independent variable toward dependent variable the 0.05 significant rates is used. If the value of probability is more than 0.05 than there is no influence of independent variable toward dependent variable, but if the value of T probability is smaller than 0.05 than there is influence from independent variable toward dependent variable (Ghozali, 2005:85).
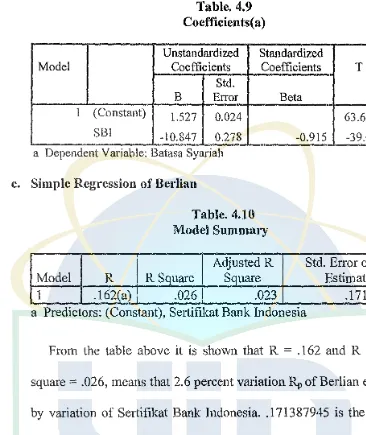
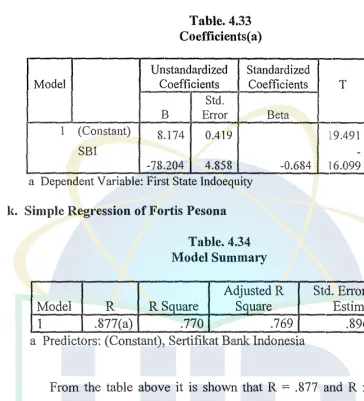
2. Simple Regression Analysis
One of the importam advantages of mutual funds is that a small investor can also enjoy benefits of diversification of portfolio. Further, well diversified portfolio reduces the risk of the portfotio. Diversification can be measured with the help of coefficient of determination (R2
). This
can be obtained by regressing the portfolio's additional return (rp - R1) against the market additional returns (Rm - R1 ). A high value indicates greater diversification of fund and vice-versa (Jones: 1988).
Regression in equation:
where:
b = r -Sy Sx
a=
Y- bX
... (3.3)
... (3.4)
r is the correlation coefficient
Sy is the standard deviation of Y (the dependent variable) Sx is the standard deviation of X (the independent variable)
Y
is the mean of Y (the dependent variable) Xis the mean of X (the independent variable) E is the standard error of the estimateRegression analysis, either it measures correlation between two or more than two variables; it also shows the relationship between dependent and independent variable. The value of coefficient determination (R2) is between 0 and 1. The small R2 means that the ability
A. Profile of Investment Fund
CHAPTER IV
ANALYSIS
1. AAA Amanah Syariah Fund is a balanced fund-type of investment which initially offered on June 21 2005. AAA Amanah Syariah Fund is a product of PT AAA Sekuritas that offered 500,000,000 investment units, and the wealth was composed of 30% - 95% in bond (sukuk) or other debt instrnments and 5% - 80% in equity (Islamic indexes) those are listed in Jakarta Islamic Index.
2. Batasa Syariah is an investment product offered by Batasa Capital which was initially offered on July 22nd 2003. Batasa Capital offered gradual offering until it reached 300,000,000 investment unit. 70% of Net Asset Value is invested in debt including sukuk with repmchase agreement (REPO) and the rest is invested in equity.
4. Dana Selaras Dinamis was initially offered on February 10th 2004, the investment composed of 30% debt instrwnent and 70% in equity. Dana Selaras Dinamis offered 1,000,000,000 investment units and managed by PT Bahana CTW Investment Management.
5. Dana Tetap Optima is an investment fund offered by PT. Danareksa Investment Management with effective date is on may 22nd 2003 and its offering date is 19th May 2003. 80% - 100% of wealth of Dana Tetap Optima will be invested bond and the rest will be invested in money market securities. PT. Danareksa Investment Management had gradually offered initial offering until it reached 2,000,000,000 (two billions) enclosed unit.
6. Danamas Stabil was firstly introduced in February 24th 2005 by PT Sinarmas Sekuritas witl1 2,000,000,000 investment unit. Dananlas Stabil composed of 80% - I 00% debt instrument and 0% - 20% composed of money market, or equity instrument.
7. PT First State Investments iョ、ッョ・セゥ。@ offered First State lndoequity Sectoral Fund on January l 8tl1 2005 with 500,000,000 investment unit. 80% 100% of fund is invested equity or in the form of stock and 0% -20% is invested in debt instrnment that has the ma.turity less fuan one year.
8. Fortis Pesona is an investment fund product offered by PT. Fortis Investment. the initial offering of Fortis Pesona was on November tenth
5,858,333,872. Fortis Pesona is targeting 80% of inves1ment in equity, I 0% in money market and I 0% in capital market.
9. Makinta Mantap is introduced by PT Makinta Securities on August 18th 2005, with 500,000,000 investment unit and the portfolio composed of bond, stock and money market instrument with the range 5% - 75% for each fund composition.
10. Mandiri Investa Atraktif is a product of PT Mandiri Manajemen Investasi that offered on August 30 2005 with 500,000,000 investment unit. Mandiri Investa Atraktif is composed of 80 - 98% equity instrument that listed in Indonesia Stock exchange and 2% - 20% is in money market instrument that has the maturity within a year.
11. Manulife Dana Campman is aiming to get increasing capital with high return. Manulife Dana Campman is initially offered on August 14th 2004, composed of 40% minimum and 60% maximum wealth in equity and 40 minimum and 60% maximum in debt in Rupiah curre:ncy which the debt is offered through initial public offering and listed in Indonesia Stock Exchange with l year maturity. Manulife Dana Campman composed of 300,000 enclosed unit.
offering and listed in Indonesia Stock Exchange with l year maturity.
Manulife Dana Campuran composed of300,000,000 enclosed unit.
13. Panin Dana Maksima is an investment fund offered by PT Panin
Sekuritas, with 300,000,000 enclosed unit. 70% of wealth is invested in
equity and 30% is in money market securities.
14. PT. Panin Sekuritas offered Panin Dana Utama Plus on 7 October 2002,
with 312,940,000 enclosed units. PT. Panin Sekuritas implement 80% of
its wealth in debt market and the rest is in money market instrument.
15. Schroder Dana Istimewa was effective on December 21st 2004 and
offered initially on December 27th 2004 by PT. Schroder Investment
Management Indonesia Schroder Dana Istimewa is composed of 80% in
equity of local listed company or international or listed international
corporation and the rest of it is invested in money market instrument, with
1,000,000,000 (one biiiion) units enciosed.
16. Schroder Dana Kombinasi was initially offered on December 27th 2004
by PT. Schroder Investment Management Indonesia. Schroder Dana
Kombinasi is composed of 30% equity instrument and 70% in fixed
income security with one billion enclosed unit.
17. Schroder Dana Prestasi Plus was introduced to the market on September
25th 2000 by PT Schroder Investment Management Indonesia. The
investment fund is composed of 80% in equity and 20% in money market
Prestasi Plus offered 1,000,000,000 investment units; the investment itself has reach 1200% growth since 2000 to 2007.
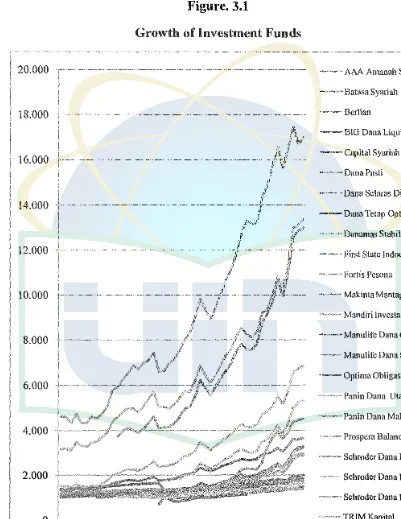
Figure. 3.1
Growth of Investment Funds
20.000 - - AAA Amanah Syariah Fund
---- Batasa Syariah
18.000 Mᄋセセ@ Berlian
セMbig@ Dana Liquid
16.000 セセc。ーゥエ。ャ@ Syariah Flei
-·--Dana Sclaras Dinamis
--Dana Tetap Optima
GGBGBGセᄋMセB@ Danamas Stabil
12.000 --First State Indocquity
MセMセ@ Fortis Pcsona
JMセM Makinta Man tap
- - - Mandiri lnvesta Atraktif
8.000 --·-Manulife Dana Campuran
" • •m-••··· Manulife Dana Saham
セMMセ]Moーエゥュ。@ Ohligasi
·--- Pnnin Dana Utan1a Plus
MセセセBM Panin l)ana Maksima
BᄋMセMMMMMセM Prospcra Balance
MセMMMセMMMセs」ィイッ、・イ@ Dana Istimewa
2.000 Schroder Dana Kombinasi
B. Performance Evaluation of Investment Fund 1. Sharpe Measure Approach
William F. Sharpe ( 1966) measures reward to risk ratios. The Sharpe measure employs standard deviation to its denominator. It measures the risk premimn per unit of total risk. Sharpe therefore would compare to the CML instead of Treynor's SML. The Sharpe Ratio is also known as the reward to risk ratio, or more descriptively, the excess return to variability measure. The Sharpe reward to variability index; based on the assmnption that total risk, including firm-specific risk, is valued by the market and should be taken into consideration when comparing one investment to another.
Investment Fund N
AAA Amanah Syariah
296 Fund
Batasa Syariah 296
Berlian 296
BIG Dana Liquid 296
Capital Syariah Flexi 296
Dana Pasti 296
Dana Selaras Dinamis 296
Dana T etap Optima 296
Danamas Stabil 296
First State Indoequity 296
Fortis Pesona 296
Makinta Mantap 296
Mandiri lnvesta Atraktif 296
Manulife Dana Campuran 296
Manulife Dana Saharn 296
Optima Obligasi 296
Panin Dana Utama Plus 296
Panin Dana l'vfaksima 296
'"'"L
Table. 4.1 Descriptive Statistics
Minimum M::ximum
0.10417 !04.03 l
0.3518 0.6852
-0.98964 0.85089
0.00282 0.81482
0.05546 0.45471
0.40601 0.78282
0.02134 102.912
0.2116 0.47052
0.11356 0.43993
0.1805 674.529
401.582 1.236.574
0.10249 367.449
0.25663 23.062
0. !4905 272.726
13.239 601.869
0.18545 0.71598
0.01152 259.669
0.29111 1.674.424
fl ?R?61 194.161
Mean Std.
Deviation
0.64 0.238866
0.59196 0.055238
0.72347 0.173378
0.60007 0.298226
0.2968 0.076331
0.69429 0.054334
0.64241 0.209396
0.42141 0.034968
0.31469 0.043773
143.267 0.532659
887.472 186.505
230.704 0.871222
!37.191 0.453674
207.9! 5 0.355487
'l!S.009 0.962504
1).61254 0.075154
0.66947 0.128791
138.927 2.596.043
Schroder Dana Kombinasi 296 0.08547 0.63875 0.45878 0.116624 Schroder Dana Prestasi
296 0.66632 l.274.747 923.898 1.847.306 Plus
TRIM Kapital 296 103.021 450.396 293.74·9 0.762731
Trimegah Dana Stabil 296 0.165 117.679 0.43756 0.089515
The table above shows descriptive statistics as a result of SPSS 14.0;
computation of standard deviation of investment funds. This standard
deviation is result of 296 days of Net Asset Value of investment fund.
Below is performance evaluation of investment fund after subtracting
Rp
with Rr and dividing the result of subtraction with standard deviation ofportfolio.
Table. 4.2
Performance Evaluation of Investment Fund: Sh:arpe Ratio
Investment Fund RP Rr <5
(R.-Rrl
Rank
<5
Fixed Income Fund '
0.17341
1 Berlian 0.7235 0.0869 3.6715 7
2 Dana Pasti 0.6943 0.0869 0.0543 11.1786 1
3 Panin Dana Utama Plus 0.6695 0.0869 0.1288 4.5232 5
4 Optima Obligasi 0.6125 0.0869 0.0752 6.9940 3
5 BIG Dana Liquid 0.6001 0.0869 0.2982 1.7207 8
6 Trimegah Dana Stabil 0.4376 0.0869 0.0895 3.9172 6
7 Dana Tetap Optima 0.4214 0.0869 0.0350 9.5658 2
8 Danamas Stabil 0.3147 0.0869 0.0438 5.2036 4
Balanced Fund
l Fortis Pesona 8.8735 0.0869 l.8651 4.7112 3
2 Manulife Dana Campuran 2.0789 0.0869 0.3555 5.6037 2
3 Prospera Balance 1.1391 0.0869 0.3852 2.7313 6
4 Dana Selaras Dinamis 0.6423 0.0869 0.2094 2.6523 7 5 AAA Amanah Syariah Fund 0.6399 0.0869 0.2389 2.3149 8
6 Balasa Syariah 0.5920 0.0869 0.0552 9.1429 1
7 Schroder Dana Kombinasi 0.4587 0.0869 0.1166 3.1883 4
2 Schroder Dana Prestasi Plus 9.2379 0.0869 1.8473 4.9537 2 3 Manulife Dana Saham 4.1795 0.0869 0.9625 4.2520 3
4 TRlM Kapital 2.9368 0.0869 0.7627 3.7365 4
5 Makinta Mantap 2.3066 0.0869 0.8712 2.5478 6
6 First State Indoequity l.4323 0.0869 0.5327 2.5258 7 7 Mandiri Investa Atraktif l.3715 0.0869 0.4537 2.8316 5 8 Schroder Dana lstimewa l.368! 0.0869 0.9250 l.3851 8
From the table above it can seen that the higher the return of portfolio does not mean that the higher the rank of investment fund itself. The Balanced Fund shows this inconsistency, it can be seen that Berlian is in the first place of Rp for fixed income fund (0. 7235) but placed as the seventh for Sharpe measure. Where it has very high volatility of NA V (0.1734), thus it has very high risk.
Batasa Syariah which in fifth place in Rp is placed at first place in Sharpe measure for Balanced Fund (Rp is 0.5920). Where it can maintain its volatility up to 0.0552. The consistency between the Rp and the rank can be seen in Equity Fund. Panin Dana Maksima: first place in Rp (13.8921) and also first place in Sharpe measure (5.3178) with 2.5960 volatility.
Table below shows how return of portfolio correlate to Sharpe measure. It shows that Balanced Fund has very low correlation between its Rp with its performance of Sharpe measure (.139), while Equity Fund shows that it's Rp
'
R, Fixed Income Fund 1
l, Fixed Income Fund Pearson Correlation
Sig. (2-tailed)
N
l., Balanced Fund Pearson Correlation
Sig. (2-tailed)
N
R,, Equity Fund Pearson Correlation Sig. (2-tailed)
N
Sharpe Ratio affixed Pearson Correlation Income Fund Sig. (2-tailed)
N
Sharpe Ratio of Pearson Correlation Balanced Fund Sig. (2-tailed)
N
. Sharpe Ratio of Equity Pearson Correlation
I
Fund Sig. (2-tailed)l
N* Correlation is significant at the 0.05 level (2-tailed). ** Correlation is significant at the 0.01 level (2-tailed
51 1 8 .568 .1421
NQTR」ᄋセ@
I
.035 8 .742(*) .035 8 -.064 .881 8 .907(**) .002 8Table. 4.3
Correlations
R,, Balanced R,, Equity
Fund Fund
.568 I .742(*)
.142 .035
8 8
I .914(**) .001
8 8
.914(**) 1
.001
8 8
.914(**) l.000(**)
.001 .000
8 8
.139 .148
.743 .726
8 8
.6881 .858(**)
.059 .006
8, 8
I
Sharpe RatioI
Sharpe Ratioof Fixed of Balanced Sharpe Ratio Income Fund Fund of Equity Fund
.742(*)
I
-.064 .907(**).035 .881 .002
8 8 8
.914(**) .139 .688
.001 .743 .059
8 8 8
1.000(**) .148 .858(**)
.000 .726 .006
8 8 8
1 .148 .858(**)
.726 .006
8 8 8
.148 1 .100
.726 .814
8 8 8
.858(**) .100 1
.006 .814
2. Treynor Measure Approaeh
Instead of using standard deviation
as
its denominator in its measure, Treynor uses beta of portfolio as denominator in its equation. A characteristic line is developed that compares and defines the risk - return relationship. The slope of the line is the beta coefficient (J3). The beta of an asset measures the variability of an asset relat