CHAPTER II
THEORETICAL BACKGROUND AND PREVIOUS RESEARCH
2.1 Theoretical Background 2.1.1 Investor
According to Liaw (2004) investors clients can be distinguish between investment management for individual investors and institutional investors. According to Investopedia, definition of Individual investor is investors who buy and sell securities for their personal account, and not for another company or organization (http://www.investopedia.com). Investopedia define institutional investor as a non-bank person or organization that trades securities in large enough share quantities that they qualify for preferential treatment and lower commissions. (http://www.investopedia.com). McMillan et al. (2011) explain that Individual investors’ short term goals planning are such as providing children’s education, saving for major purchase or starting business and also to get income in the retirement period.
2.1.2 Nature of Investment
Jones, Charles P. (2009) define that an investment is the commitment of funds to one or more assets that will be hold over some future period. It is concerned with the management of investor’s wealth. Rose, Peter S. and
Marquis, Milton H. (2008) explains that investment generally refers to the acquisition of capital goods such as buildings and equipment, and the purchase 2.1 Theoretical Baackckground
2.1.1 Inveeststor A
According too LLiaiaw w (2004) investors clilienntsts ccaan be distinguuisi h between
innvvestmentnt mmananagemenentt for individual investorsrs and iinsn tititututitional invnvestors.
Accordrdining g tto Invnvestopedia, definition of Individual investorr is inveeststorors s who bub y
annd d selll sececurities for their personal account, and not for anotother cocompmpany oor
or
orgaganizaattion (http://www.investopedia.com). Investopedia definee innststititututioi nal l
investoor as a non-bank person or organization that trades securitties in largrgee
enouggh share quantities that they qualify for preferential treatmentt and llooweer
commmiissions. (httpp:///w/wwwww.invinvesestopedia.com)m). McMcMiMillllanan et al. (2011))eexxplain tthahatt
Individual investors’ short term gooalals plplanning are such as providing childrdrenen’’s
ed
educucatatioion, saving for major purchase or starting business and also to gegett inincocomeme in
th
the erer tirement periot iod.d.
2.1.2 Nature of Investment
Jones, Charles P. (2009) ded fine thaat an investment is the commitment of
funds to one or more assets thatt will l be hold over some future period. It is
of inventories of raw materials and goods to sell. The form of investment for business firm, government, and house hold is different. In business firm, expenditures on capital goods and inventories are including as investment expenditures. For government, the spending to build and maintain public facilities is the form of investment. And in the household the form of investment is such as purchase a house. Investments often require huge of funds, especially business firm as the leading investment sector in the economy, but it can increase the productivity of labor and leads to higher standard of living. The huge funds can be raised quickly by selling financial claims in the financial markets. Financial claims promise investors to get a future flow of income the form of dividends, interest, and other return. Investor will expect not only recover the original fund but also additional income as reward for waiting assuming risk, even there is no guarantee that the expected income will ever materialize.
According to Damodaran, Aswath (2012) there are three steps that investors consider in investment choices, such as:
a) Asset allocation, in these step investors will determine which asset classes to invest their funds in. this is the first and the most important step and will depend on investor preferences.
b) Asset selection: in asset classes that choose in the first step investors have to choose the specific asset to hold.
expenditures on capital gogoodods and inventntorories are including as investment
expenditures. For r government, the spending to bubuilild and maintain public
facilities is s ththe form of investmem ntn. AnAnd d inin thehe household thefforo m of investment
is succhh as purchasee a ahohousu e. Investments oftfen rreqequiuirere huge of fundsds, especially
bu
business ffirirm m as thee lleading investment sectorr iin n the ececononoomy, butut it can
increaeasese tthhe pprroductivity of labor and leads to higher statandardd ofof lliviving. TThe
hu
huge fundds can be raised quickly by selling financial claimss in ththee ffinanciaal
ma
markettss. Financial claims promise investors to get a future flow oof inncocomeme the
form of dividends, interest, and other return. Investor will expeect not onnlyly
recovver the original fund but also additional income as reward for wwaiaitingg
assuumming risk, eveenn ththereree isis no guarantee ththatat tthehe eexpxpected incomeme will eveverer
materialize.
According to Damodaran, Aswath (2012) there are threeee stepepss tthhat
in
invev stors consididerriin n ininvvestmentnt cchohoiciceses,, ssuch as:
a)) AsAssset allocation, inin these stetep investors wiillllddeteerminenewwhich asset
classes to invest their fundds in. this is the first and the most
important step and dwill depeend on investor preferences.
b) Asset selection: inn assseet classes that choose in the first step
c) Performance Evaluation: The judgment that investors made to choose investment will depend on how the investor measure risk and trade off to get higher return.
According to Jones, Charles P (2009) the foundation for making investment decision are the tradeoff between expected return and risk, the investment decision process that practiced nowadays is the great unknown; all the investors have to deal with uncertainty that the realized return on any risky assets may be different from what was expected. Third is the global investment arena, where investors have to think investment in a global context and the last is importance of internet, where investors can access a wealth of information about investing, trade cheaply and quickly for their investment. According to Obamuyi, Tomola Marshal (2013) there are five principal factors that influencing investment decision, which are performance of the company’s stock, expected stock split/capital
increases/bonus, dividend policy, expected corporate earnings and get-rich-quick. That research also found that the socio-economic characteristics of investors (age, gender, marital status and educational qualifications) influence in the investor investment decision. According to Barber and Odean (2001) selecting common stocks that will outperform the market is a difficult task.
According to Chandra, Abhijeet (2009) Individual investors take trading decisions based on their self-perceived competence that is influenced by several factors, such as:
and trade off totogget higher retuturnrn.
According to Joneses, Charles P (2009) the foundationon for making investment ff
decision aree the tradeoff betwtweeeen n exexpepectctedd return and risksk,, the investment
decisionon process that t prpracactticed nowadays is thhe ggrereatat uunknown; all ttheh investors
haavve to deealal wwitithh unceertrtaiainty that the realized retuurnrn on annyy ririsksky y assets mmay be
differenent t frfrom wwhat was expected. Third is the global invevestmentnt aarerenan , whwhere
innvevesttors hahave to think investment in a global context and the lastt is impmporortance oof
in
inteterrnet,,where investors can access a wealth of information about innvestitingng, ttrade
cheaplyy and quickly for their investment. According to Obamuyi, Tommola Marshhala
(2
( 013)) there are five principal factors that influencing investment deciision, wwhichh
are peperformance ofof tthehe ccomo pany’s stotockck, exexpepected stock sspplit/cappititalal
increases/bonus, dividend policy, exxpepectcteed corporate earnings and get-rich-q-quiuckck.
Th
Thattrresesearch also found that the socio-economic characteristics of innvevestororss(a(agge,
ge
gendnder, marititall statatusus aandnd educacatitiononalal qquuallificatiionons)s) iinfnflluence iin thee ininvvestor
investstmement deccisisioion. According tto o Barberer and Odean (20200101) ) selectctining common
stocks that will outperform the mmarket is a ddifficult task.
According to Chandra, AbAbhijeet (22009) Individual investors take trading
decisions based on their self-perceiivev d ccompetence that is influenced by several
1. Income
Chandra, Abhijeet (2009) explain that Individual with higher income found to be more confidence than individual with lower income. It is prove that investor with higher income is more confidence to make a judgment in investment. This research found that significant income level leads investors to be more confident and they are more willing to act on their own judgments in term of investment in stock market.
2. Gender
As stated on Barber and Odean (2001) that Psychological research has established that men are more overconfidence than women, especially male-dominated in finance sector. The result of the research are supported the financial model that men are more confidence than women. Men trade worse than women and they reduce their return more so than women do.
3. Age
Chandra, Abhijeet (2009) explain that investor trade less frequently as they grow older, they tend to play safe with their funds. The research also found that investors in the age group 25-35 years and 35-45 years are more competence and having more passion in high return.
4. Knowledge
a. Education Background
Chandra, Abhijeet (2009) explain that perception and knowledge of investors could make them become overconfidence. Higher level of education makes an investor feel competence and found to be more confidencee ththan individuaall wiwth lower income. It is prove that
investor with highgheer income is more confidence ttoo make a judgment in
investment. ThThis research found d thhatat siggninifificac ntnt income level leeada s investors to be
more ccoonfident and tthhey y arare more willing to act onn theheirir own judgmenntst in term of
innvvestmentntiin nststoco k maarkrkeet.
2.
2 GeGendn er
Ass stated on Barber and Odean (2001) that Psychologigical reresesearch haas
es
estatabblishhed that men are more overconfidence than women, esppeciaalllly y mam
le-dominaated in finance sector. The result of the research are supported tht e financciaial
modell that men are more confidence than women. Men trade worsetthan wowomenn
and ththeey reduce their r reretuturnrnmmorore so than womemenn dodo.
3. Age
Chandra, Abhijeet (2009) explain that investor trade less frfreqequeuenntlyly as
th
theyey grow oldlder, thehey y tetendnd to pllayayssafafee wiwithth their ffunundsds.. ThThe research aalslsoo ffound
thatiinvnvese tors in n ththe age group 255-3- 5 yearrss and 35-45 yeararssarare morereccompetence
and having more passion in high return.
4. Knowledge
a. Education Backgrounnd
lead them to make frequent trading decision in financial market. Education status determines their understanding of financial product, offers, and opportunity that makes them to be more confidence in makes a financial decision.
b. Information
According to Merton, Robert C. (1987) based on asset pricing models, investors act on every type of publicly available information instantaneously as soon as it received. There are two information costs: (1) the cost of gathering and processing data and (2) the cost of transmitting information from one party to another source of information such as firm itself, stock market advisory services, brokerage houses, and professional portfolio managers. According to Lee et al. (2008) nowadays Individual investors become more dependent on multimedia information and increase their understanding by information that posted on the web. Investors will collect all the relevant company stock information before they decide to investing their funds.
This research is using control variable to clearly explain the influence of main variable or the independent variable which is investor attention of company stock information (using Google search volume) to the dependent variables. It support by dictionary.com that control variable is a factor held constant to test the relative impact of an independent variable (http://dictionary.reference.com). Control variable that used in this research are:
product, offerrss, and opportutuninityty that makes them to be more
conffididence in makes a financial decision.
b.
b. Information
Ac
Accocording to Merton, RRoboberrt t C.C (1987) basesed on asset
pr
pricing momoddels, investors act on everery y typee of f pupublicly aavav ilable
in
infformation instantaneously as soon as it recceievedd. TTheherere are two
information costs: (1) the cost of gathering and proocesssining g ddata annd
(2) the cost of transmitting information from one paartry toto aanonother
source of information such as firm itself, stock markek t advisooryry
services, brokerage houses, and professional portfolioo manaagerss.
Accordrdiningg toto LLee et al. (200008)8) nnowowadadays Individuualal investotorsrs
become more dependndenent t on multimedia information and incrcreaeasse
their understanding by information that posted oonn thehe weweb.
I
Inveeststororss will colollelectct aallll thethe relevanntt cocompm any stock innfoformrmation
be
befofore they decidetto investtining their funds.
This research is using coontrol variaable to clearly explain the influence of
main variable or the independentt variable wwhich is investor attention of company
stock information (using Google sesearchh volume) to the dependent variables. It
a) Size
According to Cornett et al. (2009) company size can be measure by market capitalization or market value. According to InvestingAnswer market value of equity is the total market value of all of a company's outstanding shares (http://www.investinganswers.com).
b) Market to book ratio
Market to book ratio is risk factors that must be consider by the investor. If the price is high it indicating that the firm is undervalued. A value that less than 1 is means that the firm is undervalued. The higher the market to book ratio is better the firm.
c) Age
The company age, start from the company IPO until the years 2013. d) P/E ratio
Price earnings ratio (P/E ratio) is to understand the effect of market towards stock performance that can be seen from the EPS. It compares the stock price with earning per share. According to Cornett et al. (2009) price earnng ratio is measure the willingnes of investors to pay for each dollar the company earn per share of its stocks. The higher the price earning ratio is the better the compamy performance.
market capitalization or mararkekett value. AAccccorording to InvestingAnswer market
value of equity is tthehe total market value of all of a compmpany's outstanding shares
(http://www.w.ininvestinganswers.ccomom).)
b) MMarket to bookokrratatiio
Maarkrketet tto obookkrratatiio is risk factors that muststbbe conssididererbby ythe invevestor. If
the prpricice eisis high h iit indicating that the firm is undervalued. AA value tthahat t leless thahan 1
is mmeans thahat the firm is undervalued. The higher the market to bobook rratatioio is betteer
th
thee fifrm..
c) Age
The coompany age, start from the company IPO until the years 2013.
d)
d) P/E ratio
Price earnings ratio (P/E raratito)o) is to understand the effect of mamarkrkeet
to
towawardrds s stock performance that can be seen from the EPS. It compparareses thehe sstotock
pr
pricice ewithh earning pi perer sshahare. Accocordrdining g toto CCornett etetaal.l (2(200009)9) price eari arnnnngg ratio
is meaeasusure the wwilillilingnes of invesstot rs to papay for each dolllalarr ththe compmpanany earn per
share of its stocks. The higher ththe price eaarning ratio is the better the compamy
2.1.3 Capital Market
According to Rose, Peter S. and Marquis, Milton H. (2008) capital market is designed for long term loans (credit) investment by business, government, and household. The original maturity of this financial instrument is more than one year and the range loan in size from small to multimillion credits. Obamuyi, Tomola Marshal (2013) define that efficient funds transfer between lender and borrower is the basic function of capital market. There are three basic objectives which makes investors invest in capital market:
1. Wealth maximization 2. Liquidity maintenance 3. Risk minimization
According to Fabozi, Frank J. and Drake, Pamela Peterson (2009) there are two types of capital market securities which are equity and debt. Equity is issued by corporations and represents shares of ownership interest. It includes common stock and preferred stocks. Common stock is a perpetual security that has no maturity and it is represent the ownership of the corporation. Preferred stock is representing ownership interest in a corporation that has redemption date. And the other capital market securities is debt obligation that issued by corporation and local government. It is a financial instrument whereby the borrower promises to repay the maturity value one year after insurance.
According to Rose, PetetererSS. and Marqrquiuis, Milton H. (2008) capital market
is designed for longng term loans (credit) investment bybbusu iness, government, and
household.. TThe original matuurrityy oof ththisis ffinanancial instrumenntt is more than one
year aand the rangee loaoan n in size from smalll to mumultltimimillion creditsts.. Obamuyi,
T
Tomola MMararshshaal (201313)) define that efficient fundsnds transfferer bbetetwween lennded r and
borrrowowereriis thheebasic function of capital market. There are etht ree babasisiccobo jecttivi es
wh
whiichh maakkes investors invest in capital market:
1. Wealth maximization
2. Liquidity maintenance
3. Risk minimization
According too FFababozozii, FFrar nk J. and DrDrakakee, PPamamela Peterson ((202009) thhereree
are two types of capital market seecucuriitities which are equity and debt. Equiuityty iis
is
issus eded bby y corporations and represents shares of ownership interestst.. ItIt iincncluluddes
co
commmmon stock andk nd pprerefeferred stod tockckss.. CoCommmmon stockck iiss a perpetual secucurirityty that
has nono mmaturitity y aand it is represenent the owownership of thehe ccoro pop ratitionon. Preferred
stock is representing ownership iinterest in aa corporation that has redemption date.
And the other capital market securitiess is debt obligation that issued by
corporation and local governmentnt. It is a financial instrument whereby the
There are some indicators that can be used to measure the performance of capital market. These indicators such as:
a) The number of listed company, according to businessdictionary.com this is the sum of company that listed on each of stock market. Company listed is firm whose share is listed (quoted) on an exchange market for public trading. A company can be listed on more than one exchange market that called dual listing (http://www.businessdictionary.com). The more the number listed company it means that the more liquid that market.
b) Total Trading Volume, it is measure how many trades take place for a security or on an exchange on a given trading day. A high trading volume is an indicator of a high level of interest in a security at its current price. It is an important tool in technical analysis, trading volume is used to determine the strength of a market indicator (http://financial-dictionary.thefreedictionary.com).
c) Market Volatility, according to investorwords it is the unpredictable and vigorous changes in the price within the stock market. It is necessary for some movement within the market in order to sell commodities, however a volatile market represents the most risk to investors (http://www.investorwords.com).
Investopedia defined that market volatility is a statistical measure of the dispersion of returns for a given security or market index. Higher the volatility are the riskier the security (http://www.investorwords.com). Market volatility will measure from these two components which are Risk a) The number of listed ccomompany, accordrdining gto businessdictionary.com this is
the sum of ccoompany that listed on each of stock kmam rket. Company listed is
firm wwhose share is liststedd ((quuototeded) ) onon an exchange mam rket for public
t
trading. A comompapanyny can be listed on moree tthahan n one exchangee market that
calllleded dduau l liststining (http://www.businessdidictctioi nary.ccomom).). The mmoro e the
nu
numbm er lliisted company it means that the more liquid d tht at mararkeket.t.
b)
b) Totatal Trading Volume, it is measure how many traddees takeke pplace foor
a
a security or on an exchangeon a given trading day. A highgh ttrarading
volume is an indicator of a high level of interest in a seccurity at iitss
current price. It is an important tool intechnical analysis, tradding voollumme
is used to deteterermiminene ttheh strength off a maamarkrketet indicator (r httpp:/:///financiciaal-
-dictionary.thefreedictionary.c.comom).)
c)
c) Market Volatility, according to investorwords it is the unprp ededicictaablble e aand
viigorous chanhangegessiin the prpriciceewiwiththinin the stocckk mamarkket. t IIt iis nececessssarary for
so
s me momovevement within thehe marketinin order to selllcocommmmoditieiess,hhowever a
volatile market representts the most risk to investors
(http://www.investorwordds.scom).
Investopedia defined that mmarketet volatility is a statistical measure of the
of Market and Return of Market. Risk of Market shows the Risk of each market that will take by the investor. Risk of market can either be measured by using the standard deviation or variance between returns from that same security or market index (http://www.investopedia.com). d) Market Capitalization, According to investorwords, it is represents
the aggregate value of a company or stock. It is obtained by multiplying the number of shares outstanding by their current price per share. Market capitalization is use to see the size of the market. The higher the amount of capitalization market it is means the higher the size of the market (http://www.investorwords.com)
2.1.4 Random walk Theory and Efficient Market Hypothesis
According to Bodie et al. (2008) random walk theory is the notion that stock price changes are random and unpredictable. If stock price movement were predictable, that would be damning evidence of stock market inefficiency.
According to Rose, Peter S. and Marquis, Milton H. (2008) the efficient markets hypothesis suggest all information that has bearing on the market value the prices of that assets. Bodie et al. (2008) define that efficient market hypothesis is the hypothesis that prices of securities fully reflect available information about securities. It’s clearly define by McMillan et al. (2011) that efficient market is a market in which asset prices fully reflect all past and present information; market in which asset prices reflect the new information quickly and rationally. The important point of efficient market is price should be expected react only to the measured by using ththee standard ddeveviaiation or variance between returns
from that saamme security or market index (http:///wwwww.investopedia.com).
d) Markkeet Capitalization, AAccccorordidingng to o investorwords,s it is represents
t
the aggregateevavalulueeof a company or stockk.. ItIt iiss obtained by y multiplying
the e nunumbmberof shshaares outstandingby their ccururrent prpriciceepeper share. Market
ca
capipitalizazattion is use to see the size of the market. Thehe higheh r r ththe e ama ounnt of
capipittalization market it is means the higher the sizee of tthehe markeet
(h
(http://www.investorwords.com)
2.1.4 Random walk Theory and Efficient Market Hypothesis
According too BBododieie etet al. (2008) randndomom wwalalk k theory is the e nnotion tthahatt
stock price changes are random andnduunpnprredictable. If stock price movement t wewerre
pr
prededicictatable, that would be damning evidence of stock market inefficienenccy.
Ac
A cordiding toto RRoose, Peterr SS. anand d MaMarquis, MMililtoton n HH. ((20200808) the e efeffificient
markketetss hyypop ththesesisis suggest all infnformationon that has beariningg on thee mmaarket value
the prices of that assets. Bodieett al. (2008) define that efficient market hypothesis
is the hypothesis that prices of seecurities fufully reflect available information about
securities. It’s clearly define by MccMillalan et al. (2011) that efficient market is a
elements information release such as unexpected or surprise information and investors process the unexpected information and revise expectation.
Rose, Peter S. and Marquis, Milton H. (2008) explains that if efficient market hypothesis is correct, investors will react to temporary underpricing or temporary overpricing of assets and make changes in their portfolios because any temporary deviation of actual returns from expected returns should be eliminated.
McMillan et al. (2011) also stated that there are some factors that contributing to market efficiency such as market participants where the number of investors (individual and institutional) related to the market efficiency. Other factor is information availability such as trading activity and traded companies and financial disclosure. There are two costs that incurred by traders in identifying and exploiting possible market inefficiencies affect the interpretation of market efficiency. First is transaction cost, according to Investopedia (http://www.investopedia.com) it is an expenses that incurred when buying or selling securities. Transaction costs include brokers' commissions and spreads (the difference between the price the dealer paid for a security and the price the buyer pays). Second is information acquisition cost, the cost of a business to acquire a new customer. The company recognizes costs, including marketing and incentives, to introduce new customers to the company's products and services. The customer acquisition cost is calculated by dividing total acquisition costs by total new customers over a set period of time.
According to Bodie et al. (2008) in market equilibrium, efficient informational gathering should be beneficial, because when information cost
Rose, Peter S. and MMararquis, Miltonn HH. (2008) explains that if efficient
market hypothesis isis correct, investors will react to tetempm orary underpricing or
temporary ovoverpricing of assetss annd d mamakekecchahangnges in their portrtfofolios because any
temporraary deviation oofaacttuual returns from expecteed drretuturns should beeeliminated.
Mc
McMiMilllana et aall. (2011) also stated that t ththere arare sosomem factotors that
contriribubutitingng to mmarket efficiency such as market participantts swhereeththe e nun mbbeer of
innvevesttors (i(individual and institutional) related to the market eefficieiencncyy. Otheer
fa
factctoor is s information availability such as trading activity and traddede ccomompapanies
and finnancial disclosure.. There are two costs that incurred by tradersinn identifyiningg
and exxploiting possible market inefficiencies affect the interpretationn of mmaarkeet
efficicienency. First isis ttraransn action cosstt, aaccccorordidng to InInvvestopedediaia
(h
( ttp://www.investopedia.com) it iiss ann expenses that incurred when buyiningg oor
se
sellliningg securities. Transaction costs include brokers' commissions anddssppreaeadsds((tthe
di
diffffereence bbetween tt thehepprice thei ddeaealelerr papaididffor a sececururitity yandd ththe price ththe bbuyer
pays)). SeS condd iissininformation acququisition ccost, the cost off aa bub sinessss ttoo acquire a
new customer. The companyy recognizees costs, including marketing and
incentives, to introduce new custot mers too the company's products and services.
The customer acquisition cost is calalculaatted by dividing total acquisition costs by
investors’ money to uncover and analyze, investors will expect the investment
analysis result can increased the expected return and investor will have an incentive to spend time and resources to analyze and uncover new information only if that activity can generate higher investment return.
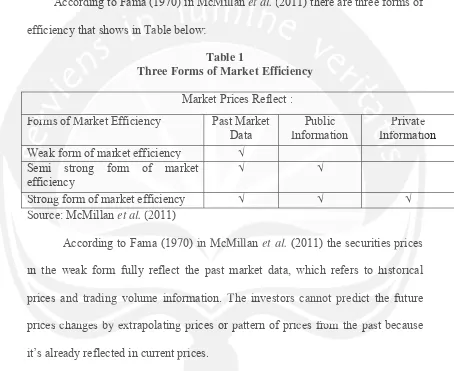
According to Fama (1970) in McMillan et al. (2011) there are three forms of efficiency that shows in Table below:
Table 1
Three Forms of Market Efficiency Market Prices Reflect : Forms of Market Efficiency Past Market
Data
Public Information
Private Information Weak form of market efficiency √
Semi strong form of market efficiency
√ √
Strong form of market efficiency √ √ √
Source: McMillan et al. (2011)
According to Fama (1970) in McMillan et al. (2011) the securities prices in the weak form fully reflect the past market data, which refers to historical prices and trading volume information. The investors cannot predict the future prices changes by extrapolating prices or pattern of prices from the past because it’s already reflected in current prices.
Prices in Semistrong form efficient market reflect all the past and publicly available information. In Rose, Peter S. and Marquis, Milton H. (2008) all buyers and sellers are rational and use the all publicly available information to help them value financial assets.
Strong form shows that securities prices is fully reflect all the public and private information such as information that possessed by insiders who work with incentive to spend time and reressources to ananalylyze and uncover new information
only if that activity ycacan generate higher investment returrn.n
Accorddining to Fama (1970)) in n McM MiMillllanan etet al. (2011) theree aare three forms of
efficienency that shows sininTTaba le below:
Table 1
Three Forms of Market Efficienncycy
Market Prices Reflect :
Foormrms of MMarket Efficiency Past Market Data
Public Information
Pr P ivattee Innfoformr atiio We
Weak ffoorm of market efficiency √ Semi strong form of market
efficieency
√ √
St
Srongg form of market efficiency √ √ √
Sooururcee: McMillan et al. (2( 011)
According to Fama (19770)0) iin n McMcMiMillllan et al. (2011) the securities prpricicees
in
in ttheh weak form fully reflect the past market data, which refers to hhisistotoririccal
pr
priciceses aandnd ttraradidingng vvololumume e ininfoformrmatation.n. TheThe iinvnvesestotorsrs ccanannonott prprededicictt ththe e fufuture
pricicese cchahangngeses bby yexextrtrapolating g prp ices or papattern of pririceces frfromom tthehe passtt because
it’s already reflected in current prriices.
Prices in Semistrong formm efficient mmarket reflect all the past and publicly
available information. In Rose, Peteter S. aannd Marquis, Milton H. (2008) all buyers
the company and have access to its privileged information as stated in Rose, Peter S. and Marquis, Milton H. (2008).
2.1.5 Asymmetric Information
According to Rose, Peter S. and Marquis, Milton H. (2008) asymmetric information is view that disputes the financial marketplaces contains pockets of inefficiency in the availability and use of information.
According to Investopedia, definition of asymmetric information is a situation in which one party in a transaction has more or superior information compared to another (http://www.investopedia.com). Others web sources (http://www.economicshelp.org) also stated that asymmetric information is a situation where there is imperfect knowledge. In particular, it is occurs where one party has different information to another. Asymmetric information should be eliminate through the increased of advanced technology because more people being easily to get information (investopedia.com). Many analysts agree that asymmetric information is harder to come by in developed than developing markets because information in developed markets easily spread timely in everywhere.
According to Rose, Peter S. and Marquis, Milton H. (2008) asymmetric information give consequences for the financial marketplace because there will be variations in both quantity and quality of the information available. But, the important point is that not all the information is good information, just having information that others don’t have doesn’t make the information more valuable or 2.1.5 AsymmetricicIInformation
Accoordrding to Rose, Peteter S.S. andnd MMararququis, Milton H. (2(2008) asymmetric
informmaation is view ththatat ddisputes the financial mamarkrketetpplaces containns s pockets of
inneefficiencycy iinn ththe avaiilalabibility and use of informatioion.n.
Ac
Accorddining to Investopedia, definition of asymmetric et iinfoformrmatation isi a
situtuattiion inn which one party in a transaction has more or supeerior iinfnfoormationon
co
compm areded to another (http://www.investopedia.com). Others wew b b sosouurces
(http:///www.economicshelp.org) also stated that asymmetric informmation is aa
situatiion where there is imperfect knowledge. In particular, it is occurss wherree one
party y hhas different ininfoformrmatatioion n to another. AAsysymmmmetetrirc informatioon n should bbee
eliminate through the increased ofof advdvanced technology because more pepeopoplle
be
beining g eae sily to get information (investopedia.com). Many analyyststss agagreree e ththat
as
asymymmetriic iinformaf matitionon iis hardrderer toto cocomme by inin ddevev leloped thd han dedevveloloping
markketetss becaususee information ini n developoped markets easasilily y sppreadad timely in
everywhere.
According to Rose, Peterr S. and MMarquis, Milton H. (2008) asymmetric
information give consequences forr the financial marketplace because there will
even correct (http://www.investinganswers.com). It’s supported by Rose, Peter S.
and Marquis, Milton H. (2008) that market inefficiency can be created by the presence of imperfect or bad information.
This is the theory where there are two kinds of investors, informed investor and uninformed investors. It can give unequally condition because the informed investor can have more information and knowledge that can give them a better understand and result in decision making to do investment as stated in web sources (http://www.investinganswers.com). It’s supported by Rose, Peter S. and Marquis, Milton H. (2008) that in the real word there is no market that either completely efficient or completely asymmetric, this book split the real world market into two segments, which are a highly efficient market that trade by well-informed individuals and institutions trader. The other segment is consisting of less-well-informed small investors’ trader, where information is asymmetrically distributed.
2.1.6 Google Trends
According to WhatIs.com, the definition of Google trend is an online search tool that allows the user to see how often specific keywords, subjects and phrases have been quires over a specific period of time. The result called as “search volume index” that displayed in graph. The data can be save as .csv file
and opened in excel (http://whatis.techtarget.com). Google trends is similar with Google Insight, according to Scheitle (2011) this search tool will provide data on the relative frequency of search terms entered by Google users across time and presence of imperfect or bad iinfnfoormation.
This is thee ththeory where there are two kindsds of investors, informed
investor andd uninformed investstorrs.s IIt cacan n gigveve unequally conndidtion because the
informmeed investor caan nhahaveve more information andd knknowowledge that cannggive them a
beettter unddererststanand dand reressullt in decision making toddo o investtmementnt as stated d in web
sourcees s (h(httttp://wwww.investinganswers.com). It’s supportedd bby yRoR sese, PePetet r S. and
Ma
Marqr uis, Mi Milton H. (2008) that in the real word there is no mmarketet tthahat eitheer
co
compm letetely efficient or completely asymmetric, this book split theth rreaeal l wow rld d
markett into two segments, which are a highly efficient market that traade by weell
ll-informmed individuals and institutions trader. The other segment is coonsistining ofof
less-wweell-informed ssmamallll iinvnvesestot rs’ trader, whwhereree ininfoformr ation is asyymmmetricaalllyy
distributed.
2.
2.1.1.66 GooglleTTreendndss Ac
A corddiningg to WhatIs.com,m, the defefinition of Goooglgle e trend d iiss an online
search tool that allows the user tto see how often specific keywords, subjects and
phrases have been quires over aa specificc period of time. The result called as
“search volume index” that displayyede inn graph. The data can be save as .csv file
geographic units. Scheitle (2011) also explain that the number of searches within a particular ecological case (e.g., a state) for a particular term or group of terms during a time period is determined and then will be normalized. Google.com define that the result in Google Trends are normalized to make it easier in comparing the search data and cancel out the variable’s effect on the data.
Normalized means sets of search data are divided by common variable such as total search. Without normalized, region with the most search volume would always rank highest (https://support.google.com). Scheitle (2011) also explain that the search that have highest rate with the “search term” will give a score of
100, the scale is from 0-100. These data are obviously based on the population using the Internet or, more precisely, the population of Internet users conducting searches on Google.
The researcher interested to use the search volume index from Google trends as the direct proxy for attention because from the search volume index we can see the frequency for a term that searched by the people, its supported by scheitle (2011) that if people are concerned or interested in a particular issue, they will be more likely to search for resources, news, websites, discussion boards, and other types of information related to that issue. As interest goes up or goes down over time, these searches will increase or decrease as well.
during a time period is deteermrmiined and thehenn will be normalized. Google.com
define that the resusultlt in Google Trends are normallizizede to make it easier in
comparing ththe search data annd d cacancncelel outou ttheh variable’s efeffef ct on the data.
Normalaliized means sseetss ofof search data are divi idideded bby y common variaiable such as
tootatal searchch. WiWitthout nonormalized, region with ththee mom st sseaearcrch h volumee would
alwaysys rranankk highghest (https://support.google.com). Scheitlele (2001111)) alalsoso expplain
thhatat tthhe seaarrch that have highest rate with the “search term” wiillll giveve aa score oof
10
100,0, thee scale is from 0-100. These data are obviously based on ththe popopupulalation
using tthe Internet or, more precisely, the population of Internet userss conductiingng
searchhes on Google.
The researchherer iintntereresesteted to use thee sseaearcrchh vovolume index ffrorom Googoglele
tr
t ends as the direct proxy for attentitioon bbecause from the search volume indeexx wew
ca
can n sesee e the frequency for a term that searched by the people,t its ssupuppoportrteded by
sc
scheheiti le ((20201111)) ththatatiif f pepeoople areccononcecernrneded or intereeststedediin a partiicular iissssueue, they
willbbee mom re likikelelyy to search for reresources,s, news, websites,s ddisiscussioonn boboards, and
other types of information relateed to that isssue. As interest goes up or goes down r
Figure 3
Graph of Google Trend for ASII stock ticker in Indonesia in the year 2012
Sources: www.google.ocm
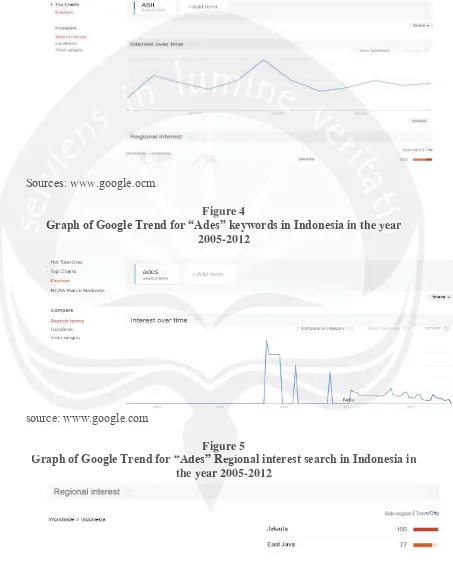
Figure 4
Graph of Google Trend for “Ades” keywords in Indonesia in the year 2005-2012
source: www.google.com
Figure 5
Graph of Google Trend for “Ades” Regional interest search in Indonesia in the year 2005-2012
Source: www.Google.com Soouru ces: wwwww.google.ocm
Figure 4
Grraaph of Google Trend for “Ades” keywords in Indonesia in the yyeaearr 2005-2012
source: www.google.com
Figuree 5
Figure 6
Graph of Google Trend for “Ades” Related searches terms in Indonesia in the year 2005-2012
Sources: www.google.com
2.1.7 Liquidity
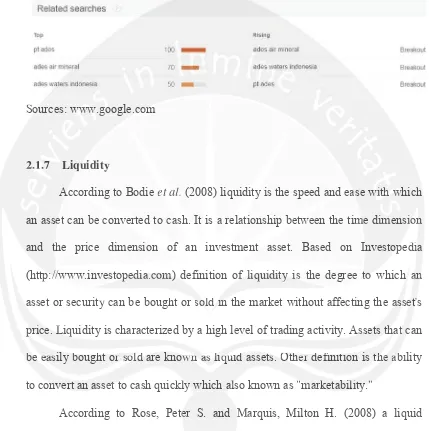
According to Bodie et al. (2008) liquidity is the speed and ease with which an asset can be converted to cash. It is a relationship between the time dimension and the price dimension of an investment asset. Based on Investopedia (http://www.investopedia.com) definition of liquidity is the degree to which an asset or security can be bought or sold in the market without affecting the asset's price. Liquidity is characterized by a high level of trading activity. Assets that can be easily bought or sold are known as liquid assets. Other definition is the ability to convert an asset to cash quickly which also known as "marketability."
According to Rose, Peter S. and Marquis, Milton H. (2008) a liquid financial asset is readily marketable, which is mean that the assets can be sold quickly. It is related to assets’ price and generally carries lower yields, stable price and reversibility. Liquidity can be measure by bid-ask spread, trading volume, frequency of trades, and average trade size. Liquid instrument will have higher in trading volume, trading frequency, and average daily trade size.
Soources: wwwwww.ggooogle.cocomm
2..1.1.77 Liququidity A
According to Bodie et al. (2008) liquidity is the speed and easase wiwithth wwhichh
an asseet can be converted to cash. It is a relationship between the timme dimensiionon
and tthe price dimension of an investment asset. Based on Innvestooppedia
(http::////www w.investopopedediaia.comcom)) definition of f liliququididitityy isi the degree toto which aann
asset or security can be bought or ssolold d inin the market without affecting the asasseset''s
pr
prici e.e LLiqquidity is characterized by a high level of trading activity. Assssetets ththatat ccan
be
beeeasa ily bboughtht or r sosoldld are knownwnaass liliququidid assets.OOththere ddefifiniitiion is ttheheaabbility
to connvevert an asassesett to cash quickly ywhich alalso known as "mmararkek tabilityty." "
According to Rose, Peteer S. and MaM rquis, Milton H. (2008) a liquid
financial asset is readily marketaable, whicch is mean that the assets can be sold
quickly. It is related to assets’ priceaand ggenerally carries lower yields, stable price
Wyss, Rico von (2004) also explain that liquidity measures are separated into one-dimensional (only one variable in one measure) and multi-dimensional ones (different variables in one measure). The one-dimensional liquidity measure is separated into four groups such as: size of the firm, the volume traded, the time between subsequent trades or the spread.
According to Tripathy, naliniprava (2011) trading volume tends to be higher when stock prices are increasing; its changes reflect the available set of relevant information perceived by the market. This research found significant contemporaneous relationship between return volatility and trading volume that indicate the information may flow simultaneously rather than sequentially into the market. The study also found that trading volume is associated with an increase in return volatility and this relationship is asymmetrical. The study revealed that shocks in stock returns impact trading volume in the expected direction over a short horizon. According to Pathirawasam, C. (2011). Higher volume in the market leads to a shorter time needed for trading a predefined amount of shares. So when trading volume is high this is a sign of high liquidity.
2.1.8 Return and Risk
According to McMillan et al. (2011) return is defined as the reward for undertaking the investment, it is the motivating forces in the investment process. There are two components of return which are; yield that is the income component of a security’s return and second is capital gain (loss) which is the
change in price on a security over some period of time.
ones (different variables in oonene measure).TThehe oone-dimensional liquidity measure
is separated into fourur groups such as: size of the firm, tthehe volume traded, the time
between subsbsequent trades or thehessprpreae d.d.
A
According too TTrirpap thy, naliniprava ((2020111)) trtrada ing volume ttends to be
hiiggher whehenn ststocock priciceses are increasing; its changgeses reflectct tthehe availabblele set of
relevaantnt iinfnformamation perceived by the market. This reseaarcr h fof unund d sisignifficicant
coontnemporaaneous relationship between return volatility and tradidng vvololumu e thhata
in
indidiccatetthe information may flow simultaneously rather than sequenntialllly y inintoto the
markett. The study also found that trading volume is associated with ann increase inin
return volatility and this relationship is asymmetrical. The study reevealed d thaat
shocksks in stock retuurnrnss imimpapactct trading volumumee inin tthehe expected direectctioion overer aa
short horizon. According to Pathhirirawawasasam, C. (2011). Higher volume iin n ththe
ma
markrketetleads to a shorter time needed for trading a predefined amoununtt ofof sshaharres.
So
Sowwhen tradiding voolulumeme iis highhtthihis s isisaassigignn of highh liliququididiity.
2.1.8 Return and Risk
According to McMillan eet al. (20111) return is defined as the reward for
undertaking the investment, it is thhee moottivating forces in the investment process.
According to Drake, Pamela Peterson and Fabozzi, frank J. (2009) risk is derived from Italian verb riscare which means “to dare”. Investors “dare to” get profits by taking advantage of opportunistic side of risk. According to Damodaran, Aswath (2012) risk in finance is defined in term of actual return on an investment around an expected return, even when those returns represent positive outcomes. According to McMillan et al. (2011) there are some sources of risk, such as:
a) Interest Rate Risk: changes in the level of interest rate that resulting on the variability in security’s return.
b) Market Risk: fluctuations in the overall market that makes variability in return.
c) Inflation Risk: the chance that purchasing power of invested money will decline.
d) Business Risk: the risk of doing business in a particular industry or environment
e) Financial Risk: it is associated with the use of debt financing. The variability in the return getting larger if the proportion of asset financed by debt is larger.
f) Liquidity Risk: this risk higher when the investment can’t be sought or sold quickly.
g) Currency Risk: this risk face by all investors who invest internationally related with the uncertainty of return after convert the foreign gains to the own currency.
profits by taking advantagagee of opportuuniniststic side of risk. According to
Damodaran, Aswatthh ((2012) risk in finance is definedd iinn term of actual return on
an investmenent around an expeectteded retetururn,n, eevev n when thosee returns represent
positiveve outcomes. AAccccoro didng to McMillan et al.l (2(201011)1) there are somme sources of
risksk, such aas:s
a) InInterest Rate Risk: changes in the levell oof ini tetererestst rate that
resulting on the variability in security’s return.
b) Market Risk: fluctuations in the overall markeet t thhatat mmakes
variability in return.
c) Inflation Risk: the chance that purchasing power of invevestedd
moneeyy wiwillllddececlilne.
d) Business Risk: the rrisisk k ofof doing business in a particular induduststrry
or environment
)
e) FiFinaancnciaiall RRisk: ititiis s asassosociciatated withd h ththe e ususe offddebt financb nciningg. The
va
variriability in the rreturn gegetting larger if f ththe e prp opporortitioon of asset
financed by debtis larger.
f) Liquidity Risk: ththis risk hhigher when the investment can’t be
sought or sold quickklyl .
h) Country Risk: it political referred as political risk, this risk related with economy stability.
According to Jones, Charles P. (2009), Fabozi, Frank J. and Drake, Pamela Peterson (2009) and McMillan et al. (2011) define that there are two risks that must be consider when investor deal with investment. The first is systematic risk, risk that cannot be diversified no matter the investor does or it called nondiversifiable risk, such as interest rate, inflation, economic cycles, political uncertainty, and natural disaster. Second is unsystematic risk, which is risk that can be eliminated by diversification or it called diversifiable risk.
Risk can be measure using variance and standard deviation. Variance is absolute measure of dispersion. Standard deviation is a measure of the dispersion in outcomes around the expected value.
2.1.9 Relation between Investors’attention with Liquidity
Da et al. (2009) discovered that Google search volume is closely related to the trading by individual investors. It shows the intense effect on the trading behaviors of investors. According to Tripathy, Naliniprava (2011) trading volume and its changes described the available set of relevant information perceived by the market. This research concludes that trading volume is related with the stock return volatility. High trading volume is related with high stock return volatility. It is also define that news which received by the investors is give effect on the stock return volatility. Good news increasing the stock return volatility leads to increase trading volume. According to Chae (2002) investor attention can be seen from the According to Jones, ChChararlles P. (200909)),FFabozi, Frank J. and Drake, Pamela
Peterson (2009) anndd MMcMillan et al. (2011) define thhatat there are two risks that
must be consnsiider when investorr deae l l wiwiththiinvn esestment. The firstst iis systematic risk,
risk thahat cannot bbe e ddivev rsified no matter ththee ininvvestor does oro it called
noonndiversiififiabablee risk, ssucuchh as interest rate, inflatioion,n, econonomimic c cycles, pop litical
uncertrtaiaintnty,y andd natural disaster. Second is unsystematic ririsks , whwhicich h isis risk k that
caan n beb elimiminated by diversification or it called diversifiable risk.
Ri
Risksk cann be measure using variance and standard deviation. Variannce isis aabsbsoloute
measurre of dispersion. Standard deviation is a measure of the ddispersion iinn
outcommes around the expected value.
2.1.9 Relation between Investors’s’atttetention with Liquidity
Da et al. (2009) discovered that Google search volume is closeselyly relelatateded to
th
the e trt ading bby indindivivididuauall investstorors.s. It It shshoows thhe inintetensn e effffect on thhe e trraading
behaviviorors of invnvesesttors. According gto Tripaaththy, Nalinipravaa((202011))trtradadining volume
and its changes described the avvailable set of relevant information perceived by
the market. This research concluddes that trrading volume is related with the stock
return volatility. High trading volumme is rrelated with high stock return volatility. It
stock price that influenced the information that flow in the market. Information itself can decrease the asymmetric information and make the stock more liquid. Here, there is positive relation between investor attention and liquidity.
2.1.10 Relation between Investors’attention with Return and Risk
According to Ross et al. (2009) define that individual expects a stock to earn over next period is called expected return. According to Fama and French (1992) variables that can explain the average return is size and book to market equity and it is also the proxy of common risk factors in return. Investors want to invest in investment is to get higher return and a low standard deviation (risk). Ross et al. (2009) explain that return on any stock consists of two parts such as normal or expected return and the uncertain or risky return on the stock. Normal return or expected return can be predict by investors depend on the information that have by investors and bear on the stock. Uncertain or risky return on the stock is part that comes from information that will reveal within the month. Ashraf, M.A and Joarder, H.R (2009) stated on their research that informed investors could be more advantageous than uninformed investors in averting risk. Risk is related with uncertainty, according to Andre, Daniel and Hasler, Michael (2013) when investor pay attention to news the uncertainty will decrease and the estimated growth rate is increasing and vice versa.
In portfolio theory we learn about high risk high return, some investors willing to invest their funds in high risk investment because they expected the high return from that investment. There is positive relation between risk and Here, there is positive relationnbbetween invest stotor rattention and liquidity.
2.1.10 Relaatition between Invesstot rrs’’atttetentntioi nnwith Return annddRisk A
According too RRoso s s et al. (2009) define thathat inindidvidual expecctst a stock to
eaarrn over nenextxt pperiod isis called expected return. AAccccordingg too FaFama andd French
(1992)2) vvarariiableses that can explain the average return is sizeze andd bbooook k tot mararket
eqquiuity and iit is also the proxy of common risk factors in return. InI veststorors swanttto
in
invevest inn investment is to get higher return and a low standard deevivattioion n (r(risk).
Ross eet al. (2009) explain that return on any stock consists of two pparts such asas
normaal or expected return and the uncertain or risky return on the stoock. NoNormaal
returnrn oor expected retetururnn cacann beb predict by y ininveveststororss ded pep nd on thee ininformattioionn
th
t at have by investors and bear on tthehe sstotock. Uncertain or risky return on thesstotockck
is
is pparartt that comes from information that will reveal within the momontnthh. AAshshrraf,
M.
M.AA andd JJoarder,d , H.H.R R (2(2009)) sstatatetedd onon tthheir resseaearcrch h thhatt iinformed f d ininvevestors
could d bebe more adadvantageous thann uninformrmed investors iinn avavertingng rrisisk. Risk is
related with uncertainty, accordinng to Andree, Daniel and Hasler, Michael (2013)
when investor pay attention too news thhe uncertainty will decrease and the
estimated growth rate is increasing aand vivice versa.
return. Stocks that high demand and supply will tend to be more fluctuate and indicate that many investors interested on that stock. The fluctuation of stock price is describing the information that flow in the market. So there is a positive relation between information that investors have with the return and risk of investment.
2.1.11 Indonesia Stock Exchange
Indonesia capital stock market was started in the year 1912 in Batavia (nowadays known as Jakarta) during the Dutch colonial era. It known as Batavia Stock exchange or Jakarta Stock exchange (JSC) and it was use for the Dutch interest. It was re-active by the President Suharto on the August 10, 1997 and supervised under the Bapepam as the capital Market supervisory Agency. On the July 16, 1989 Surabaya stock exchange was established and then merges with Jakarta Stock exchange in the year 2007. The name changed becomes Indonesia Stock Market (IDX). There are two equity trading systems, first is Jakarta Automated Trading System (JATS). Jats first launch in the year 1995 and renew on March 2, 2009. It uses to handle all financial products such as stocks, bonds, and derivatives. Second are Order-Driven Market and Open-Auction System. This system is based on an order-driven market system where only limit orders with day or session order duration are accepted. People who can trade in the exchange are the Only IDX Members who are already registered as the Members of the Indonesian Clearing and Guarantee Corporation (KPEI).
price is describing the informmatatioion that flow w inin the market. So there is a positive
relation between infnformation that investors have witith h the return and risk of
investment.
2..11.11 Indodonenesisiaa Stocckk EExchange In
Indodonesisiaa capital stock market was started in the yeyear 1919122 inin Battava ia
(nnowow dadays kknown as Jakarta) during the Dutch colonial era. It knknown n asas Bataviia
St
Stocock exxchange or Jakarta Stock exchange (JSC) and it was use fof r ththee DuD tch h
interestt. It was re-active by the President Suharto on the August 100, 1997 aandnd
supervvised under the Bapepam as the capital Market supervisory Agenncy. OOnn thee
July 116,6 1989 Surababayaya sstotockck exchange waass esestatablblisisheh d and then mmeerges wiwthth
Jakarta Stock exchange in the yearr 220007.7 The name changed becomes Indoonenesisia
St
Stoco kk MaM rket (IDX). There are two equity trading systems, firrstst iis JaJakakarta
Au
Autotomatedd TTradiding g SySyststem (JAATSTS).). JaJatsts ffirirst launcchh inin tthhe year 191995 aandndrrenew
on MMararchch 2, , 20200909. It uses to hanndlde all fiinnancial productsts ssucuch as sstotockcks, bonds,
and derivatives. Second are Ordeer-Driven MMarket and Open-Auction System. This
system is based on an order-drivven markeett system where only limit orders with
day or session order duration are acccec ptteed. People who can trade in the exchange
Figure 7
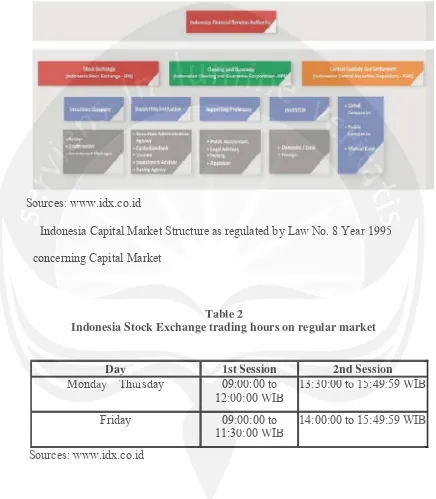
Indonesia Capital Market Structure
Sources: www.idx.co.id
Indonesia Capital Market Structure as regulated by Law No. 8 Year 1995 concerning Capital Market
Table 2
Indonesia Stock Exchange trading hours on regular market
Day 1st Session 2nd Session
Monday –Thursday 09:00:00 to 12:00:00 WIB
13:30:00 to 15:49:59 WIB
Friday 09:00:00 to
11:30:00 WIB
14:00:00 to 15:49:59 WIB
Sources: www.idx.co.id So
Soururces:: www.idx.co.id
Indoonesia Capital Market Structure as regulated by Law No. 8 Yearr 1995
conccerning Capital Market
Ta Tablbe 2
Indonesia Stock Exchange ttrading hours on regular market
Da
Dayy 1s1sttSSession 22ndd Sesssioionn Mo
Mondndayay –ThThuursday 09:0000:00 to 12:0:00:00 WIB
133:3:30:0:0000ttoo 1515:4:49:9:59 WIB
Friday 09::00:00 to
11:300:00 WIB
14:00:00 to 15:49:59 WIB
Pre-opening schedule
Time Agenda
08:45:00 - 08:55:00 WIB The Exchange Members input the buying and selling orders.
08:55:01 - 08:59:59 WIB JATS processes the pre-opening price forming and allocates every done transaction. Sources: www.idx.co.id
Pre closing and post trading session
Session Time Agenda
Pre-Closing 15:50:00 - 16:00:00 WIB
The Exchange Members input the buying and selling orders without the bid-ask information displayed.
16:00:01 - 16:04:59 WIB
JATS processes the pre-closing price forming and allocates every
done transaction. Post-Trading 16:05:00 - 16:15:00 JATS processes the allocates
transaction with closing price. Sources: www.idx.co.id
2.1.12 India Stock Exchange
National Stock Exchange of India (NSE) was promoted by leading Financial Institutions at the behest of the Government of India and was incorporated in November 1992 as a tax-paying company and recognized as a stock exchange on April 1993. The National Stock Exchange (NSE) operates a nation-wide, electronic market, offering trading in Capital Market, Derivatives Market and Currency Derivatives segments including equities, equities based derivatives, Currency futures and options, equity based ETFs, Gold ETF and 08:45:00 - 08:55:00 WIBB The Exchchanangeg Members input the buying and
se
selling orders.
08:55:01 - 0808:5:59:59 WIB JATS processes the pree--opo ening price forming and allolocates every doonen transaction.
Sources: wwww.idx.ccoo.idid
Pre clclosing anndd pop st tradinggssesessisionon
Se
Sessssioion Time Agenndada
P
Pree-Clososiing 15:50:00 - 16:00:00 WIB
The ExchangeMMembeberssiinpn ut theh buying and sellingg ordderersswithouutt the bid-ask informatation didispsplalayed.
16:00:01 -16:04:59 WIB
JATS processes the ppre-cllosing g price forming and alloocac tes eveery y
done transactioon.
Po
Post-Trading 1616:0:05:5:0000 - 16:15:00 JATSJATSpprocesses theeaallllocatess tr
tranansasactctioionn wiwth closing pricece.
So
S urces: www.idx.co.id
2.
2.1.1 1212 India Stocock k ExExchhanangege Na
Natitiononal Stock Exchange l e of Indndia (NSE) was promomotetedd by leading
Financial Institutions at the bbehest of tthe Government of India and was
incorporated in November 1992 as a taxx-paying company and recognized as a
Retail Government Securities. Today NSE network stretches to more than 1,500 locations in the country and supports more than 2, 30,000 terminals.
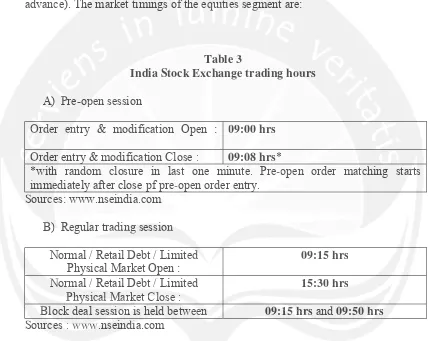
Trading on the equities segment takes place on all days of the week (except Saturdays and Sundays and holidays declared by the Exchange in advance). The market timings of the equities segment are:
Table 3
India Stock Exchange trading hours A) Pre-open session
Order entry & modification Open : 09:00 hrs Order entry & modification Close : 09:08 hrs*
*with random closure in last one minute. Pre-open order matching starts immediately after close pf pre-open order entry.
Sources: www.nseindia.com B) Regular trading session
Normal / Retail Debt / Limited Physical Market Open :
09:15 hrs Normal / Retail Debt / Limited
Physical Market Close :
15:30 hrs
Block deal session is held between 09:15 hrsand 09:50 hrs Sources : www.nseindia.com
C) The Closing Session is held between 15.40 hrs and 16.00 hrs
2.2 Previous Research
According to Barber and Odean (2008) attention is a scare resource. First, select the option to consider then decide which option to choose is the process in making decision. This research was test that individual investors are often ignored Trading on the equittieiess segment tatakekess place on all days of the week
(except Saturdays aand Sundays and holidays declaarered by the Exchange in
advance). Thehe market timings ofof theh eeququititieies s seegmgment are:
Table 3
India Stock Exchange trading houours
A)
A) PrPre-opopen session
Or
Ordeder enentry & modification Open : 09:00hrs O
Order entry & modification Close : 09:08 hrs*
*with h random closure in last one minute. Pre-open order mattching starartss immeediately after close pf pre-open order entry.
So
S urcees: www.nseindia.com
B)
B) Regular traddiningg sessioionn
Normal / Retail Debt / Limitedd Physical Market Open :
09:15 hrs No
Normrmal / Retail Debt / Limited Ph
PhysysicicalalMMararkekett ClClosose e ::
15:30 hrs Bl
Block deal sessisionon iis held betweweenen 09:1:155 hrhrsand 09:50 hrhrss Sooururceess ::wwwww.w.nnseindndiia.com
C) The Closing Session is heleld betweenn 15.40 hrs and 16.00 hrs
2.2 Previous Research
investors’ attention. There are two kinds of investors which are informed investor that observed the same signal weather want to buy or sell and uninformed investor that make a random purchase or random sales. This research was used indirect proxies to measure the investors’ attention such as : news, unusual trading volume, and extreme returns. The researcher also stated that trading volume is greater when news about a firm a reach investors and the important news often result in significant positive or negative returns. Barber and Odean (2008) explain that investors are overconfident about the quality of their information that makes them trade too much. Information is needed to do investment but we have to make sure that we use the appropriate information. Such investors’ trades sub optimally because they may overvalue the importance of events that catch their attention. This research was concluding that when alternatives are many and search cost high, attention may affect choice decision that preferences.
According to Da et al. (2009) extreme returns, trading volume, news and headline, and advertising expense are indirect proxies for investor attention but return can be driven by factors unrelated to investor attention and news doesn’t guarantee unless investor actually read it. This research proposes a direct measure of investor attention using search frequency or search volume index (SVI) in Google. The reason is because internet users commonly uses search engine to collect information and Google continues to become the favorite of the search engine. Da et al (2009) discovered that Google search volume is closely related to the trading by individual investors. It shows the intense effect on the trading behaviors of investors. Search volume index is able to capture public attention that make a random purchassee oor random saaleles.s This research was used indirect
proxies to measurree the investors’ attention such as :: news, unusual trading
volume, and d extreme returns. TThee rreseseaearcrcheh r alaso stated thatt ttrading volume is
greater r when news ababouout a firm a reach investot rsrs aandnd the importantnt news often
reessult in siigngnifificcaant posisititive or negative returns. Baarbrbere andd OOdedeanan (2008)) explain
that iinvnvesestotors arere overconfident about the quality of their ininfof rmattioion n ththat mt maka es
thhememttrade ttoo much. Information is needed to do investment but twew hhavave e to makke
su
surere that t we use the appropriate information. Such investors’ trades sub opoptitimam lly
becausse they may overvalue the importance of events that catch theeir attentionon.
This rresearch was concluding that when alternatives are many and search h cosst
highh, atattention may yafaffefectct chchoioicec decision thatatpprerefefererencnces.
According to Da et al. (200099)) exexttreme returns, trading volume, newwss anandd
he
headadlilinene,, and advertising expense are indirect proxies for investor atattetentntioion n bbut
re
retuturnr can bbe ddriivenen byby ffactors uunrnrelelatateded tto investstoror aattttentition and newd ws s dodoesn’t
guaranantetee unleessssiinnvestor actuallyy read it. TThis research prropoposo es a didirerect measure
of investor attention using searrch frequenncy or search volume index (SVI) in
Google. The reason is because ini ternet uusers commonly uses search engine to
collect information and Google conontinuues to become the favorite of the search
that is not capture by news; it is capturing the demand for attention or active attention on a real time basis. Investors can be search information in Google using company ticker or company name. This research examines weekly SVI of Russell 3000 individual stocks from January 2004 to June 2008 for individual investors. In this research, individual investors are more active to search information when they tend to buy stock because they have to choose from so many alternatives and it will push up stock price temporarily.
Bank, M., & Peter, George. (2011) conducted a research about investor attention that using Google search volume as the direct proxy and study the implication for trading activity, liquidity, and returns of German stocks. This research found that search volume is a powerful measure for investor attention especially uninformed investor. The higher the search volume will increase the trading activity, improve liquidity stock and high future return in short run. This research using company name that took from Thomson reuter data streams as the keyword search to get data of Google search volume index.
Usman, B. (2012) conducted a research about the Investor attention using Google search traffic and its influence on return, liquidity, and volatility of stock return for manufacturing firm in Indonesia. This research concludes that Google search volume reduces the asymmetry information between informed and uninformed investors. High search of information help investors make decision that impact on liquidity improvement, and the increasing liquidity affect the volatility returns.
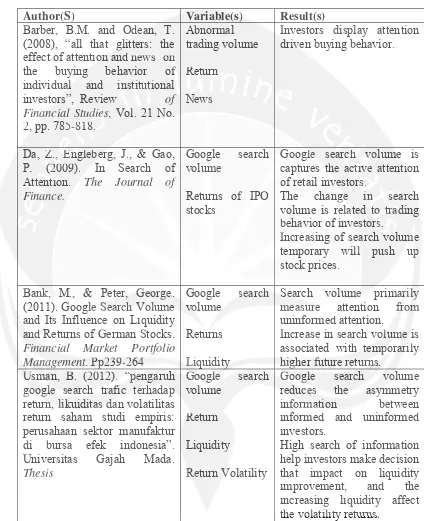
Below is the summary of previous research:
using company ticker or compmpaany name. ThThisis research examines weekly SVI of
Russell 3000 indivvididual stocks from January 2004 to JuJ ne 2008 for individual
investors. IInn this research, iinndivivididuaual l ininveestsors are more active to search
informmaation when thehey y tetennd to buy stock becaussee ththeyey have to choooso e from so
ma
many alterrnanatitivevess and ititwwiill push up stock price tempmporarily.y
Ba
Bankn , M.M., & Peter, George. (2011) conducted a reeses archh aaboboutut inveestor
atttetenttiion thhat using Google search volume as the direct proxxy y annd d ststudy thhe
im
implplicattiion for trading activity, liquidity, and returns of Germann stoockcks.s. This
researcch found that search volume is a powerful measure for investstor attentiionon
especiially uninformed investor. The higher the search volume will iincreasese thehe
traddiningg activity, imprprovovee liliququididity stock and hihighgh ffututurure e return in shorortt run. TThihiss
re
r search using company name that ttoook k ffrom Thomson reuter data streams aass ththe
ke
keywyworord search to get data of Google search volume index.
Us
U man, BB. (2(201012)2) conductcteded aarreseseaearch abbououtt ththe e IInvestor attent ntitiononuusing
Googglele search trtrafaffific and its influluence on rreturn, liquidity,y aandn volatatililitity of stock
return for manufacturing firm inn Indonesia.. This research concludes that Google
search volume reduces the assymy metry information between informed and
uninformed investors. High search h of innformation help investors make decision
Table 4
Summary of previous research
Author(S) Variable(s) Result(s)
Barber, B.M. and Odean, T. (2008), “all that glitters: the effect of attention and news on the buying behavior of individual and institutional investors”, Review of Financial Studies, Vol. 21 No. 2, pp. 785-818.
Abnormal trading volume Return
News
Investors display attention driven buying behavior.
Da, Z., Engleberg, J., & Gao, P. (2009). In Search of Attention. The Journal of Finance.
Google search volume
Returns of IPO stocks
Google search volume is captures the active attention of retail investors.
The change in search volume is related to trading behavior of investors.
Increasing of search volume temporary will push up stock prices.
Bank, M., & Peter, George. (2011). Google Search Volume and Its Influence on Liquidity and Returns of German Stocks. Financial Market Portfolio