1
ANALYSIS OF LIQUIDITY FACTORS THAT INFLUENCE EXCESS STOCK RETURN WITH RELATIVE MEASURE OF LIQUIDITY INCLUDED; WITHIN COMPANIES ALWAYS LISTED IN LQ45
2002-2012
Name : S. Richard Kamie
Supervisor : J. Sukmawati Sukamulja Study Program : International Management
Faculty : Economy
University : Atma Jaya Yogyakarta, Jalan Babarsari 43-44, Yogyakarta
Abstract
This study used the sample of companies always listed in the Indonesian stock index LQ45 period of 2002-2012. The purpose of this study is to reexamine the relationships of size, book value of equity to the market value of equity (BM), turnover, price, and relative measure of liquidity with excess stock return (RML). The data was secondary in nature. With Excess stock return as the dependent variable while size, BM, turnover, price, and RML as independent variable. The result of this study shows that size gives impact to excess stock return. BM, turnover, price, and RML has no effect on excess stock returns. Size, BM, turnover, price, and RML explained the excess stock return changes by 14, 4%. With size, BM, and turnover have positive effect on excess return. While price, and RML negative effect of excess return.
Keywords: LQ45, Liquidity factors, Excess stock return
A. Introduction
1. Study Background
2 2. Problem Formulation
There are many factors that will decide whether you will win big or lose big in trading stocks such as: economic condition whether its domestic or international, exchange rate, current trend in society, some even say human psychology. But liquidity was seldom to be considered part of it. In result, the aim is to achieve a better understanding of liquidity risk and its method of measurement because undoubtedly liquidity risk plays a part in investment decision.
3. Research Objective
The objective of this research is to help us examine and to analyze the variables of the stock market gathered from their historical data with its relationship to liquidity, its comparative form or relative measure of liquidity, and the level of the excess stock return.
B. Theoritical Background and Hypothesis
Amihud and Mendelson (2000) argue that a company can raise its stock price by enhancing the liquidity of its stock. The greater the stock’s liquidity, the lower the expected return that the investor will require which in turn will lower corporate cost of capital and a higher valuation for any given cash flows that the company generates. In addition to the argument about the stock’s co-movement with liquidity, Kalok (2008) found that regardless of theilliquidity measures theyuse, an increase instock price synchronic, results in a decline inthese illiquidity measures.Furthermore, the effect on liquidity is not confined to co-movementwith the market.
After controlling for the market returns, the industry co-movement also hassignificant effects on liquidity.Their results alsoshow that the relationship prove true not only for index stocks, but also for nonindexstocks. That the twoeffects might be indeed related, as the increase of R-square is related to the rise in liquidity forthose stocks added to the S&P 500 index. Lastly, theyalsoshow that the lower bid-ask spread of exchange traded funds is due to their relatively large stock price synchronicity. The evidence suggests thatthe degree of return co-movement has a significant impact on market liquidity.
It is a widely known fact that there is a negative relationship between stock return and its level of liquidity (Amihud & Mendelson, 1986; Fiori, 2000). This fact suggest that stocks that are less traded gives higher return to investors.
H0: The relationship between the level of relative measure ofliquidity and excess stock returns isnegative.
3
premium, since stocks that are less liquid or illiquid might be riskier than its counterpart since investor cannot quickly adjust their portfolio when the time comes.
With that reason, the investors should require a premium for bearing liquidity risk that cannot be diversified and if RML captures a significant part of the liquidity risk then the hypothesis will be accepted. Besides from illiquidity of stocks, the fluctuation of liquidity also can be considered as risky to the investors (as more it fluctuates, the higher the uncertainty) which, of course, worry them. This happens because they think that their analysis of the case of market goes against their way becomes less reliable. Therefore, investors seek higher return from trading in a market with more volatility in its behavior, and the hypothesis will be rejected.
C. Research Methodology
The following variables will be listed and calculated for every stocks included in the sample set:
1. SIZE 2. BM 3. TURN 4. STDTURN 5. CVTURN 6. PRICE
7. EXCESS STOCK RETURN
The RML measure is calculated for each stock as(Hamid, 2009: 28):
The next steps will be the classical assumption tests which will be comprised as:
1. Descriptive Statistics 2. Normality Test 3. Multicollinearity Test 4. Heteroscedasticity Test 5. Autocorrelation Test
4 D. Data Analysis and Discussion
1. Descriptive Statistics
Table 4.1
Descriptive Statistics Result
N Minimum Maximum Mean Std.
Deviation Excess Stock Returns 77 -1.00 -0.05 -0.0953 0.10812
SIZE 77 27.19 35.61 30.8259 1.36778
BM 77 0.03 1.00 0.5306 0.26914
TURN 77 0.00 0.07 0.0052 0.00883
STDTURN 77 0.00 0.07 0.0045 0.00873
CVTURN 77 0.00 1.99 0.8553 0.30029
PRICE 77 -0.85 1.60 0.2885 0.42379
RML 77 0.03 12.48 1.6423 2.67646
STDRML 77 0.03 11.02 1.4210 2.25847
CVRML 77 0.55 6.90 0.9820 0.72919
Source: Appendix 2
2. Normality Test
Table 4.2
Normality Test Result 1
Unstandardized Residual
N 77
Normal Parameters Mean 0.0000000
Std. Deviation 0.10468867 Most Extreme
Differences
Absolute 0.316
Positive 0.285
Negative -0.316
Kolmogorov 2.773
Asymp. Sig. (2-tailed) 0.000
Source: Appendix 3
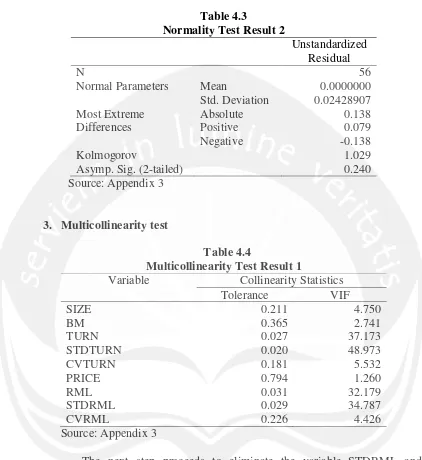
5 Table 4.3
Normality Test Result 2
Unstandardized Residual
N 56
Normal Parameters Mean 0.0000000
Std. Deviation 0.02428907 Most Extreme
Differences
Absolute 0.138
Positive 0.079
Negative -0.138
Kolmogorov 1.029
Asymp. Sig. (2-tailed) 0.240
Source: Appendix 3
3. Multicollinearity test
Table 4.4
Multicollinearity Test Result 1
Variable Collinearity Statistics
Tolerance VIF
SIZE 0.211 4.750
BM 0.365 2.741
TURN 0.027 37.173
STDTURN 0.020 48.973
CVTURN 0.181 5.532
PRICE 0.794 1.260
RML 0.031 32.179
STDRML 0.029 34.787
CVRML 0.226 4.426
Source: Appendix 3
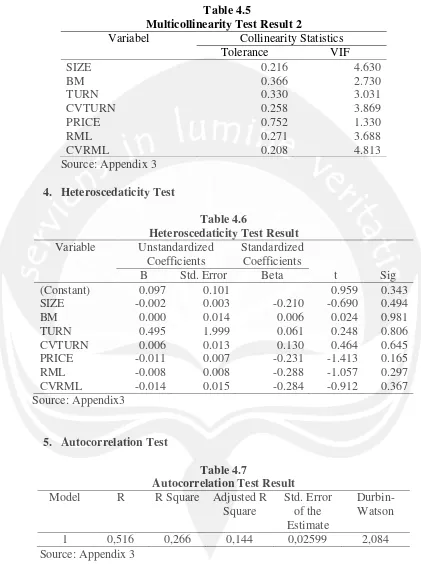
6 Table 4.5
Multicollinearity Test Result 2
Variabel Collinearity Statistics
Tolerance VIF
SIZE 0.216 4.630
BM 0.366 2.730
TURN 0.330 3.031
CVTURN 0.258 3.869
PRICE 0.752 1.330
RML 0.271 3.688
CVRML 0.208 4.813
Source: Appendix 3
4. Heteroscedaticity Test
Table 4.6
Heteroscedaticity Test Result Variable Unstandardized
Coefficients
Standardized Coefficients
t Sig
B Std. Error Beta
(Constant) 0.097 0.101 0.959 0.343
SIZE -0.002 0.003 -0.210 -0.690 0.494
BM 0.000 0.014 0.006 0.024 0.981
TURN 0.495 1.999 0.061 0.248 0.806
CVTURN 0.006 0.013 0.130 0.464 0.645
PRICE -0.011 0.007 -0.231 -1.413 0.165
RML -0.008 0.008 -0.288 -1.057 0.297
CVRML -0.014 0.015 -0.284 -0.912 0.367
Source: Appendix3
5. Autocorrelation Test
Table 4.7
Autocorrelation Test Result Model R R Square Adjusted R
Square
Std. Error of the Estimate
Durbin-Watson
1 0,516 0,266 0,144 0,02599 2,084
Source: Appendix 3
7 6. Multiple Regression Analysis
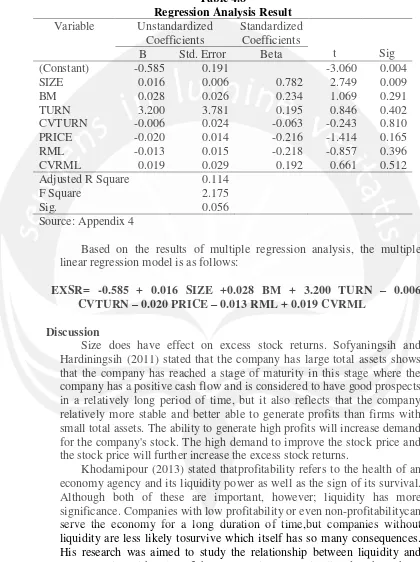
Table 4.8
Regression Analysis Result Variable Unstandardized
Coefficients
Standardized Coefficients
t Sig
B Std. Error Beta
(Constant) -0.585 0.191 -3.060 0.004
SIZE 0.016 0.006 0.782 2.749 0.009
BM 0.028 0.026 0.234 1.069 0.291
TURN 3.200 3.781 0.195 0.846 0.402
CVTURN -0.006 0.024 -0.063 -0.243 0.810
PRICE -0.020 0.014 -0.216 -1.414 0.165
RML -0.013 0.015 -0.218 -0.857 0.396
CVRML 0.019 0.029 0.192 0.661 0.512
Adjusted R Square 0.114
F Square 2.175
Sig. 0.056
Source: Appendix 4
Based on the results of multiple regression analysis, the multiple linear regression model is as follows:
EXSR= -0.585 + 0.016 SIZE +0.028 BM + 3.200 TURN – 0.006 CVTURN – 0.020 PRICE – 0.013 RML + 0.019 CVRML
Discussion
Size does have effect on excess stock returns. Sofyaningsih and Hardiningsih (2011) stated that the company has large total assets shows that the company has reached a stage of maturity in this stage where the company has a positive cash flow and is considered to have good prospects in a relatively long period of time, but it also reflects that the company relatively more stable and better able to generate profits than firms with small total assets. The ability to generate high profits will increase demand for the company's stock. The high demand to improve the stock price and the stock price will further increase the excess stock returns.
8
between company size and company value, respectively. Also the results obtained indicate that there is a significant and direct relationship between company size with book value to market value ratio and liquidity volume.
E. Conclusion and Future Research Advice 1. Conclusion
The result of data analysis that has been done shows that: a. SIZE does affect excess stock returns.
b. Book value of equity to the market value of equity has no effect on excess stock returns.
c. Stock turnover rate has no effect on excess stock returns.
d. Coefficient of variation of turnover has no effect on excess stock returns.
e. Price has no effect on the variable of excess stock returns.
f. Relative measure of liquidity (RML) has no effect on excess stock returns.
g. Variation of the relative measure of liquidity does not have any effect on excess stock returns.
2. Research Limitation
This study has a couple of limitations items, namely:
a. This study has limitations those variables that affect excess stock returns only size. Future studies may add other variables that affect the stock excess returns.
b. This research was conducted only at the companies always listed in LQ 45 years from 2002 to 2012.
3. Future Research Advice
This research is far from perfect, so if anyone wants to this or similar type of research, there are some things that they need to take heed, they are:
a. Use other types of index, IHSG for example. And try not to put the category of “Always in index A” for different results. By taking another sample hopefully it will yield more accurate, better results and give contribution to this area of study.
9
REFERENCE
Akbas, Ferhat.Armstrong, W.J. Petkova, Ralitsa. 2011. Idiosyncratic Volatility of Liquidity andExpected Stock Returns.
Amihud, Yakov. Mendelson, Haim. 2000. The Liquidity Route to a Lower Cost of Capital. Journal of Applied Corporate Finance.Vol 12.4.8-25.
Amihud, Yakov. Mendelson, Haim. 2005. Liquidity and Asset Prices. Foundations and Trends in Finance.vol.1, no. 4, pp. 269-364.
Benic, Vladimir.Franic, Ivna. 2008. StockMarketLiquidity: ComparativeAnalysisofCroatianandRegionalMarkets. Financial Theory and Practice 32, 477-498.
Bickenbach, Frank. Bode, Eckhardt. Krieger-Boden, Christiane. 2010. Closing the Gap between Absolute and Relative Measures of Localization, Concentration or Specialization. Kiel Institute for the World Economy. Germany.
Chan, Kalok. Hameed, Allaudeen. Kang, Wenjin. 2008. Stock Price Synchronicity and Liquidity.
Chen, Langnan. Li, Steven. Wang, Jinan. 2010. Liquidity, Skewness and Stock Returns: Evidencefrom Chinese Stock Market.
Elleuch, Jaouida. Trabelsi, Lotfi. 2009. Fundamental Analysis Strategy and thePrediction ofStock Returns. International Research Journal of Finance and Economics.
F.S, Mirfeys.Zamanian, Gholamreza.Kahreh, Z.S. Kahreh, M.S. 2011.The Relationship between Liquidity Risk and Stock Price:An Empirical Investigation of the Tehran Stock Exchange. European Journal of Economics, Finance and Administrative Sciences.
10
Ghozali, Imam. 2006. AplikasiAnalisis Multivariate DenganSPSS.UniversitasDiponegoro, Semarang.
Imbs, Jeans. Mejean, Isabelle. 2010. Trade Elasticities.
Khodamipour, Ahmad. Gholestani, Shahram. Khorram, Majied. 2013. The relationship between liquidity and the company size withcompany value in companies listed on the Tehran Stock Exchange. European Online Journal of Natural and Social Sciences; vol.2, No. 3(s), pp. 1210-1217.
Kubota, Keiichi. Takehara, Hitoshi. 2009. Expected Return, Liquidity Risk,andContrarianStrategy: Evidencefrom the Tokyo Stock Exchange. 655-679.
Muranaga, Jun. 1999. Dynamics of market liquidity of Japanese stocks:An analysis of tick-by-tick data of the Tokyo Stock Exchange.
Murhadi, R.Werner. 2009. PengaruhIdiosyncraticRiskdan Likuiditas Saham
TerhadapReturnSaham. Faculty of Business& Economics, University of
Surabaya.
Oliveira, Blandina. Fortunato, Adelino. 2006. Firm Growth and Liquidity Constraints: A Dynamic Analysis. P.139-156.
Salehi, Mahdi. Talebnia, Ghodratallah. Ghorbani, Behzad. 2011. A Study of the Relationship Between Liquidity and Stock Returnsof Companies Listed in Tehran Stock Exchange. World Appl. Sci. J., 12 (9): 1403-1408.
Simlai, Pradosh. 2009. Stock Returns, Size, and Book to Market Equity. Journal of Economy and Finance. Vol. 26, No. 3 pp. 198-212.
11 http://www.answers.com/topic/glejser-test#page2
http://www.entrepreneur.com/article/187606)
http://en.wikipedia.org/wiki/Jakarta_Stock_Exchange
http://en.wikipedia.org/wiki/Liquidity
http://en.wikipedia.org/wiki/Liquidity_crisis_of_September_2008
http://en.wikipedia.org/wiki/Liquidity_premium
http://en.wikipedia.org/wiki/Liquidity_risk
http://www.business.qld.gov.au/business/starting/supplier-stock-management/stock-control-basics/calculating-stock-turnover
http://www.investopedia.com/terms/l/liquidity.asp#axzz29dj8aLG6
http://www.investopedia.com/terms/b/bvps.asp#axzz29dj8aLG6
http://www.investopedia.com/terms/m/market-value-of-equity.asp#axzz29dj8aLG6
http://www.investopedia.com/terms/t/turnoverratio.asp#axzz29dj8aLG6
http://www.publishyourarticles.net/knowledge-hub/statistics/absolute-and-relative-measures-of-dispersion.html