DOI: 10.12928/TELKOMNIKA.v13i1.960 21
Unbalanced Active Distribution Analysis with
Renewable Distributed Energy Resources
Syafii1*, K.M. Nor2 1
Electrical Engineering Department, Andalas University, Padang, Indonesia 2Electrical Engineering Faculty, Universiti Teknologi Malaysia, Johor Baharu, Malaysia
*Corresponding author, e-mail: [email protected]
Abstract
This paper presents unbalanced active distribution system analysis with renewable distributed Energy Resources (DER). The renewable DER models have been considered are photovoltaic (PV) and Wind Turbine generation (WTG). The three-phase distribution load flow on the basis of the symmetrical components has been used in the analysis. The unbalanced active distribution system has been analized using IEEE 13 node feeder and IEEE 8500 node feeder with renewable DER units. The center-tapped (CT) transformer load model has been included in program. The variation of wind speed (m/s) for WTG, solar radiation (W/m²) and temperature (°C) for PV have been simulated. The simulation results show that the proposed DER model can be used to analysis renewable DER impacts in unbalanced distribution system. The integration of renewable DER units into an existing distribution network can improve the voltage profile and reduce total system losses. The simulation results show that DERs size and location are important factors to improve voltage profile and line loss reduction.
Keywords: distributed energy resources, photovoltaic, wind turbine, active distribution system and unbalanced load flow
1. Introduction
Rising public awareness for environmental protection, increasing fuel price and energy consumption, have created interest in green (renewable) power generation systems [1]. The development of renewable-energy resources has become increasingly attractive and competitive and economically feasible. These facts have led towards the increase penetration of distributed energy resources (DER) using renewable-energy sources into the electrical grid. Distributed energy resources (DER), including distributed generation (DG) and distributed storage (DS), are sources of energy located in the distribution networks that can provide a variety of benefits, including improved reliability and reduce transmission and distribution losses [2].
Distributed generation using renewable-energy sources, such as wind, solar photovoltaic and hydro power has received considerable attention in recent years. Distributed storage is an integral part of a hybrid renewable-energy power generation system [3]. Different renewable-energy power generation technologies use different energy storage schemes, which may be used in hybrid systems. Renewable-energy technologies and its energy storage can be used battery for solar PV and biomass, flywheel for mini and micro hydro, superconducting magnetic energy storage (SMES) for wind turbine and supercapacitor for fuel cell. Simulations show that the proposed energy storage system can meet the real-time power demand and save money [4].
2. Unbalanced Active Distribution Analysis
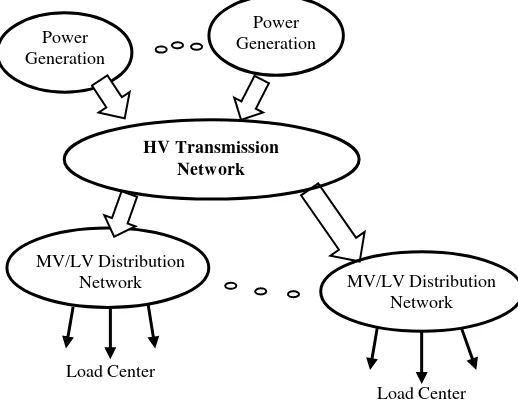
system operation is often called a ‘vertically-operated power system’ [6] illustrated in Figure 1 (a).
The future power system grid will have been increasing implementation of distributed energy resources. The DER are mainly connected to the distribution grid. The integration of distributed generators in power systems may cause a transition from the current ‘vertically-operated power system’, which is supported mainly by several large centralized synchronous generators, into a future ‘horizontally-operated power system’, with large number distributed energy resources.
(a) Power flow without DER Integration
(b) Power Flow with DER integration
Figure 1. Impact of DER Integration in power system grid Power
Generation
HV Transmission Network
Power Generation
MV/LV Distribution
Network MV/LV Distribution
Network
Load Center
Load Center
MV/LV Distribution Network
DER Units
DER Units Power
Generation
HV Transmission Network
Power Generation
MV/LV Distribution Network
Load Center
The implementation of DER in the distribution grid closer to the load which will affect the local power flow [7]. The increasing penetration level of DER is expected and the total amount of generated electric power can exceed the total connected load. As a consequence the distribution grid can start exporting electric power to neighbouring distribution grids what converts the power system into a horizontally operated power system. This is shown in Figure 1 (b).
2.1. Renewable DER Model
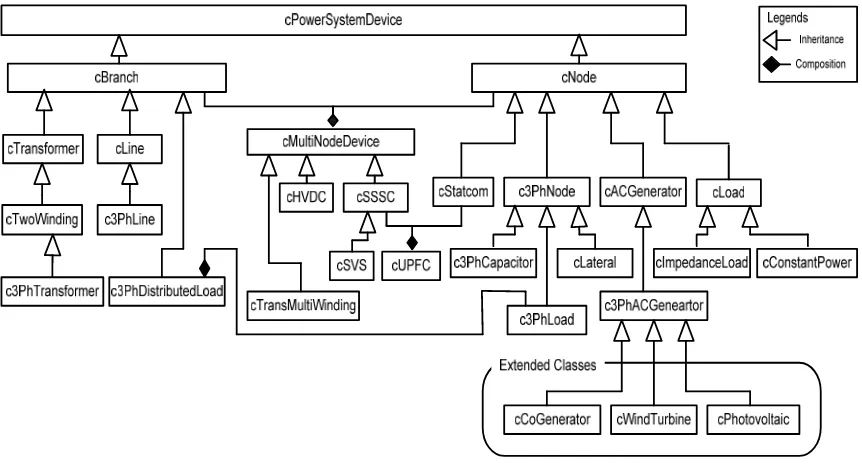
Figure 2 Object-Oriented Power System Model Including DER Model
The object oriented programming has been used in this research. By using object oriented programming, updating or adding new algorithm can be done to any specific object without affecting or escalating the modification to other object inside the software. The DER models have been developed using the state-of-the art of object component based approach, so the models can be integrated with existing object component software previously developed in [8].The new class library to model DER has been added in object oriented power system model [8] using visual C++ programming. The extended classes for DER model follow the model in [9] as shown in Figure 2. The DER are generally modelled as PV or PQ nodes in power flow studies for unbalanced active distribution system. However, the specified P,Q and V values depend on the type of DER.
2.2. Impact of RDER in power system operation
Large-scale integration of DG in distribution grids can have a significant impact on power system operation. Therefore, many research projects are defined and numerous studies on integration issues of DER are carried out. For instance, the effect of DG on voltage profile studied in [10]-[11], and system losses studied in [12]. In general, it is necessary to keep the voltage of a transmission or distribution grid within specified limits for all possible loading conditions and minimize system losses.
profile improvement for a simple case of distributed wind turbine generation. Simulation results clearly show that distributed generations can improve voltage profile at a load point. The distribution grid with cables, the X/R ratio is less than 1. This means that the resistance cannot be neglected anymore, and hence the voltage drop depends on active and reactive power [13]. Cables with a small conductor size have a X/R ratio between 0.25 and 0.5 and for these cables, the voltage drop dominantly depends on active power [13].
Installing DER units along power distribution feeders may effect on voltage stability due to excessive active and reactive power injection [10]. The voltage level in a distribution network must be kept within a certain range, as power system and customer equipment functions only properly if the voltage is maintained within this range. The voltage range for normal operation is defined within ±10% based on IEC 61000-2-2 standard for low voltage level [14].
The impact of DG on system losses strongly depends on the injected power and location of DG in the distribution network. Moreover, intermittent generation sources with a weak correlation with the load, such as wind turbines, can have a negative impact on system losses. Especially during the night-time there is low demand and in a high wind situation, the distribution grid can start to export power which increases the line losses. In this case, local storage systems can have a positive effect on the line losses because the storage system can locally balance the power flow and prevents the export of power. In [12] it is demonstrated that the grid losses increase for remotely connected wind turbines. It is also demonstrated that wind turbines connected sufficiently close to the load have a positive effect on grid losses.
3. Description of the Test System
The impact of RDER in unbalanced distribution system simulated and analyzed using standard IEEE data 13 node and 8500 node feeder.
3.1. IEEE data 13 node test feeder.
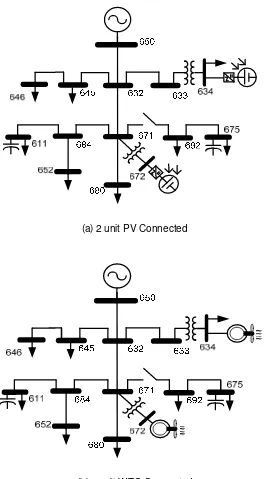
Radial distribution network IEEE 13 node test feeder used to simulate and analyze the impact of RDER in unbalanced distribution system. The IEEE 13 test feeder contains the most common features in a distribution network such as: single-phase, two-phase, and three-phase power system elements for lines and transformers and unbalanced load also present in this system. For unbalanced distribution system simulation and anylisis carry out two cases system.The first system is a modified IEEE 13 node feeder with two units of photovoltaic DG connected at node ID 634 and node ID 672 as shown in Figure 3a. The second system is a modified IEEE 13 node feeder with two units of WTG DG connected at node ID 634 and node ID 672 as shown in Figure 3b.
(a) 2 unit PV Connected
(b) 2 unit WTG Connected
Figure 3. IEEE 13 node test feeder
3.2. The IEEE 8500-Node Test Feeder
Figure. 4 IEEE 8500 node unbalance distribution feeder
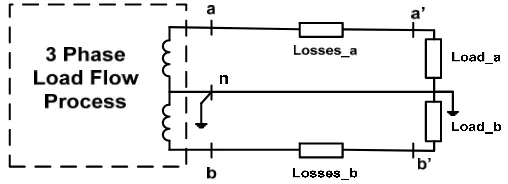
The large unbalanced load connected to the 120/240V center-tapped transformer via 50ft service lines solved using an iterative forward and backward sweep analysis method based on voltage drop analysis of Figure 5. The voltage drop analysis using Kirchhoff’s voltage and current laws are repeated until convergence is achieved. The method extended in the sequence component based methodes.
Figure. 5. Center tap transformer model
The secondary line losses calculated after Van and Vbn obtained for both CT transformer node and load node using:
Slosses_aa’ = Iaa’ Van+ (-Iaa’)Va’n (1)
Slosses_bb’= Ibb’ Vbn+ (-Ibb’)Vb’n (2)
Where: Slosses_aa’ is power losses along line a to a’, Slosses_bb’ is power losses along line a to a’ Therefore the total secondary line losses is:
Slosses = Slosses_aa’ + Slosses_bb’ (3)
4. Results and Analysis
4.1. Unbalanced distribution system IEEE 13 node
This section studies the system performance by connecting DER of cogeneration, PV, wind turbine, and hybrid generation units in the unbalanced distribution networks. The IEEE 13 node feeder and the large scala IEEE 8500 node are used for active distribution system analysis. The variation of wind speed (m/s) for WTG, solar radiation (W/m²) and temperature (°C) for PV are carried in the simulation.
Table 1. Maximum power output at various temperature
Value Temperature (C)
25 50 75
Vmav (Volt) 21.417 19 16.641 Imax (Ampere) 7.717 7.692 7.637
Pmax (Watt) 165.283 146.149 127.094
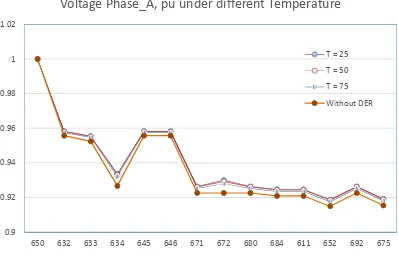
The PV module temperature is varied in unbalanced power flow simulation. The power flow results from this simulation are shown in Figure 6. The results show that, the voltage is increased by PV units installed in the network. However the voltages in phase A for all nodes of the network present a reduction in their amplitude because of the increase PV module temperatures. This is due to the increase of PV temperature decreased in maximum PV power generation as shown in Table 1.
Figure. 6 Voltage phase A results of PV model under different temperature
The power flows have been changed, when PV temperatures are changed. The power flow in some lines or transformers have been increased and others decreased by increased PV temperature. The direction and amount of power flow are depends on PV size and location.
The reactive power flow for line 671 to 680 equal to zero, because there is no load connected to this node. The lines which its phase connected to dummy node also have a zero power flow due to both end node voltage are the same. For example, the line from node ID 632 to node ID 645 is two-phase line without phase ‘a’, so the line flows in phase ‘a’ equal to zero. Actually, this line is dummy line does not exist in the real network.
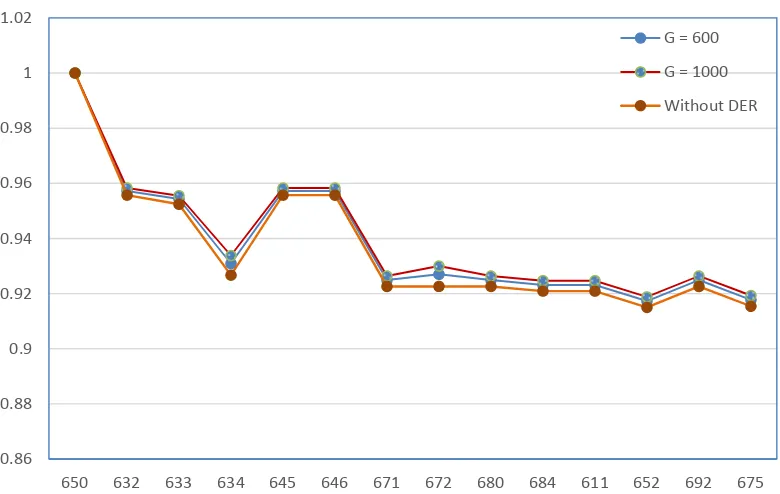
The results at various module irradiance levels are given in Table 2. The sun irradiance is varied in unbalanced power flow simulation. The power flow results from this simulation are shown in Figure 7. It can be observed that the voltages in phase A for all nodes of the network present are increased in their amplitude because of the increase irradiance level. This is due to the increase of PV irradiace made the increased of maximum PV power generation as shown in Table 2.
0.9 0.92 0.94 0.96 0.98 1 1.02
650 632 633 634 645 646 671 672 680 684 611 652 692 675
Voltage
Phase_A,
pu under
different
Temperature
T = 25
T = 50
T = 75
Table 2. Maximum power output at various irradiance level
Value Irradiance Level (W/m
2
)
600 800 1000 Vmax (Volt) 20.816 21.155 21.417
Imax (Ampere) 4.606 6.16 7.717
Pmax (Watt) 95.887 130.317 165.283
The active power flows have been changed, when irradiance level changed. The power flow in some lines or transformers have been increased and others decreased by increased PV irradiance level. The direction and amount of power flow are also depends on PV size and location.
Figure. 7 Power flow results of PV model under different irradiance
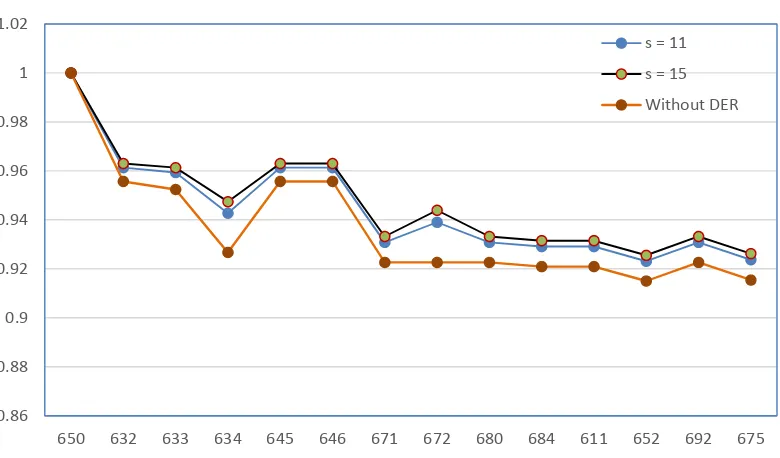
The second system is a modified IEEE 13 node feeder with two units of WTG DG connected at node ID 634 and node ID 672. The WTG unit considered here is a unit with 500kW output power rating. The wind speed input for power flow analysis is varied from 11 to 15 m /s. The power flow results are given in Figure 8 which shows the node voltage magnitude have been increased by an increase in wind speed. This is because the increase in wind speed made the increase in wind power generation as shown in Table 3. The Reactive power consumed by wind turbune varies for every test case, and its value also depends on node voltage at WTG connection, which varied during power flow iteration process.
Table 3. Maximum power output at various wind speed
Node Voltage Phase_A, pu
s = 11 s = 12 s = 13 s = 14 s = 15
P (kW) 381 440 478 494 499
0.86 0.88 0.9 0.92 0.94 0.96 0.98 1 1.02
650 632 633 634 645 646 671 672 680 684 611 652 692 675
Voltage
Phase_A,
pu under
different
Irradian
G = 600
G = 1000
The power flow results from this simulation are shown in Figure 8. The results show that, the voltage is increased by WTG units installed in the network. The voltages in phase A for all nodes are increased in their amplitude because of the wind speed increased. The active power flows also have been changed, when wind speed is changed. The direction and amount of power flow are also depends on WTG size and location
Figure. 8 Power flow results of WTG model under different wind speed
The variation of wind speed (m/s) for WTG, solar radiation (W/m²) and temperature (°C) for photovoltaic impacts have been simulated. The simulation results show that the proposed DG model can be used to analysis DG impacts in unbalanced distribution system.
4.2. Test on Large Scale Unbalanced Distribution System
The IEEE 8500-node test feeder is a latest data provided by IEEE PES distribution system analysis subcommittee used to test the algorithm for large system problem. The 8500-node test feeder is a radial distribution feeder contains 1177 CT distribution transformer connect to 1177 loads, one set of regulators at the substation and three sets of voltage regulators along the line and four capacitors.
The load flow analysis for the IEEE 8500 node was performed using per-unit values on a basis 100 KVA and solved this system in 9 iterations for 0.001 phase voltage mismatch. The different on voltage magnitudes result are 0.024 p.u and residue currents are 0.88 Ampere in average. The Table 4Table shows the selected comparison of sequence component method and forward/backward based OpenDSS program [17] for IEEE 8500-node test system. The result are almost same, the difference cause of center-tapped transformer modeling that exist in for IEEE 8500-node test system.
The effect of DERs penetration on voltage profile and system losses for system 8500-node is given in Table 5. The result shows that, the minimum magnitude voltage have increased by increase number and size of DER units installed in the network. The best result for voltage improvement and loss reduction for this system also for maximum DGs installed case 5. The variation of DERs location is as shown in case 3a, 3b, 4a and 4b of Table 4 gave impact in voltage profile improvement and network loss reduction.
0.86
650 632 633 634 645 646 671 672 680 684 611 652 692 675
Voltage
Phase_A,
pu under
different
wind
speed
s = 11
s = 15
Table 4 Results of IEEE 8500-node test case under 2.66 GHz PC Cases OpenDSS Program Sequence component Program
Min p.u Voltage 0.911 0.909
Max p.u Voltage 1.050 1.050
Total Power Generation (MW) 12.045 12.026
Total Reactive Power (MVar) 1.445 1.320
Losses (MW) 1.273 1.251
Mismatch (p.u voltage) 0.001 0.001
Table 5. Result of 8500 Bus ADS test case
Cases DERs Locations Min |V| p.u DER Supply Losses
5 2623(C), 2937(PV) 3571(WTG) 0.9296 144.03 107.55 1167.48
The variation DG location is studied in this simulation for cases 3a, 3b, 4a and 4b. In the case 3b which PV generation unit connected to bus ID 2937 have a better result compared to case 3a in which a PV generation unit is connected to bus ID 3571. The minimum voltage have been increased from 0.9272 p.u for case 3a to 0.9282 for case 3b as well as losses decreased from 1292.97 kW for case 3a to 1244.78 kW for case 3b. However, for the case 4a and 4b the increased of minimum voltage did not make the losses decrease. The case 4b which WTG connected to bus ID 2937 have a better voltage profile but worse system losses compared to case 4a which WTG connected to bus ID 3571.
5. Conclusion
The paper has presented renewable distributed energy resourses analysis as three-phase resource in unbalanced distribution load flow computation. The renewable DER models that have been considered comprise of photovoltaic (PV) and wind turbine generation (WTG). The voltage-controlled node and complex power injection node are used in the models. The center-tapped (CT) transformer load model has been included in program. The variation of wind speed (m/s) for WTG, solar radiation (W/m²) and temperature (°C) for PV have been simulated. The simulation results show that the proposed methods can be used to analyse DER impacts in the unbalanced meshed and radial distribution system. The integration of renewable DER into an existing distribution network can improve the voltage profile, and reduce total system losses. The simulation results show that DERs size and location are important factors to improve voltage profile and line loss reduction.
Acknowledgment
The authors gratefully acknowledge the assistance rendered by the Faculty of Engineering, Andalas University for partially funding this research in DIPA FT Unand 2014 (Contract No. 015/PL/SPK/PNP/FT-Unand/2014).
References
[1] H Nehrir, Wang C, Shaw SR. Fuel cells: promising devices for distributed generation. IEEE Power and Energy Magazine. 2006; 4(1): 47-53.
[3] MH Nehrir, C Wang, K Strunz, H Aki, R Ramakumar, J Bing, Z Miao, Salameh Z. A Review of Hybrid Renewable/Alternative Energy Systems for Electric Power Generation: Configurations, Control and Applications. IEEE Transactions on Sustainable Energy. 2011; 2(3).
[4] Chiu WY, Sun H, Poor HV. Demand-side energy storage system management in smart grid, Smart Grid Communications (SmartGridComm). 2012 IEEE Third International Conference on Tainan, Taiwan. IEEE. 73-78.
[5] Meliopoulos APS, Kokkinides G, Huang R, Farantatos E, Choi S, Lee Y, Yu X. Smart grid technologies for autonomous operation and control. IEEE Transaction on Smart Grid. 2011; 2(1). [6] M Reza, D Sudarmadi, FA Viawan, Kling WL, Sluis LVD. Dynamic Stability of Power Systems with
Power Electronic Interfaced DG. Power Systems Conference and Exposition, 2006 PSCE '06. 2006: 1423 – 1428
[7] Ackermann T, Knyazkin V. Interaction between distributed generation and the distribution network: Operation aspects. IEEE Transmission and distribution conference and exibition, Asia Pacific, Yokohama, Japan. Oct 6-10. 2002.
[8] Abdel-Akher M, Nor KM, Abdul-Rashid AH. Improved three-phase power-flow methods using sequence components. IEEE Trans on power systems. 2005; 20(3): 1389-1397.
[9] Syafii, Nor KM. Renewable Distributed Generation Models in Three-Phase Load Flow Analysis for Smart Grid. TELKOMNIKA Telecommunication Computing Electronics and Control. 2013; 10(2): 229-234.
[10] Zhichun Y, Jian L, Kaipei L, Zilin W, Hanyang G. Analytical method of the impact of distributed generation on static voltage stability of distribution network and its development. TELKOMNIKA Indonesian Journal of Electrical Engineering. 2013; 11(9): 5018-5029.
[11] P Chiradeja, Ramakumar R. Voltage profile improvement with distributed wind turbine generation – a case study. PES General Meeting. 2003: 4.
[12] Zonneveld P, Papaefthymiou G, Coster EJ, Sluis LVD. Calculation of grid losses with the aid of stochastic modeling of wind turbines and loads. Proc of 16th Power System Computation Conference. 2008.
[13] Coster EJ. Distribution Grid Operation Including Distributed Generation. PhD Thesis Eindhoven. University of Technology. 2010.
[14] Standardization E. C. f. E. ENS0160 Voltage Characteristics of Electricity Supplied by Public Distribution System, English Version. November 1994, European Committeee for Electrcaechnical Standardization (CENELEC), Brussels.
[15] Villalva MG, Gazoli JR, Filho ER. Comprehensive Approach to Modeling and Simulation of Photovoltaic Arrays. IEEE Transaction on Power Electronic. 2009; 24(5).
[16] VESTAS V 39 Available from: http://www.windturbines.ca/vestas_v39_500.htm.
[17] Dugan RC. The Open Distribution System Simulator™ (OpenDSS). 2010. Available from: