UNIVERSITI TEKNIKAL MALAYSIA MELAKA
Gage Capability Study of Thin Film Coating
Roughness Measurement Method Using
Profilometer
Thesis submitted in accordance with the requirements of the
University Technical Malaysia Melaka for the
Bachelor of Manufacturing Engineering (Manufacturing Process)
By
Faizal Bin Zainol
Faculty of Manufacturing Engineering
GAGE CAPABILITY STUDY OF THIN FILM COATING
ROUGHNESS MEASUREMENT METHOD USING
PROFILOMETER
FAIZAL BIN ZAINOL
APPROVAL
This thesis submitted to the senate of UTeM and has been accepted as partial fulfillment of the requirements for the degree of Bachelor of Manufacturing Engineering (Manufacturing Process). The members of the supervisory committee are as follow:
………. Main Supervisor
DECLARATION
I hereby, declare this thesis entitled “Gage Capability Study of Thin Film Coating Roughness Measurement Method Using Profilometer” is the results of my own research
except as cited in the reference.
Signature : ………
Author’s Name : FAIZAL BIN ZAINOL
i
ABSTRACT
ii
DEDICATION
Specially dedicated to my beloved family especially my father (Zainol Bin Ismail) and
my mother (Faridah Binti Ahmad), my brother (Fairul Bin Zainol) and younger sister
iii
ACKNOWLEDGEMENTS
In the Name of Allah The Most Gracious, Most Merciful
First of all, thanks to Allah S.W.T to give me chance and strength to accomplish the research of my final year project.
I would like to wish thank you to Professor Dr. Mohd. Razali Bin Muhamad, Dean of Faculty of Manufacturing Engineering, University Technical Malaysia Melaka as my supervisor for my final year project 1 and 2 that had give support for me to undergo my final year project, Mr. Mohd Nizam Bin Abd Rahman, Lecturer of Faculty Manufacturing Engineering, University Technical Malaysia Melaka as my Co-supervisor that always guides, patient, support and information for me until I completely finished my project, Mr. Hassan Bin Attan, Laboratory Manager and Lecturer of Faculty Manufacturing Engineering, University Technical Malaysia Melaka and Mr. Jaafar Bin Lajis, Senior Technician in University Technical Malaysia Melaka.
iv
List of abbreviation, symbols, units, specialized nomenclature viii
vi
LIST OF TABLES
3.1 Major Specifications Of SJ-301 Including Measured Profiles, Parameter And Other
22
3.2 3.3
Surface Roughness Produced By Common Production Methods Range Calculation For Repeatability
24
Action taken to improve measurement system Data 1 for repeatability
Data 1 for reproducibility
Summary results for experiment 1 Data 2 for repeatability
Data 2 for reproducibility
Summary results for experiment 2 Data 3 for repeatability
Data 3 for reproducibility
Summary results for experiment 3
Summary results for 3 experiments The procedure during measurement
vii
LIST OF FIGURES
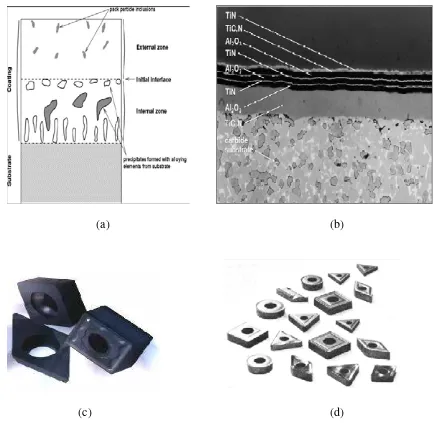
1.1 (a) Illustration of coating on substrate, (b) Multiphase coatings on a tungsten-carbide substrate and (c) (d) Various shape and types of coated cutting tools
2
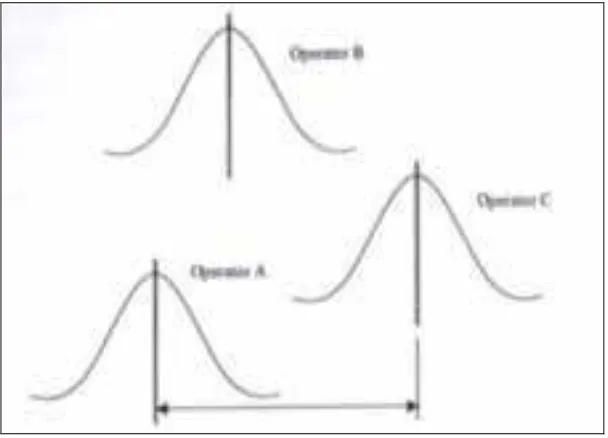
2.1 The Repeatability Of Gage A More Than Gage B 8
2.2 The Reproducibility 8
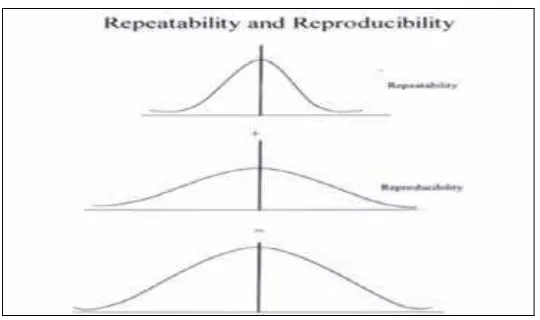
2.3 The Repeatability And Reproducibility 9
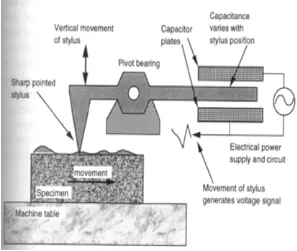
2.4 The Contact Method Of Surface Roughness Measurement 12 2.5 Measurement Of Surface Roughness By Laser Reflection 14
3.1 Proposed Research Flow/Methodology 16
3.2 Surface Roughness Tester 19
3.3 Surface Roughness Tester (Profilometer) 21
3.4 Calibration Process 25
3.5 Print Out Of The Surface Roughness Value 25
3.6 Flow Chart Of Sample Preparation Procedures 28
4.1
Graph of range value, Ra (μm) for experiment 1
Graph of range value, Ra (μm) for experiment 1 reproducibility Graph of range value, Ra (μm) for experiment 2
Graph of range value, Ra (μm) for experiment 2 reproducibility Graph of range value, Ra (μm) for experiment 3
Graph of range value, Ra (μm) for experiment 3 reproducibility
viii
LIST OF ABBREVIATIONS, SYMBOLS, UNITS,
SPECIALIZED NOMENCLATURE
ANOVA – Analysis Of Variance Method
mm – milimeter
nm – Nanometer
P/T – Precision to Tolerance
R&R – Repeatability and Reproducibilty Ra, Ry, Rz, Sm – Surface Roughness parameter
TiN – Titanium Nitride
μm – Micron meter
ºC – Degree of celcius
WC – Tungsten Carbide
1
CHAPTER 1
INTRODUCTION
1.1 Project Background
Coated tools widely used in today’s metal cutting industry, which bringing about significant improvements in tool performance and cutting economy through lower tool wear, reduced cutting forces, and better surface finish of the work piece, C. Wick (1986). The use of coated cutting tools to machine various materials represent state-of-the art machining technology, and today’s machining process are becoming increasingly demanding on cutting materials (Gearson, 1992).
Coated tool as know has high strength and toughness but are generally abrasive and chemically reactive with tool material. Because of their unique properties, such as lower friction and higher resistance to cracks and wear, coated tools can be used at high cutting speed, reducing both the time required for the machine operation and costs. Briefly, coated tools can have tool lives 10 times longer than those of uncoated tools. In this case, while TiN coatings made by physical vapor deposition are still common, advances are being made in the development and testing of new coating materials.
2
severe surface roughness can generate local electrochemical cell system on the surface once the coating is immersed in an electrolyte (A.W Batchelor, Loh Nee Nam, Margam Chandrasekaran, 2002).
(a) (b)
(c) (d)
Figure 1.1 (a) Illustration of coating on substrate, (b) Multiphase coatings on a tungsten-carbide substrate and (c) (d) Various shape and types of coated cutting tools(Serope
3
A typical roughness value for a range of coating tool is typically from 50 nm (very smooth surface) to 100μm (extremely rough surface). This small size is the reason why surface appear smooth and planar to the naked eye when in fact the real shape is composed of a semi infinite number of irregular form (A.W Batchelor, Loh Nee Nam, Margam Chandrasekaran, 2002).
Surface roughness is defined by an aggregate of surface irregularities with relatively small widths distinguished within the base length. Other than that, it is a surface geometric characteristic which affect the visual appearance, thermal conductivity, wearing out the process, coating composition fatigue and corrosion resistance of surfaces. From the meaning of surface roughness, it is important to measure because to help control the manufacture including the process and the machine tool and the other thing is to help optimize the function. In cases, controlling the manufacture may helps repeatability and hence quality of conformance. Beside that, functional optimization also helps the designers assist in the quality of design (David Whitehouse, 2002). At this stage, it’s not matter which parameter of the surface is being measured such Ra, Rq, Rz and entrance.
Basically, the profiling method is the current method that measuring profile of a surface. In cases, it show a two dimensional graph of the shape of the surface in the sectioning plane created by the profiling instrument. The stylus profilometer is the classical tool and the industrial standard for measuring surface profiles in the mechanical stylus. The stylus probe is passed across the surface and its movement as it follows the surface profile is measured. This is still the standard surface profiling technique and can offer high precision allowing the measurement of the surface roughness
4
5 1.2 Objective
a. To ascertain the suitability of profilometer as roughness measurement method for thin film coating and macro particle detection through gage capability study. b. To identify and minimize the variability of measuring tool.
1.3 Scope of Project
The scope of this gage capability study is limited to:
Equipment- Mitutoyo Surface Roughness Tester (SJ-301) Artifact- Cutting Tool (WC substrate with TiN Coating)
1.4 Importance study
a. Establish base line information of the equipment repeatability and reproducibility data as reference for future usage of the equipment.
b. Provide the variability data of the roughness measurement method using the equipment. This data can be used for sample size determination of future work. c. The same gage capability study methodology knowledge can be applied for any
6
CHAPTER 2
LITERATURE REVIEW
This literature review is to look at gage capability study methodology and the method to measure thin film coating roughness. Discussion of this two areas leads to the selection of gage capability methodology and thin film coating roughness measuring method.
2.1 Gage Capability Study
ISO 9000 series cover many techniques such as Bias, Linearity, Stability, Gage repeatability and reproducibility (short and long term), GRR ANOVA and Attribute gage repeatability and reproducibility. This ISO 9000 series is basically is a standardize which has been approved by over 100 countries. From the previous introduction, the gage capability is important study because it does can verify that gage specifications that can be taken. Ideally, gage capability studies are performed in a laboratory with as much random variation removed as possible.
2.1.1 Gage Repeatability And Reproducibility Method
7
when measuring the same part in several times(involved equipment) and reproducibility known as the difference in the average of the measurements made by different operators using the same gage when measuring the same part(operator to operator)(Hank Scutoski & Chander Sekar, Ph.D, Cerprobe Corporation).
2.1.2 Gage Repeatability And Reproducibility (Short Method)
Short method is a quick method where it can determine the acceptability of gage variations. It is usually conducted with two operators and five parts. The two operators measure each part once, randomly. When each part is only measured once, gage repeatability cannot be isolated from gage repeatability. The result of this study is a combination of both types of variation. In cases, this method does not include the effect of time in analysis (Jc Greenawalt, www.danahermotion.com).
2.1.3 Gage Repeatability And Reproducibility (Long Method)
8
Figure 2.1 The repeatability of gage A more than gage B
9
Figure 2.3 The repeatability and reproducibility
2.2 Calculation
From this case study, there are 3 basic method which usually used for determined gage R&R which range method, range and average method and Analysis of variance method (ANOVA). Commonly, the method that already used for calculating repeatability and reproducibility is the range and average method. The ANOVA also good and accurate method but the solution by mathematical involved the complex calculation so that we not chooses this method.
The repeatability and reproducibility using the range and average method must quantify such multiple part, appraiser and trial because this 3 thing will require when using this method. From the published that are refer (Engineered Software Inc 1999), there were recommended that this method is to use 10 parts, 2 operators and 2 trials. Below this show the example of calculation formula in repeatability system:
Repeatability = 5.15 R
10
Where R is the average of the ranges for all appraisers and parts.
d2 is found in Appendix A with Z = the number of part times the number of appraisers and W is found as the number of trials. For reproducibility:
(2)
Where Xrange is the average of the difference in the average measurement between the appraiser with the highest average measurement, and the appraiser with the lowest average measurement for all appraisers and parts.
d2 is found in Appendix A with Z = 1 and W is the number of appraiser
n is the number of part r is the number of trials
The measurement system repeatability and reproducibility can be calculated using this equation:
11
From this data, precision to tolerance ratio (P/T ratio) is to be calculated using this equation:
P/T= 6σ x R & R X 100% (4) (Tolerance)
Tolerance: Typical range of thin film coating roughness (50nm-100 μm)
The acceptance criteria for P/T ration are as follows:
a. Under 10% error - the measurement system is acceptable.
b. 10% - 30% error - may be acceptable based on importance of application, cost of gauge, cost to repair, etc.
c. Over 30% error - Measurement system must be improved. Follow the corrective action process to identify the root cause of the problem and have them corrected.
Source: Author: Jc Greenawalt www.danahermotion.com
2.3 Thin Film Coating Roughness Measurement Method
Referring to the book “Materials: Degradation and its Control by Surface Engineering”, A.W Batchelor wrote that there are two methods to measure roughness, contact method and non contact method.
12 2.3.1 Contact Method
As the previously, contact method is based on a stylus traversing the surface. In circumstance, a stylus will traverses over the sample of rough surface and any vertical movements of that stylus are recorded as a function of horizontal distance traversed. Here, the vertical direction can described as normal to the plane of the surface and horizontal as planar to the surface where the vast majority of measurements are performed with this configuration of the test specimen. The contact method of surface roughness measurement is shown schematically in figure 2.4.
Figure 2.4 The contact method of surface roughness measurement (A.W Batchelor, Loh Nee Nam, Margam Chandrasekaran, 2002).