Do Manufacturing Performance leads to Green Supply
Chain Practices?
Wan Hasrulnizzam Wan Mahmood
a, b aFaculty of Manufacturing Engineering, Universiti Teknikal Malaysia Melaka, Malaysia [email protected], [email protected]
Dr. Mohd Nizam Ab Rahman
bFaculty of Engineering & Built Environment, Universiti Kebangsaan Malaysia [email protected]
Dr. Baba Md Deros
Faculty of Engineering & Built Environment, Universiti Kebangsaan Malaysia [email protected]
ABSTRACT
The concepts pertaining to greening the operation or supply chain are usually understood by industry as screening suppliers for their environmental performance and then doing business with only those that meet the regulatory standards. The driving forces for implementing the green concept into the company operations are many and comprise a range of reactive regulatory reasons to proactive strategic and competitive advantages reasons. However, if green practices are to be adopted by organizations in Malaysia, a demonstrate link between such measures and improving manufacturing performance is necessary. This paper identifies potential linkages between manufacturing performances that lead to green practices amongst a sample of companies in Malaysia. For this purpose a conceptual model was developed from literature sources and data collected using a structured questionnaire mailed to a sample of MS ISO 14001 certified manufacturing companies in Malaysia followed by structural equation modeling. The analysis identified that manufacturing performance leads to green supply chain practices.
Keywords: Green supply chain practice, Manufacturing performance, MS ISO 14000
1.0
Introduction
Green supply chain (GSC) strategies refer to efforts to minimize the negative impact of firms and their supply chains on the natural environment. In the wake of concerns regarding climate change, pollution, and non-renewal resource constraints, organizations are heeding stakeholder demands regarding corporate citizenship behavior and performance (Sarkis, 2001). A green supply chain focus requires working with suppliers and customers, analysis of internal operations and processes, environmental considerations in the product development process, and extended stewardship across products’ life cycles (Corbett and Klassen, 2006). Besides, many researchers believe that the environmental sustainability and ecological performance of an organization may depend on these aspects, as demonstrated by the suppliers (Godfrey, 1998). Organizations in many industries have begun to realize that conflicts of interest among the various parties in a supply chain can engender operationally inefficient behavior. Moreover, many researchers have become interested in identifying and evaluating methods of coordinating supply chains in which multiple decision makers pursue individual agendas.
GSC is generally to be considered as the modern management model giving consideration of the environmental impact and resource efficiency in the whole supply chain. It involves suppliers, manufacturers, sales and users based on green manufacturing theory and supply chain management technology (Gao and Song, 2009). Its purpose is to enable products’ negative impact on the environment to the smallest, use efficient of resources to the maximum in the entire process, then achieve sustainable development of the enterprises and the supply chain.
technological innovations for environmentally beneficial outcomes throughout the industrial supply chain; and, last, the participation of a broader range of industrial actors for the environmental management of industrial production to strengthen the capacity-building on environmental governance (Berger et al., 2001). In addition, a review of the literature has shown that the existence of an important link between GSC and supply chain decisions is recognized (Sarkis, 2001; 2006).
There are some reasons for green. First, the limits of the natural world could constrain business operations, realign markets, and threaten the planet’s well-being. Second, companies face a growing spectrum of stakeholders who are concerned about the environment (Esty and Winston, 2009). Global warming, resource constraints, water scarcity, extinction of species, growing signs of toxic chemicals in humans and animals-these issues and many others increasingly affect how companies and society function. Those who best meet and find solutions to these challenges will lead the competitive pack. For some enterprises, a new green perspective will be transformative, leading to fresh thinking, new markets, profitability gains, and increased value. For others, the environmental lens may emerge more gradually and modestly, as another critical element of corporate strategy. With time, these companies may find long-term, sustained advantage, but not dramatic immediate gains, from being green. For the big, heavy industries, the gains are closer to being assured. But smaller and “cleaner” organizations will find surprising benefits as well.
The thought of GSC comes from the increasing pressure on the enterprises to protect the environment. With the development of researches on the product’s life cycle, it is gradually recognized that the actions of a single enterprise of the technologies for certain stage of a product’s life cycle cannot effectively reduce the environmental impacts during the entire product life cycle. The GSC integrates the supply chain management in order to reduce the environmental impacts during the entire product life cycle by the harmony and the common actions of the partners in a supply chain (Shuwang et al., 2005). The aims of GSC is to make the material flow value-added by harmonizing and controlling of the material flow, the capital flow, the information flow and the work flow of the GSC, and to provide high quality products and services to customers with fastest time-to-market, lowest cost and environmental impacts.
This paper is then to explore the manufacturing performance that lead to GSC practices in Malaysian certified MS ISO 14001 companies. The following sub-title will describe the research methodology, result, discussion, and conclusion which can be referred by other companies to define their green initiatives and other academician to explore what can be improved in green supply chain management and the sustainability.
2.0 Research methodology
This study focused on sampling the perceptions and experience of MS ISO 14000 certified companies in the Malaysia manufacturing industry. The questionnaire designed in this study mainly comprised three parts: company profile, GSC practices, GSC benefits and manufacturing system performance. The first part was designed to provide fundamental and background information, including industry type, employee (sizes) and EMS experience years; meanwhile, the next part focused on analysis of the GSC practices and current manufacturing system performances. Respondents were asked to rate each item under a four-point Likert-type scale (e.g. 1 = strongly disagree, 2 = disagree, 3 = agree, 4 = strongly agree), to indicate the extent to which each items was practiced in their respective organization.
Data collection covered distributing questionnaires to various manufacturing companies that certified MS ISO 14000 in Malaysia. All target respondents were selected from SIRIM QAS (a Malaysian certification body) database which have more than 2 years experience in implementing certified environmental management system (EMS). Only single plant is preferred if the certified companies have more than one plant. In other words, from a total of 522 certified companies only 241 companies are considered as the population. The questionnaire, comprising 29 items, was addressed to the managing director and environment management representative.
(2005) produced significant finding of green supply chain with a sample only 52 firms. Simpson et al (2007) used a sample of 55 firms to explore green supply chain practices in Australian automotive industry. More recently, Holt and Ghobadian (2009) used a sample of 60 usable surveys without specific population to perform an empirical study of green supply chain practices amongst UK manufacturers.
This implies that the sample proportion of response rate of this study is acceptable, and it reflects the virtue of novel issue of green supply chain practice in Malaysia manufacturing MS ISO 14000 certified companies.
3.0
Result & Discussion
3.1 Demography of Respondents
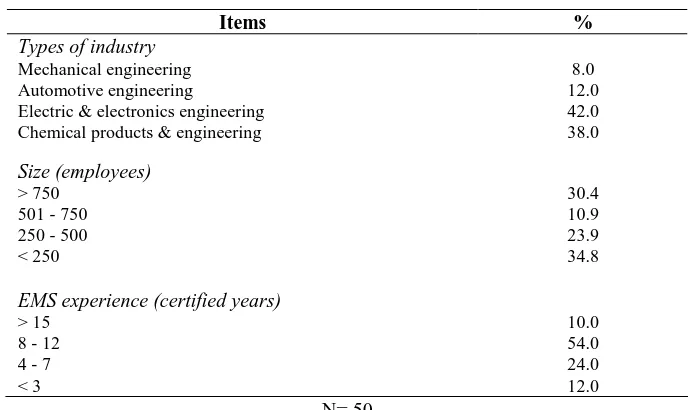
Table 1 lists the distribution of respondents in terms of their manufacturing sectors, ownership, company size and EMS experience years. The highest percentage of respondents is from electric and electronic industries (42.0 percent), followed by chemical products and engineering (38.0 percent), automotive industry (12.0 percent), and mechanical engineering (8.0 percent). Regarding the size of respondents ranged from under 250 to over 750 employees which found that respondent’s companies are mainly from less than 250 to more than 750 as shown in Table. I. Meanwhile, 64.0 percent of respondents have more than 8 years EMS experience.
Table 1: Demography of Respondents
Items %
Types of industry
Mechanical engineering 8.0
Automotive engineering 12.0
Electric & electronics engineering 42.0 Chemical products & engineering 38.0
Size (employees)
> 750 30.4
501 - 750 10.9
250 - 500 23.9
< 250 34.8
EMS experience (certified years)
> 15 10.0
8 - 12 54.0
4 - 7 24.0
< 3 12.0
N= 50
3.2 GSC Practice
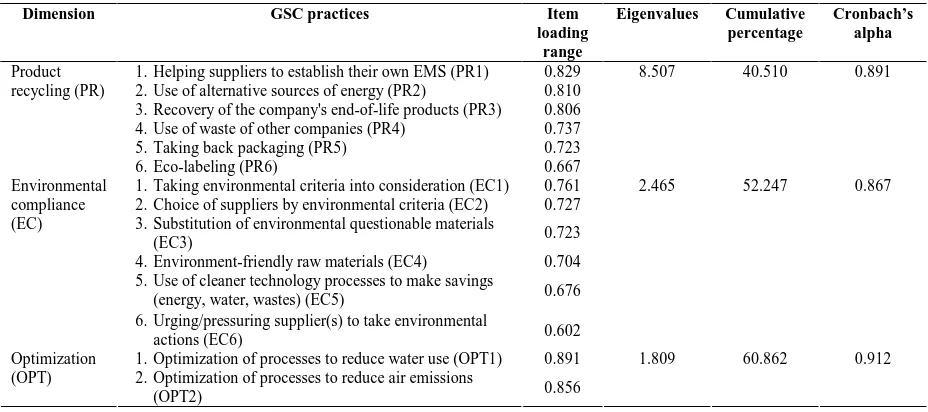
GSC practices are determined by factor analysis. Table 2 show the factor analysis result. Factor analysis has performed to extract factors based upon the principal components analysis with varimax rotation. Besides, Barlett’s test of sphericity and the Kaiser-Meyer-Olkin (KMO) measure of sampling adequacy were employed to test appropriateness of the data for factor analysis (Bagozzi & Yi 1988). The results of KMO show that the compared value is 0.627, significantly exceeding the suggested minimum standard of 0.5 required for conducting factor analysis (Lattin et al 2003).
Reliability concerns the extent to which an experience, test or any measuring procedure yields the same results on repeated trials. The reliability of the factors needs to be determined to support any measures of validity that may be employed. Both reliability tests and item analysis were recalculated without those seven items. Table. II lists the new Cronbach’s alpha values, ranging 0.867 to 0.912, after the seven items were dropped. Generally, Cronbach’s alpha values in this study are greater than 0.6, revealing the high internal consistency.
Table 2: Factor Analysis Result: Green Practices
Dimension GSC practices Item
loading
1.Helping suppliers to establish their own EMS (PR1) 0.829 2.Use of alternative sources of energy (PR2) 0.810 3.Recovery of the company's end-of-life products (PR3) 0.806 4.Use of waste of other companies (PR4) 0.737 5.Taking back packaging (PR5) 0.723 Product
recycling (PR)
6.Eco-labeling (PR6) 0.667
8.507 40.510 0.891
1.Taking environmental criteria into consideration (EC1) 0.761 2.Choice of suppliers by environmental criteria (EC2) 0.727 3.Substitution of environmental questionable materials
(EC3) 0.723
4.Environment-friendly raw materials (EC4) 0.704 5.Use of cleaner technology processes to make savings
(energy, water, wastes) (EC5) 0.676 Environmental
compliance (EC)
6.Urging/pressuring supplier(s) to take environmental
actions (EC6) 0.602
2.465 52.247 0.867
1.Optimization of processes to reduce water use (OPT1) 0.891 Optimization
(OPT) 2.Optimization of processes to reduce air emissions
(OPT2) 0.856
1.809 60.862 0.912
3.3 Performance of the Manufacturing System (MP)
A measure of success in implementing any manufacturing systems or supply chain management can be defined along a few performance parameters. The companies were requested to indicate the performance of their manufacturing system. The measures used were: 1= very poor, and 4 = very good. The results are summarized in Table 3. It can be deduced from the table that, in general, the respondents were satisfied with the achievement of most of the objectives of the manufacturing systems implementation. On average above half of the respondents considered the performance of their systems to be good or very good. Product quality improvement is the performance measures that were considered to be most satisfactory, whereas flexibility improvement was considered poor. Cronbach’s alpha values (0.843) of the manufacturing performances are greater than 0.7, revealing the high internal consistency.
Table 3: Performance of manufacturing system
Relative Performance (%)
N= 50, Cronbach’s Alpha = 0.843
the two groups is considered strong relationship and the 4 items were just extracted into one factor. With the new Cronbach’s alpha values (0.747), it was revealing the high internal consistency.
Table 4: Factor Analysis result: Manufacturing Performance
Dimension GSC practices
1.Work-in-progress reduction (MP1) 0.883 2.Throughput time reduction (MP2) 0.789 3.Product quality improvement (MP3) 0.754
3.676 52.518 Manufacturing
Performance (MP)
4.Flexibility improvement (MP4) 0.910 1.009 66.935
0.747
4.0
Structural Equation Modeling (SEM)
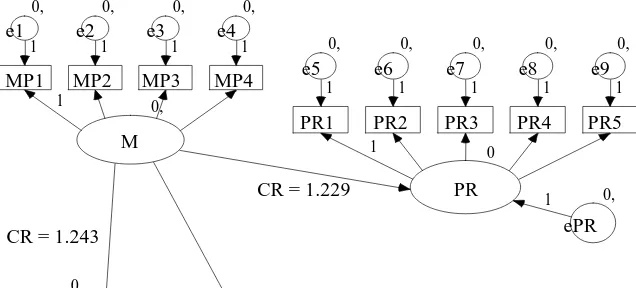
The model was run using AMOS graphics for Windows Version 5.0, estimating the regression weight of each link and the associated significance. Figure 1 shows the regression weights between the latent constructs. As indicated by the statistics detailed in Table 5, the overall convergence of the SEM model was significant after the some items were dropped such as PR6, EC5, and EC6 which factor loadings were less than 0.7. The convergence of the model was given by the Chi square value, the degrees of freedom and the associated probability level, the p-value. The model was considered acceptable at 5 percent level of significance if the p-value > 0.05. The Chi square values and associated p-value are highly acceptable indicating a good fit for the model. However, the covariance between latent constructs in GSC practices was not significant, hence the model supported that there was a significant link between manufacturing performance and GSC practices. This was expected due to excellent result in manufacturing performance was to encourage the GSC practices.
Table 5: Regression weights
Regression weights Estimate Critical ratio
The maximum likelihood estimates
MP - PR 0.202 1.229
MP - EC 0.414 3.409
MP - OPT 0.221 1.243
Notes: Chi-square =117.059; Degrees of freedom = 87; Probability level =0.17; NFI = 0.743; RFI = 0.645; IFI = 0.918; TLI = 0.876; CFI = 0.910; RMSEA = 0.084
On the other hands, baseline comparisons such as NFI, RFI, IFI, TLI and CFI, ranging 0.645 to 0.918 represent overall degree of fit (squared residuals from prediction compared to the actual data) are on the moderate side. In general, models with overall fit indices of less than 0.9 can usually be improved substantially. These indices, and the general hierarchical comparisons described previously, are best understood by examples (Bentler & Bonett, 1980). The typical range for TLI and CFI lies between zero and one, but it is not limited to that range. TLI and CFI values close to 1 indicate a very good fit. Similar to this condition, the RMSEA value of about 0.05 or less would indicate a close fit of the model in relation to the degrees of freedom. This figure is based on subjective judgment. It cannot be regarded as infallible or correct, but it is more reasonable than the requirement of exact fit with the RMSEA = 0.0. Browne and Cudeck (1993) suggested that a value of about 0.08 or less for the RMSEA would indicate a reasonable error of approximation and would not want to employ a model with a RMSEA greater than 0.1.
Figure 1: The Structural equation modeling of the relationship between manufacturing and GSC Practices
5.0
Conclusion
In the nutshell, the authors concludes that manufacturing performances such as work-in-progress reduction, throughput time reduction, product quality improvement and flexibility improvement, in general have potential to lead to greening the supply chain management. Some items that were considered in the factor analysis were dropped in SEM model due to significance level. In other words, the factors loading above than 0.7 are able to enhance the relationship or link in the developed model. The authors believe that the research results may prove useful in helping manufacturing firms to identify an effective approach towards the successful of green supply chain practices.
Acknowledgement
This research was co-funded by the Ministry of Higher Education Malaysia (MOHE) with partially Universiti Teknikal Malaysia Melaka (UTeM) and Universiti Kebangsaan Malaysia (UKM) under the program “Skim Latihan Akademik IPTA (SLAI)”.
Reference
Bagozzi, R.P. & Yi, Y. “On the evaluation of structure equation models”, Academy of Marketing Science, Vol. 16 No. 1, pp. 76-94, 1998.
Bentler, P.M. & Bonett, D.G. (1980). Significance tests and goodness of fit in the analysis of covariance structures. Psychological Bulletin, 88, 588–606.
Berger, G., Flynn. A., Hines, F. & Johns, R., (2001), “Ecological modernisation as a basis for environmental policy: current environmental discourse and policy and implications on environmental supply chain management”, Innovation, 14.1: pp. 55-72.
Bowen, F.E. Cousine, P.D. Lamming, R.C. & Faruk, A.C. “The role of supply management capabilities in green supply”, Production and Operations Management, Vol. 10 No. 2, pp. 174 – 189, 2001.
Corbett & Klassen. (2006). Extending the horizons: Environmental excellence as key to improving operations. Manufacturing and Service Operations Management,8(1), 5–22.
Esty, D. C. & Winston, A. S., (2009), Green to gold: how smart companies use environmental strategy to
innovate, create value, and build competitive advantage, John Wiley & Son, Inc, USA.
Gao, Y., Li, J. & Song, Y. (2009), Performance evaluation of green supply chain management based on membership conversion algorithm, in proceeding of IEEE International Colloquium on Computing,
Communication, Control and Management.
Godfrey, R. (1998). “Ethical purchasing: developing the supply chain beyond environment”, in Russel, T. (Ed.) Greener Purchasing: Oppurtunities and Innovations, Greanleaf Publishing, Sheffield, pp. 244-251.
Holt, D. & Ghobadian, A. “An empirical study of green supply chain management practices amongst UK manufacturers”, Journal of Manufacturing Technology Management, Vol. 20 No. 7, pp. 933-956, 2009.
Lattin, J.M. Carrol, J.D. & Green, P.E. Analyzing Multivariate Data, Thomson Learning, Inc. Canada. 2003. Rao, P. “Greening the supply chain: a new initiative in South East Asia”, International Journal of
operations & Production Management, Vol. 22 No. 6, pp. 632-655, 2002.
Rao, P. & Holt, D. “Do green supply chains lead to competitiveness and economic performance?”,
International Journal of Operations and Production Management, Vol. 25 No. 9, pp. 898-916, 2005.
Sarkis, J., (2001), Greener Manufacturing and operations: from design to delivery and back, Greenleaf Publishing, UK.
Sarkis, J., (2006), Greening the supply chain, Springer-Verlag London Limited, UK
Simpson, D.Y., Power, D.J. & Samson, D. (2007). Greening the automotive supply chain: a relationship perspective. International Journal of Operations & Production Management, Vol. 27 No. 1, 2007,pp. 28-48
Shuwang, W., Lei, Z., Zhifeng, L., Guangfu, L. & Zhang, H. C., (2005), Study on the performance assessment of green supply chain, in proceeding of IEEE International Conference on Systems, Man
and Cybernetics, Vol.1, pp. 942-947.
Authors’ Background
Mr. Wan Hasrulnizzam Wan Mahmood is currently a postgraduate student at Mechanical and Materials Engineering, Universiti Kebangsaan Malaysia (UKM). He works as a lecturer at Faculty of Manufacturing Engineering, Universiti Teknikal Malaysia Melaka (UTeM). He also has extensive consultancy experience in empowering lean manufacturing practices. His research interests are maintenance management, supply chain management, lean manufacturing, operational research, quality and reliability.
Dr. Mohd Nizam Ab Rahman is an Associate Professor in Quality and Operations Management at the Department of Mechanical and Materials Engineering, UKM. His research interests include quality operations, modern quality management such as supply chain, BSC, Six sigma, Production SPC etc. He graduated in Industrial Physics in 1996, MSc in 1999 from Universiti Teknologi Malaysia and obtains his PhD in 2005 from University of Nottingham, United Kingdom. He has been working as an R&D Engineer with Panasonic AVC Networks, and has worked in Japan for a couple of years.