THE INFLUENCE OF CUSTOMER EXPECTATIONS AND THE APPLICATION OF MARKETING MIX TOWARDS THE LOYALTY OF BANK CLIENTS WITH
CUSTOMER SATISFACTION AS AN INTERVENING VARIABLE (Case Study at Bank Danamon Syariah)
Ur1:Jvor,tJli.le. l1thl:ill NO@iHf
SYARIF HIDAVATULLAH JAKARTA
By
Arba Adi Aditya Buonowikarto
604081000003
lhterin. .
··•••••1"''"''-''"" .... サセ@
dari I "',\".''(;\ """''() セ@ - NセᄋセBケ@
To\. !
NセセBBGBGGNGNGGゥIG|@
-」|セ@
J
h
D ( ' \ ( \
0 ,,..,,,,,,,,•••••••••••"''
N Jnduk , ,.,\?,._ .... セ@... セᄋᄋ@
セZ[セセウZ[ヲゥォ。ウゥ@ : ... セᄋᄋM
MANAGEMENT MAJOR
FACULTY OF ECONOMICS AND SOCIAL SCIENCES STA TE ISLAMIC UNIVERSITY SY ARIF HIDAY A 11JLLAH
THE INFLUENCE OF CUSTOMER EXPECTATIONS AND THE APPLICATION
OF MARKETING MIX TOWARDS THE LOYALTY OF BANK CLIENTS WITH
CUSTOMER SATISFACTION AS AN INTERVENING VARIABLE
(Case Study at Bank Danamon Syariah)Submitted to the Faculty of Economics and Social Sciences as a Requirement for Acquiring the Bachelor Degree of Economies
セセBGBGBBGGBGBGGセMMセBGBBBBBMMMMMᄋ|@
PERP\JSTAKAAN UTAMA .By UlN SYAHID JAKARTA
セa]イ「]。セa]、セゥ@ GZGNacBZ、ゥGZBZZB。cZZbGZcオZGZッョZGZッGBZキセゥォ]。]イエBGi⦅@ __
604081000003
Supervised by:
Prof. Dr. Ahmad Rodoni, MM AriefMufraini, Le, M.Si
セ@
⦅cヲ。セ@
GBWGセセLL⦅⦅@Prof. Dr. Ahmad Rodoni, MM
NIP 150 317 955
Mef-1\lfUiiraini, Le, M.Si
NIP 150 330 729
INTERNATIONAL CLASS PROGRAM
MANAGEMENT MAJOR
FACULTY OF ECONOMICS AND SOCIAL SCIENCES
STATE ISLAMIC UNIVERSITY SY ARIF HIDAY ATULLAH
Today, we administered a comprehensive test examination to Arba Adi Aditya Buonowikarto ID 604081000003. The title of his thesis is: "The Influence of Customer Expectations and The Application of Marketing Mix Towards The Loyalty of Bank Clients With Customer Satisfaction as an Intervening Variable". After proper examination of the work student, we have decided that he has met all of the
requirements for the title of Bachelor of Economics on the major of Management in 'the State Islamic University (Universitas Islam Negeri) Syarif Hidayatullah Jakarta.
Comprehensive Examination Team
セ@
Prof. Dr. Ahmad Rodoni, MM Deputy Dean for Academic Affairs
Prof. Dr. Abdul Hamid, MS
Jakarta April 2011' 2009
The Influence of Customer Expectations and The Application of Marketing Mix Towards The Loyalty of Bank Clients With Customer
Satisfaction as an Intervening Variable
Thesis
Submitted to Faculty of Economics and Social Sciences As a Partial Requirement for Acquiring Bachelor Degree of Economic
Academic Advisor I
Submitted by:
Arba Adi Aditya Buonowikarto
604081000003
Under The Guidance of:
セ@
Prof. Dr. Ahmad Rodoni, MM
Expert Examiner
Prof. Dr. Abdul Hamid, MS
Academic Advisor II
INTERNATIONAL CLASS PROGRAM MANAGEMENT MAJOR
FACULTY OF ECONOMICS AND SOCIAL SCIENCES STATE ISLAMIC UNIVERSITY SY ARIF HIDAY ATULLAH
JAKARTA
I.
II.
Author's Biography
PERSONAL INFORMATION
I. Name
2. Place and Date ofBi1th 3. Address
4. Phone
EDUCATION
I. Elementary School 2. Middle School 3. High School 4. Bachelor Degree
Arba Adi Aditya Buonowikarto Jakarta, 11 July 1986
Taman Giri Loka block C-15 Sector IV.5 Bumi Serpong Damai, Tangerang
0838-90102986
Al-Azhar Bumi Serpong Damai Al-Azhar Bumi Serpong Damai Dwiwarna Highschool
State Islamic University Jakarta III. ORGANIZATIONAL EXPERIENCE
I. State Islamic University Debating Club
IV. FAMILY BACKGROUND
I. Father Isrowandi Buonowikarto
2. Place and Date of Bhth Surakarta, 5 May 1943
3. Address Taman Giri Loka block C-15 Sector IV.5 Bumi Se1pong Damai, Tangerang
4.
Phone 021-53737835.
Mother Umroh6. Place and Date of Birth Sirih; 27 Mei 1951
7. Address Taman Giri Loka block C-15 Sector IV.5 Bumi Serpong Damai, Tangerang
8. Phone 021-5373783
ABSTRACT
This research on customer behavior of Bank Syariah Danamon is to
investigate the direct influence between customer expectations and the application
of marketing mix application towards customer loyalty of Bank Danamon
Syariah's head branch. In addition to this, research is done to see the indirect
influence of customer satisfaction as an intervening variable. 125 customers of
Bank Danamon Syariah's head branch are taken as samples.
Ibe results of the research show that customers have moderate
expectations of Bank Danamon Syariah and perceive that the marketing mix is
moderately acceptable.
Itis also shown that customer expectations and the
marketing mix application have a direct influence towards customer loyalty.
Influences are both significant simultaneously and individually. Meanwhile,
customer satisfaction is proven not to be a positive intervening variable.
ACKNOWLEDGEMENTS
First and foremost, I would like to give my utmost gratitude to the Lord Almighty, Allah swt., for I would not be able to write this thesis if it were not because all His blessings and gift of life. May Allah continue to bestow His blessings upon us all.
To begin with, I would like to express my highest gratitude to my thesis counselors Mr. Arief Mufraini and Prof. Ahmad Rodoni, without their patience and belief in me this thesis could not have been completed. My appreciation goes to all my lectures that have guided and thought me everything I needed to know about research, business and marketing. I am also deeply indebted to the gracious support from the International Program Staff, Mr. Syamsudin and Mr. Hamdih. Their hard work and dedication was of great assistance to cut through all the red tape and bureaucracy.
Special thanks to all my friends who have supported and motivated me to finish this thesis, without their undying concern and encouragement I probably would never have graduated.
Finally, I would like to sincerely thank my family and parents who have continuously and patiently sustained me no matter how lazy and unmotivated I was. My parents were always right in the end, and I love them for that. Thank you Mom and Dad, I hope that I can always make you proud of me.
TABLE OF CONTENTS
Author's Biography ... i
ACKNOWLEDGEMENTS ... ii
PREFACE ... iii
TABLE OF CONTENTS ... iv
LIST OF TABLES ... v
LIST OF FIGURES ... vi
CHAPTER I ... I Background ... I Research Premise ... 3
Research Goals ... 3
Research Benefits ... 4
Previous Research ... 4
CHAPTER II ... 8
Customer Expectations ... 8
Marketing Mix ... I 0 Customer Loyalty ... 13
Customer Satisfaction ... 14
Hypothesis ... 15
CHAPTER III ... ... 16
Research Scope ... 16
Sampling Method ... 16
Data Collection Method ... 17
Analysis Method ... 18
Operational Variable ... 20
Variable Indicators ... 21
Validity and Reliability Test ... 22
CHAPTER IV ... 27
Company Background ... 27
Analysis and Discussion ... 30
CHAPTER V ... 47
Conclusion ... 47
Research Implications ... 49
REFERENCES ... ... 50
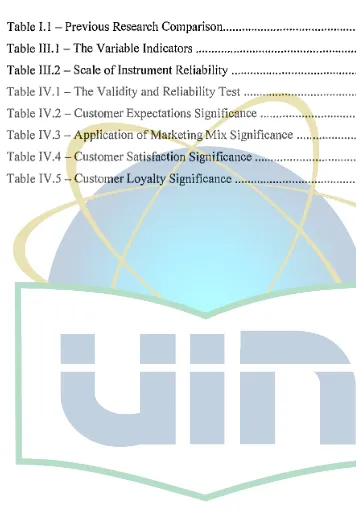
LIST OF TABLES
Table I. I - Previous Research Comparison ... 7
Table Ill.I -The Variable Indicators ... 21
Table Ill.2 - Scale oflnstrument Reliability ... 24
Table IV. I - The Validity and Reliability Test ... 30
Table IV.2 - Customer Expectations Significance ... 34
Table IV.3 -Application of Marketing Mix Significance ... 34
Table IV.4 - Customer Satisfaction Significance ... 35
[image:10.595.87.443.137.656.2]LIST OF FIGURES
Figure II.I - The Four Main Fields of the Marketing Mix ... 11 Figure II.2 - The Extended 7-P Marketing Mix ... 12 Figure III. I - The Path Analysis Model ... I 9
A. Background
CHAPTER I
INTRODUCTION
In any type of business, the final and most important goal is the customer. The customer is a major stakeholder in any business. The slogan "customer is king" or "the customer is always right" indicate the importance of customers to businesses. To know what the customers expect and perceive of a certain company would be very valuable information. In service oriented industries, customers are regarded even higher compared to other business types. The ultimate goal of a customer oriented business would be to create customer satisfaction and eventually customer loyalty. Satisfied and loyal customers would return to use the company's services and spread the word of its quality.
The concept of Syariah Bank has become a popular concept in modern banking today. Its values and system is considered to be strong even in the face of economic instability and crisis. Bank Syariah Danamon is a major brand in Indonesia's Syariah Banking competing field. Its products, such as the Dirham Card, have continued to be innovative and highly successful. Its application of an exceptional marketing strategy has made it one of the leading brands.
In running its activity, Danamon Syariah applies systems of share holder
resources who fulfill the following characteristic: siddiq (honest), tabligh (reliable),fathonah (clever), amanah (trustable) and itqan (professional).
The Danamon Syariah Bank existence is expected to fulfill people's need of banking product and service based on Syariah principles of business and halal
(lawful) instead of embracing riba system (profitting the money), ghoror
(manipulative) and maisyir (speculative). Thereby, people can enjoy banking service that match with Syariah law, which spiritually will create peace of mind because their fund will be ploughed back to business or thing that benefits a lot of people.
B. Research Premise
There are several issues or 'problems' that need to be addressed in the research. These issues to be resolved can be simplified in there fonn of answering these following questions:
I. What are the customer's expectations of the clients of Bank Danamon Syariah?
2. What are the customers' perceptions on the application of the marketing mix of Bank Danamon Syariah?
3. Is there a direct influence between customer expectations and the marketing mix application towards customer loyalty?
4. Is customer satisfaction a positive intervening variable between customer expectations and marketing mix application?
C. Research Goals
A research paper needs to have certain goals so that it can become measureable if it is successful or not in conducting its research. The research goals must be able to answer the research issues above.
1. Discover the level of customer expectations of the clients of Bank Danamon Syariah.
2. Discover the customers' perceptions of the application of the marketing mix of Bank Danamon Syariah.
4. Determine if customer satisfaction is an intervening between customer expectations and marketing mix application.
D. Research Benefits
The researcher hopes the research conducted may bring benefit both to the academic world and the syariah banking in the following capacity;
I. Become a tool for understanding customer behavior
2. Become a tool for developing the science of marketing and marketing strategy
3. Increase the quality of service for Bank Danamon Syariah
4. Increase the marketing efficiency of Bank Danamon Syariah by understanding what the customers views on the marketing mix
E. Previous Research
Previous research has been conducted on similar variables or methodologies. The researcher credits these previous researchers in the reference section and citing them when they are present. The most significant and similar research done previously before this research can be seen below:
1. The Nature and Determinants of Customer Expectations ofService by Valarie
A. Zeithaml, Leonard L. Berry, and A. Parasuraman (1993)
adequate service, and predicted service. Seventeen propositions about service expectations and their antecedents are provided. Discussion centers on the research implications of the model and its propositions.
2. The Ir1fluence of Loyalty Programs and Short-Term Promotions on Customer
Retention by Michael Lewis (2004)
The research estimates the theoretical model using a discrete-choice dynamic programming formulation. The research evaluates a specific loyalty program with data from an online merchant that specializes in grocery and drugstore items. Through simulation and policy experiments, it is possible to evaluate and compare the long-term effects of the loyalty program and other marketing instruments (e.g., e-mail coupons, fulfillment rates, shipping fees) on customer retention.
3. A Path Analysis of a Music Listening Preference Model by Young Chang Jin
(1999)
to test if a music listening preference model based on these variables fit the data well. Analysis of the chi-square goodness-of-fit test indicated that the path model fit the data well.
4. Ekspektasi Pelanggan Dan Ap/ikasi Bauran Pemasaran Terhadap Loyalitas
Tako Moderen Dengan Kepuasan Pelanggan Sebagai Intervening (Studi
Kasus Pada Hypermarket Carrefour Di Surabaya) by Hatane Semuel (2006)
Table I.I
Title
Author Year Variables Methodolo""The Nature and Zeithaml, Berry,
1993
I. Customer ExplorativeDeterminants of and Parasuraman Expectations with
Customer
2.
Desired Service ConceptualExpectations of
3.
Adequate Service ModelService
4.
Predicted ServiceA Path Analysis of a Young Chang Jin
1999
I. Listening Path AnalysisMusic Listening Preference
Preference Model
2.
Music Experience3.
Music FamiliarityThe Influence of Michael Lewis
2004
I. Loyalty Programs StructuralLoyalty Programs and
2.
Marketing EquationShort-Term Instruments Modeling
Promotions on
3.
CustomerCustomer Retention Retention
Ekspektasi Pelanggan Hatane Semuel
2006
I. Customer StructuralDan Aplikasi Bauran Expectations Equation
Pemasaran Terhadap
2.
Application of ModelingLoyalitas Toko Marketing Mix
Moderen Dengan
3.
CustomerKepuasan Pelanggan Loyalty
Sebagai Intervening
4.
CustomerSatisfaction
The Influence of Arba Adi Aditya
2009
I. Customer Path AnalysisCustomer Buonowikarto Expectations
Expectations and the
2.
Application ofApplication of Marketing Mix
Marketing Mix
3.
CustomerTowards the Loyalty Loyalty
of Bank Clients with
4.
CustomerCustomer Satisfaction Satisfaction
[image:18.595.57.485.116.564.2]A. Customer Expectations
CHAPTER II LITERATURE REVIEW
Customer expectations can be defined as a perceived value customers seek from the purchase of a good or service (Gilbert, 2003). Customer expectations are what customers want or expect to be present and available at the time of purchasing a product or service. These expectations include non-tangible things, such as store environment, quality of services, customer handling system, etc. Customers' expectations are not constant because they follow the current development of culture, technology, and economy. What a customer expects today will not necessarily be the same as what they expect in the future.
According to Zeithaml (1991 ), the conceptual model of customer expectations is divided into four main sections: (I) the expected service component, (2) antecedents of desired service, (3) antecedents of adequate service, and (4) antecedents of both predicted and desired service.
1. The expected service component describes two types of customer expectations of service. First, desired service is defined as the level of service the customer hopes to receive and second as the level of service the customer will accept.
3. Antecedents of adequate service identifies and explains five of the main influences on adequate service-transitory service intensifiers, perceived service alternatives, self-perceived service role, situational factors, and predicted service.
4. Antecedents of both desired and predicted service details four variables:
explicit service promises, implicit service promises, word-of-mouth communications, and past experience, all of which affect both desired and predicted service.
Service quality is an important factor in customer expectations. According to Gilbert (2003 ), elements of customer satisfaction can be categorized into the following:
I. Tangible: Anything with a physical form that can supp01t the business'
service operations. Examples are; building facilities, stationeries & tools, employee uniforms, etc.
2. Reliability: The ability of the business in delivering service as it has promised with consistency.
3. Responsiveness: The ability of the business to respond and supp01t its
customers in quick and systematic way.
4. Competence: The capability of the business in delivering its service to
create trust and satisfaction into its customers.
5. Empathy: The business' attitude in delivering its service. A caring,
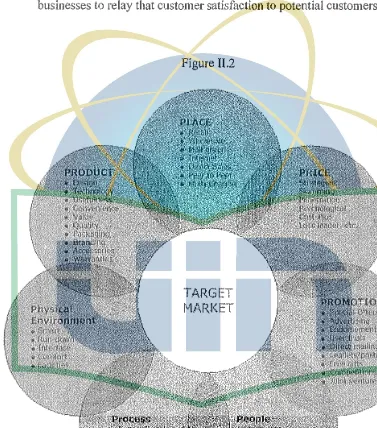
B. Marketing Mix
A marketing mix can be defined as a set of controllable, tactical marketing tools that work together to achieve company's objectives (Kotler, 2005). The marketing mix is generally accepted as the use and specification of the 'four P's' describing the strategic position of a product in the marketplace. The classical marketing mix - proposed by E. Jerome McCarthy ( 1960), has four elements knows as the 'four Ps', which are:
1. Product: A tangible object or an intangible service that is mass produced
or manufactured on a large scale with a specific volume of units. Intangible products are often service based like the tourism industry & the hotel industry. Typical examples of a mass produced tangible object are the motor car and the disposable razor. A less obvious but ubiquitous mass produced service is a computer operating system.
2. Price: The price is the amount a customer pays for the product. It is determined by a number of factors including market share, competition, material costs, product identity and the customer's perceived value of the product. The business may increase or decrease the price of product if other stores have the same product.
3. Place: Place represents the location where a product can be purchased. It
4. Promotion: Promotion represents all of the communications that a marketer may use in the marketplace. Promotion has four distinct elements - advertising, public relations, word of mouth and point of sale.
Figure II.I
Booms and Bitner included three additional 'Ps' to accommodate trends towards a service or knowledge based economy:
I. People: all people who directly or indirectly influence the perceived value
of the product or service, including knowledge workers, employees, management and consumers.
2. Process: procedures, mechanisms and flow of activities which lead to an
3. Physical evidence: the direct sensory experience of a product or service that allows a customer to measure whether he or she has received value. Both tangible good that help communicate and perform the service, and the intangible experience of existing customers and the ability of businesses to relay that customer satisfaction to potential customers.
Figure II.2
TARGET
[image:23.595.91.468.230.658.2]C. Customer Loyalty
Customer loyalty can be defined as the totality of feelings or attitudes that would incline a customer to consider the re-purchase of a particular product or service. Customer loyalty is determined by three factors: relationship strength, perceived alternatives and critical episodes (Reichheld, 1996).
Major factors that negatively affect customer loyalty: I. The customer moves out of the service area
2. The customer no longer has a need for the products or service 3. More suitable alternative providers become available
4. Poor handling of a critical episode
Customer loyalty can be achieved in some cases by offering a quality products and services with a firm guarantee. Customer loyalty is also achieved through rewards and incentive programs. The ultimate goal of customer loyalty programs is satisfied customers who will return to purchase again and persuade others to use that company's products or services.
While different systems and labels of customer loyalty are used in every company, Zeithaml (2001) divides customers into four tiers:
I. The Platinum Tier describes the company's most profitable customers, typically those who are heavy users of the product, not overly price sensitive, willing to invest in and try new offerings, and are committed to the firm.
2. The Gold Tier differs from the Platinum Tier in that profitability levels are not as high, perhaps because the customers want price discounts that limit margins. They might not be as loyal to the firm even though they are heavy users in the product category--they might minimize risk by working with multiple vendors rather than just the focal company.
3. The Iron Tier contains customers that provide the volume needed to utilize the firm's capacity but whose spending levels, loyalty, and profitability are not substantial enough for special treatment.
Loyalty marketing is an approach to marketing, based on strategic management, in which a company focuses on growing and retaining existing customers through incentives. Branding, product marketing and loyalty marketing all form part of the customer proposition - the subjective assessment by the customer of whether to purchase a brand or not based on the integrated combination of the value they receive from each of these marketing disciplines (Evans, 2007).
D. Customer Satisfaction
Customer satisfaction is the ability of goods or services to meet or exceed buyer need and expectations (Km1z and Boone, 1995). According to Kotler (2000), customer satisfaction is a person's feelings of pleasure or disappointment resulting from comparing a product perceived performances (or outcome) in relation to his or her expectations.
Organizations are increasingly interested in retaining existing customers while targeting non-customers; measuring customer satisfaction provides an indication of how successful the organization is at providing products and/or services to the marketplace (John, 2003).
Because satisfaction is basically a psychological state, care should be taken in the effort of quantitative measurement, although a large quantity of research in this area has recently been developed. According to Berry (Bart Allen) and Brodeur (1991), there are ten 'Quality Values' which influence satisfaction behavior, further expanded by Berry in 2002 and known as the ten domains of satisfaction. These ten domains of satisfaction include:
I. Quality 6. Environment
2. Value
7.
Inter-departmental Teamwork3.
Timeliness 8. Front line Service Behaviors4.
Efficiency 9. Commitment to the Customer5.
Ease of Access 10. InnovationE. Hypothesis
HI: Customer expectations have a positive towards customer loyalty.
H2: Marketing mix application has a positive influence towards customer loyalty. H3: Customer expectations have a positive influence towards customer satisfaction.
H4: Marketing mix application has a positive influence towards customer satisfaction.
A. Research Scope
CHAPTER III
RESEARCH METHODOLOGY
This research is an exploratory study. An exploratory study is undertaken when there is no infmmation at hand, or no information is available on how similar problems or research issues have been solved in the past.
In this research, research is done by collecting secondary data coming from written and digital literature found in book, journals, and the internet. Primary data is obtained by spreading questionnaires. The population of this research is the clients of the head branch of Bank Danamon Syariah in Prapatan, Jakarta.
B. Sampling Method
The sampling method used is judgment sampling. Judgment sampling involves the choice of subjects who are most advantageously placed or in the best position to provide the information required. Thus the judgment sampling design is used when a limited number or category of people have the information that is sought.
The criteria for the respondents are:
The level of sampling in this research is accounted based on the opinion of Hair and Augusty Ferdinand (2002) that the minimum sample measure applied in
Structural Equation Modeling (SEM) is to be counted by 5 observations for every
estimated parameter. This research applies 25 indicators before performing the validity and reliability tests. Based on the formula mentioned above, the total samples used in this research= 25 x 5 = 125 respondents.
C. Data Collection Method
Data collection is done through questionnaires given to clients of Bank Danamon Syariah. Questions are ordered systematically while answers are in the form of multiple choices. Questions are made to be simple and easy to understand to avoid ambiguity.
Questionnaire analysis is done by giving value from every answer to questions of the questionnaire based on Likert scale method, according to Masri Singribun (1995) as follows:
• Strongly agree: value weight 5
• Agree: value weight 4
• Not sure (neither agree nor disagree): value weight 3
• Disagree: value weight 2
• Strongly disagree: value weight l
D. Analysis Method
1. Path Analysis
The analysis of this research uses the path analysis. Path analysis is an extension of the regression model, used to test the fit of the correlation matrix against two or more causal models which are being compared by the researcher. The model is usually depicted in a circle-and-arrow figure in which single-headed arrows indicate causation (Cohen, 2003). A regression is done for each variable in the model as a dependent on others which the model indicates are causes. The regression weights predicted by the model are compared with the observed correlation matrix for the variables, and a goodness-of-fit statistic is calculated. The best-fitting of two or more models is selected by the researcher as the best model for advancement of theory.
In applying the analysis, the researcher uses two different kinds of variables, namely exogenous and endogenous variables, also known as independent and dependant variables.
Within the path analysis the exogenous variable is the variable that another variable regresses on. Exogenous variables can be recognized in a graphical version of the model, as the variables sending out arrowheads, denoting which variable it is predicting. A variable that regresses on a variable is always an endogenous variable even if this same variable is used as a variable to be regressed on. Endogenous variables are recognized as the receivers of an atTOwhead in the model.
In the path model below, the two independent or 'exogenous' variables (Customer Expectations and Application of Marketing Mix) are modeled as being correlated and as having both direct and indirect effects (through Customer Satisfaction) on Customer Loyalty. Customer Satisfaction and Customer Loyalty are the two dependent or 'endogenous' variables.
customer Expectatl'ons
Figure III.I
Customer
SiitlsfacUon Custon1er loyalty
AppHcatlonof
l]]]]MMMM[[BBBGセMセ@
MarketlntfMIX
relationships between observed variables, such as independent and dependent variables, in empirical research {Tolman, I 938). An intervening variable facilitates a better understanding of the relationship between the independent and dependent variables when the variables appear to not have a definite connection.
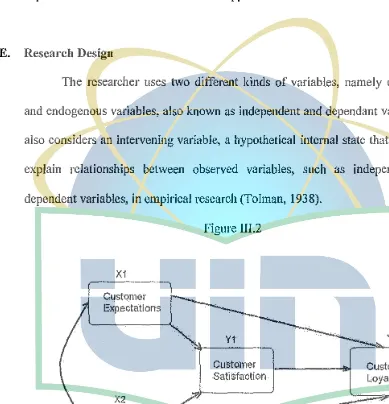
E. Research Design
The researcher uses two different kinds of variables, namely exogenous and endogenous variables, also known as independent and dependant variables. It
also considers an intervening variable, a hypothetical internal state that is used to explain relationships between observed variables, such as independent and dependent variables, in empirical research (Tolman, 1938).
X1
Customer Expectations
X2
[image:32.595.67.456.212.616.2]Application of Markeling Mix
Figure III.2
Customer Sati$faction
A. Exogenous I Independent Variables: X1 =Customer Expectations
X2
= Application of Marketing MixY2
B. Endogenous I Dependant Variables: Y 1
=
Customer SatisfactionY 2 = Customer Loyalty
It is hypothesized that X1 has an indirect affect on Y2 trough X1 that it also
influences Y 2. Thus, X1 is hypothesized as an intervening variable.
F. Classification of Variables
Table Ill.I
No Variable No. Indicator Scale
1 Customer 1 Tangible Expectations Ordinal Expectations (X1)
2 Reliability Expectations Ordinal
3 Responsiveness Expectations Ordinal
4
Competence Expectations Ordinal5 Empathy Expectations Ordinal
6
Desired Service Ordinal7 Predicted Service Ordinal 8 Antecedents Ordinal Application of
2 Marketing Mix 1 Price Ordinal (X2)
2 Product Ordinal
3 Place Ordinal
No Variable No. Indicator Scale
5 People Ordinal
6 Process Ordinal
7 Physical Evidence Ordinal
3 Customer Satisfaction (Y1) I Service Quality Ordinal
2 Service Consistency Ordinal
3 Service Delivery Ordinal
4 Service Responsiveness Ordinal
5 After Sales Service Ordinal
4 Customer Loyalty I Relationship Strength Ordinal (Y2)
2 Perceived Alternatives Ordinal
3 Critical Episodes Ordinal
4 Return Purchase Ordinal
5 Rewards and Incentives Ordinal
6 Recommendations Ordinal
G. Validity and Reliability Test
that the instrument is applicable to measure what will be measured accurately and COITectly.
Test validity can be assessed in a number of ways and thorough test validation typically involves more than one line of evidence in support of the validity of an assessment method (e.g. structured interview, personality survey, etc). The current Standards for Educational and Psychological Testing follows Samuel Messick in discussing various types of validity evidence for a single summative validity judgment. These include construct related evidence, content related evidence, and criterion related evidence.
Construct validity evidence involves the empirical and theoretical support
for the interpretation of the construct. Such lines of evidence include statistical analyses of the internal structure of the test including the relationships between responses to different test items. They also include relationships between the test and measures of other constructs.
The reliability test is done to know consistency and measurement accuracy when measurements are done at the same object repeatedly with the same instrument. Testing the reliability is shown by using the Cronbach 's Alpha
coefficient. The standardized formula of Cronbach's Alpha can be defined as:
N
·c
。]]NNLMMセMMLMセセNNNNNLMセNNLNN@
(v+(N-l)·c)
[image:36.595.86.459.202.653.2]where N is the number of components (items or testlets),
fJ
equals the average variance andc
is the average of all covariances between the components (Cronbach, 1951). According to Ferdinand and Agusty (2002), the reliability test results with value of Cronbach's Alpha > 0.5 are deemed as reliable. But more flexibly, Sugiono (2005) suggests that the score of reliability differentiates on every variable. To interpret the range of reliability for an instrument, a base directive is used as shown below:Table III.2
Scale of Instrument Reliability Interval Coefficient Level of Reliability
<0.200 Very low 0.200 - 0.399 Low 0.400 - 0.599 Sufficient 0.600 - 0.799 High
H. The F Test and t Test
An F-test is any statistical test in which the test statistic has an F-distribution if the null hypothesis is true. It is most often used when comparing statistical models in order to identify the model that best fits a given set of data (Lomax, 2007).
The test statistic in an F-test is the ratio of two scaled sums of squares reflecting different sources of variability. These sums of squares are constructed so that the statistic tends to be greater when the null hypothesis is not true. In order for the statistic to follow the F-distribution under the null hypothesis, the sums of squares should be statistically independent, and each should follow a scaled chi-squared distribution. The latter condition is guaranteed if the data values are independent and normally distributed with a common variance.
The F-test in one-way analysis of variance is used to assess whether the expected values of a quantitative variable within several pre-defined groups differ from each other. The formula for the one-way ANO VA F-test statistic is
expla.ined variance
between-group variability
F
=
unexplained variance'
orF
=
within-group variability ·
The "explained variance", or "between-group variability" is
l:n;(}i.
-
Y)
2/(J{
-
1)
iwhere
Yu
is the / 11 observation in thei'
11 out ofK
groups,fi.
denotes the sample mean in the /11 group, n; is the number of observations in the ;'h group, andY
The "unexplained variance" or "within-group variability" is
"\""""' - 2
L_,(Y;i
-
Y;.)
j(lV
-
!{),
i.i
where N is the overall sample size. This F-statistic follows the F-distribution with
K - 1, N -K degrees of freedom under the null hypothesis. The statistic will be large if the between-group variability is large relative to the within-group variability, which is unlikely to happen if the population means of the groups all have the same value.
A I-test is any statistical hypothesis test in which the test statistic follows a
t distribution if the null hypothesis is true. It is most commonly applied when the test statistic would follow a normal distribution if the value of a scaling term in the test statistic were known.
In testing the null hypothesis that the population mean is equal to a specified value µ0, one uses the statistic:
Where:
s =the sample standard deviation of the sample
CHAPTER IV
PERPUSTA!<AAN UTAMA UIN SYAHID JAKARTA
ANALYSIS AND DISCUSSION
A. Company Background
The establishment of Bank Danamon Syariah represents Bank Danamon's vision to become The Bank of Choice and also a strategic step in welcoming the dynamic growth and development of Syariah banking and as an effort to support government action to increase the economic growth in Indonesia.
The main segment and fund raising comes from the middle-upper class, and the defrayal channeling focuses 80% for UKMK sector and 20% for consumers.
The grand launch of Bank Danamon Syariah marked with the opening first branch at Ciracas, East Jakarta, on 14th May 2002 by Secretary of State Minister of Cooperation and Small and Medium Industry (UKM), Chairul Facijar Sofoan
deputizing State Minister of Cooperation and UKM. Nowadays, Danamon Syariah has seven branch offices spread over Indonesia. Act as Supervisor Council of Danamon Syariah is member of Council of National Syariah Law -Council of Indonesian Muslim Scholar (MUI) including Prof. Dr. Din Syamsuddin, MA (Chief), Ir. Adi Warman Karim, MBA (Member) and Drs. Hasanuddin, Mag (Member).
In running its activity, Danamon Syariah applies systems of share holder
resources who fulfill the following characteristic: siddiq (honest), tabligh (reliable),fathonah (clever), amanah (trustable) and itqan (professional).
The Danamon Syariah Bank existence is expected to fulfill people's need of banking product and service based on Syariah principles of business and halal
(lawful) instead of embracing riba system (profitting the money), ghoror
(manipulative) and maisyir (speculative). Thereby, people can enjoy banking service that match with Syariah law, which spiritually will create peace of mind because their fund will be ploughed back to business or thing that benefits a lot of people.
With technological support and network of Bank Danamon, including almost 500 branches and about 750 ATM of Bank Danamon in all provinces, Danamon Syariah is ready to serve customers with various products of defrayal and financing which are capable to fulfill customers' needs such as:
I. Saving Account With Profit Sharing Scheme (Mudharabah)
2. Trussed Investment (Mudharabah Muqayyadah)
3. Syariah bank gold mortgage (gold and diamond with defrayal value up to Rp. 250 million)
4. Consumption defrayal (car, motorcycle, house, home-renovation and professional goods)
5. Leasing (ijarah)
Danamon Syariah customers can enjoy the ability to transact at Syariah Bank Branch Office, endorsement transaction at all Bank Danamon branches, and transaction at 700 A TM of Bank Danamon. They can also conduct online transaction at 25 conventional Bank Danamon branches in Indonesia. The online transaction includes:
1. Transferring the book from conventional account to Syariah bank account and vice versa
2. Print-out saving book
3. Online transfer to Syariah bank account 4. Cash withdrawal from Syariah Bank account
Until September 2003 Danamon Syariah Bank had collected third party fund Rp. 127 milliard and channeled defrayal about Rp 113 milliard. From total defrayal, about 40% or about Rp 44 milliard had been channeled in the form of small and medium industry (UKM) defrayal, both in the form of capital goods and investment. Total defrayal channeling of Danamon Syariah Bank mounted more than 400% in comparison with December 2002
B. Analysis and Discnssion
I. Validity and Reliability Test
As discussed in Chapter III, the validity and reliability tests are indicated and shown with the corrected point biserial correlation test and the Cronbach's Alpha. Below are the results of the test:
Table IV. I
Corrected
Cronbach's No Variable No. Question Indicator - Total
Alpha Validity Correction
Customer
l Expectations I Cus_Exl 0.594 0.746 Valid (X1)
2 Cus_Ex2 0.363 0.786 Valid 3 Cus Ex3 0.675 0.733 Valid 4 Cus Ex4 0.510 0.761 Valid 5 Cus Ex5 0.634 0.742 Valid 6 Cus_Ex6 0.588 0.748 Valid 7 Cus Ex7 0.432 0.774 Valid 8 Cus Ex8 0.129 0.809 Valid Application
2 of I App_MMI 0.435 0.788 Valid Marketing
Mix (X2)
2 App_MM2 0.390 0.792 Valid 3 App_MM3 0.503 0.781 Valid 4 App_MM4 0.561 0.775 Valid
-Corrected
Cronbach's
No Variable No. Question Indicator - Total
Alpha Validity
Correction
5 App_MM5 0.407 0.790 Valid 6 App_MM6 0.438 0.789 Valid 7 App_MM7 0.446 0.787 Valid Customer
3 Satisfaction I Cus_Satl 0.568 0.769 Valid
(Y1)
2 Cus_Sat2 0.712 0.684 Valid 3 Cus_Sat3 0.629 0.727 Valid 4 Cus_Sat4 0.525 0.774 Valid 5 Cus_Sat5 0.670 0.760 Valid 4 Customer 1 Cus_Loyl 0.321 0.396 Valid
Loyalty (Y 2)
2 Cus_Loy2 0.132 0.539 Valid 3 Cus_Loy3 0.450 0.213 Valid 4 Cus_Loy4 0.261 0.434 Valid 5 Cus_Loy5 0.285 0.803 Valid 6 Cus_Loy6 0.478 0.783 Valid Source: Prnnary Data
Cronbach Alpha of0.528. But as discussed in Chapter III, a range of0.400 - 0.599 can still be considered as sufficient.
2. Descriptive Analysis
To see the significance of the data collected, the results of the questionnaire is analyzed according to its value using the Likert scale. As discussed in Chapter III, the Likert scale used in this research has the format of five levels I points, which are:
• Strongly agree: value weight 5
• Agree: value weight 4
• Not sure (neither agree nor disagree): value weight 3
• Disagree: value weight 2
Discussed below are the analysis of each variable according to its scale and significance.
a. Customer Expectations
Figure IV.I
The total mean for the customer expectations variable is 3.38. Based on the like1i scale, it means that respondents mostly agree with the questions given. It
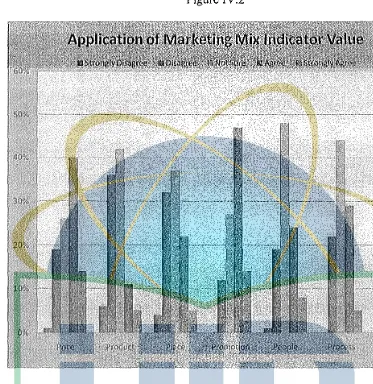
b. Application of Marketing Mix
Figure IV.2
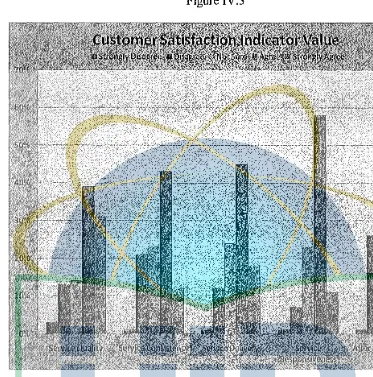
c. Customer Satisfaction
Figure IV.3
The total mean for the customer satisfaction variable is 3.57. Based on the likert scale, it means that respondents mostly agree with the questions given. It
d. Customer Loyalty
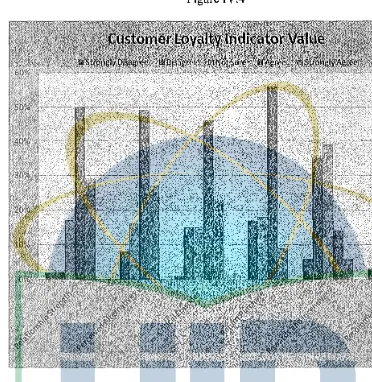
Figure IV.4
3. Correlations
Cus_Ex App_MM
Cus_Ex 1.000 0.644
Pierson Correlation
App_MM 0.644 1.000
Cus_Ex .000
Sig. ( 1 tailed)
App_MM .000
Source: Primary Data output from SPSS 16.0
C. Path Analysis Through Regression With Correlation Matrix Input
The values below are the output of calculation using the SPSS 16.0. The values significance will be fully discussed in each layer's F Test and T Test. The main objective of the calculations below is to search for the standard coefficient of
beta in each layer. The beta is used to obtain the path coefficients for every relationship of the variables. The result is pictured below.
1. Acquiring the "First Layer" multiple regression for the full model
Model Summary
Model R R Square Adjusted R Square
1 .598' .357 .344
Coefficientsa
Model Unstandardized Coefficients Standardized Coefficients t Sig.
B Std. Beta
Error
1 (Constant) 6.642 1.192 5.574 000.
Customer Expectations 0.168 0.042 .484 3.831 000.
Application of Marl<eting Mix
0.279 0.074 .586 3.760 000.
a. Predictors: (Constant), Application of Marketing Mix, Customer Expectations b. Dependent Variable: Customer Satisfaction
The above data can be formulated into the following: Y
=
6.642+
0.168X1+
0.279X2+
sWhere:
Y = Customer Satisfaction X1 =Customer Expectations
It can be concluded from the data above that customer expectations and the application of marketing mix have a significant influence on customer expectations. Customer expectations and the application of marketing mix have a significance value of 0.00, and beta weight of 0.484 and 0.586 respectively. This means that the application of marketing mix is the more dominant variable.
As shown with the equation above, if the value of customer expectations is added by a value of 1, customer satisfaction will increase by 0.168. If the application of marketing mix is added by
a.
value of 1, customer satisfaction will increase by 0.279.2. Acquiring the "Second Layer" multiple regression for the full model
Model Summary
Model R R Square Adjusted R Square
1 .598" .357 .344
Coefficients'
Unstandardized Standardized
Coefficients Coefficients
Model B Std. Error Beta t
1 (Constant) 6.571 1.267 5.187
Customer Expectations 0.162 0.053 .454 3.056
Application of Marketing Mix
0.277 0.076 .361 3.664
Customer Satisfaction 0.007 0.040 .763 0.172
a. Predictors: (Constant). Customer Sat1sfact1on, Customer Expectations, Appl1cat1on of Marketing Mix
b. Dependent Variable: Customer Loyalty
The above data can be fonnulated into the following: Y = 6.571+O.l62X1+0.277X2 + 0.007Xi +s
Sig.
000.
003.
000.
Where:
Y = Customer Loyalty
X1
=Customer Expectations X2 =Application of Marketing MixX3 = Customer Satisfaction
It can be concluded from the data above that customer expectations, the application of marketing mix, and have a significant influence on customer loyalty. Customer satisfaction, on the other hand, does not have a significant value. Customer expectations and the application of marketing mix have a significance value of 0.00, and beta weight of 0.454 and 0.361 respectively. Customer satisfaction has a significance value of0.864. As seen in its significance value, B score, and t test score, it cannot be considered a significant variable towards customer loyalty. This will be further discussed in the t test section below.
As shown with the equation above, if the value of customer expectations is added by a value of I, customer loyalty will increase by 0.162.
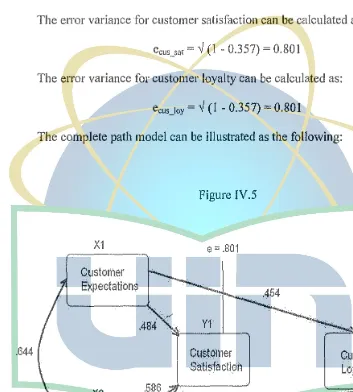
3. Portraying The Full Path Model
The path coefficients are the Beta weights from the multiple regression analyses. The error variance for each layer can also be calculated with:
The error variance for customer satisfaction can be calculated as:
ecus_sat
=
-1/ (I -0.357)=
0.801The error variance for customer loyalty can be calculated as:
ecus Joy= -1/ (I -0.357) = 0.801
[image:53.595.91.444.214.606.2]The complete path model can be illustrated as the following:
Figure IV.5
X1 e = .801 e = .801
Customer Expectations
Y1
Y2.644 Custol11er Customer
Satisfaction Loyalty
X2
----Application of .361
4. The F Test and t Test a. First Layer F Test
ANOVA•
Model Sum of Squares df Mean Square F Sig."
Regression 182.096 2 91.048 26.958 000.
Residual 327.614 122 3.377
Totai 509.710 124
a. Predictor: (Constant), Customer Expectations, Application of Marketing Mix b. Dependent Variable: Customer Satisfaction
The AN OVA test shows that the F test value is 26.958 with a level of significance of 0.000. Because the significance value is 0.000 < 0.05, it can be concluded that customer satisfaction (X1), and the application of
marketing mix (X2) in the same condition simultaneously influences the customer loyalty (Y2).
Furthermore, by comparing F test with F table with standard error 5% and degree of freedom (df) I= 2 (3-1) and (df) 2 = 122 (125-3) therefore obtaining a F table of 3.15. The F test is 26.958 > F table 3.15. Thus, the conclusion of the variables; customer satisfaction (X1) and the application
b. Second Layer F Test
ANOVA'
Model Sum of Squares df Mean Square F
Regression 182.197 3 60.732 17.802
Residual 327.513 121 3.412
Total 509.710 124
a. Predictor: (Constant), Customer Sat1sfact1on, Customer Expectations, Appl1cat1on of
Marketing Mix
b. Dependent Variable: Customer Loyalty
Sig."
000.
The ANOVA test shows that the F test value is 17.802 with a level of significance of 0.000. Because the significance value is 0.000 < 0.05, it can be concluded that customer satisfaction (X1), the application of marketing mix (X2), and customer satisfaction (Y 1) in the same condition
simultaneously influences the customer loyalty (Y2).
Fu1thermore, by comparing F test with F table with standard error 5% and degree of freedom (df) I
=
3 (4-1) and (df) 2=
121 (125-4) therefore obtaining a F table of3.15. The F test is 17.802 > F table 2.76. Thus, the conclusion of the variables; customer satisfaction (X1), the application of marketing mix (X2), and customer satisfaction (Yi) in thec. First Layer t Test
If t test > t table it means that the independent variable has significant influence towards the dependent variable. If t test < t table it means that the independent variable has no significant influence towards the dependent variable. The standard level of significance used is 5% or
(a)= 0.05.
Coefficientsa
Model t Sig.
1.(Constant) 5.574 000.
Customer Expectations 3.831 000.
Application of Marketing Mix 3.760 000.
a. Dependent Variable : Customer Satrsfact1on
Both variables are deemed significant with by the significant value. With a standard error of 5% and a degree of freedom (df) = n - total of independent variables= 125 - 2 = 123, the result of T table is 1.671. The value oft test for customer expectations is 3.831 and the value for the application of marketing mix is 3.760. Both values are larger than the t table of 1.671. Therefore, it can be concluded that customer expectations
(X1) and the application of marketing mix (X2) have individual
[image:56.595.91.456.220.529.2]b. Second Layer t Test
Coefficients a
Model t Sig.
1.(Constant) 5.187 000.
Customer Expectations 3.056 003.
Application of Marketing Mix 3.664 000.
Customer Satisfaction 0.172 0.864
a. Dependent Variable : Customer Loyalty
Two variables are deemed significant with by the significant value. With a standard error of 5% and a degree of freedom ( df) = n - total of independent variables
=
125 - 3=
122, the result of T table is I. 771. The value of t test for customer expectations is 3.056; the value for the application of marketing mix is 3.664 and the value for customer satisfaction is 0.172. Customer expectations and application of marketing mix values are larger than the t table of 1.671. Therefore, it can be concluded that customer expectations (X1) and the application ofmarketing mix (X2) have individual significance towards customer loyalty
(Y1). However, the t value of customer satisfaction is lower than the t
[image:57.595.93.461.105.537.2]A. Conclnsion
CHAPTERV
CONCLUSION AND IMPLICATIONS
There are several conclusions that can be derived from the research results above. To validate this research those results must reflect the research premise and fulfill the research goals. There are four main questions that need to be answered:
I. What are the customer's expectations of the clients of Bank Danamon Syariah?
2. What are the customers' perceptions on the application of the marketing mix of Bank Danamon Syariah?
3. Is there a direct influence between customer expectations and the marketing mix application towards customer loyalty?
4. ls customer satisfaction a positive intervening variable between customer expectations and marketing mix application?
Questions three and four are answered through the path analysis, F tests, and t tests. As discussed above, customer expectations and the marketing mix application have a direct influence towards customer loyal1y. Influences are both significant simultaneously and individually. Meanwhile, customer satisfaction has been proven not to be a positive intervening variable. As discussed, customer satisfaction has no in direct influence towards customer loyalty through customer expectations and the marketing mix application. The final conclusion requires further analysis to make sense.
B. Research Implications
The research implies that to raise customer satisfaction, Bank Danamon Syariah must pay attention to its customer expectations and application of marketing mix. The application of marketing mix, which has a more dominant influence, must be prioritized.
To raise customer loyalty, customer satisfaction is not a significant factor. Instead, Bank Danamon Syariah must concentrate on improving their marketing mix and fulfilling customer expectations.
•
ᄋᄋセ@
Ull 1
Universitas Islam Negeri
REFERENCES
American Educational Research Association, American Psychological Association, & National Council on Measurement in Education. (1999) Standards
for educational and psychological testing, Washington, DC: American
Educational Research Association
Bitner, J. and Booms, B. (I 98 I) Marketing strategies and organizational
structures for service firms, in Donnelly, J. and George, W. Marketing, American
Marketing Association, Chicago
Cohen, Jacob, et al (2003). Applied multiple regression/correlation analysis for
the behavioral sciences, Mahwah, NJ
Donnelly, J. en George, W. (1981) Marketing of services, American Marketing Association, Chicago
Evans, Stuart. (2007) No Such Thing as Loyalty, iclployalty.com
Hoyle, R H ( ed) (1995) Structural Equation Modeling: Concepts, Issues, and
Applications, SAGE
John, Joby (2003). Fundamentals of Customer-Focused Management: Competing
Through Service, Westpmt, Conn.: Praeger
Kotler, Philip, Keller, Lane (2005) Marketing Management, Prentice Hall
Lomax, Richard G. (2007) Statistical Concepts: A Second Course, ISBN 0-8058-5850-4
Lorraine Sherry., Item Analysis (1997) article accessed on June 14 2009 from http://www.cudenver.edu/-lsherry /item_ analysis.html
Reichheld, F. (1996) The Loyalty Effect, Harvard Business School Press, Boston, 1996
Zeithaml, V.A., Bery, L.L and Parasuraman, A. (1991) The Nature and
Determinants of Customer Expectations of Service, Duke University
Zeithaml, V.A., Bery, L.L and Parasuraman, A. (1996) The Behavioral
Consequences of Service Quality, Journal of Marketing
Zeithaml, Valarie A.; Rust, Roland T.; Lemon, Katherine N. (2001) The Customer
Pyramid: Creating And Serving Profitable Customers, California Management
PP END IX
Model Summary
fodel R R Square
L Predictors: (Constant), Application of Marketing Mix, Customer Expectations
Coefficients'
Standardized
Unstandardized Coefficients Coefficients
node! B Std. Error Beta t Sig.
(Constant) 1.604 1.588 1.010 .419
Customer Expectations .242 .274 .484 .883 .470
Application of Marketing
.372 .348 .586 1.069 .397
Mix
'· Dependent Variable: Customer Satisfaction
Model Summary
I , I ,,_
I
fodel
.989' .978
. Predictors: (Constant), Customer Satisfaction, Customer Expectations, Application of Marketing Mix
Coefficients•
Standardized
Unstandardized Coefficients Coefficients
fodel B Std. Error Beta t Sig.
(Constant) -2.043 1.126 -1.814 .321
Customer Expectations .470 .186 .454 2.523 .240
Application of Marketing
-.476 .252 -.361 -1,888 .310
Mix
Customer Satisfaction 1.581 .408 .763 3.874 .161
ANOVA"
Sum of
Model Sauares di Mean Souare F Sia.
1 Regression .293 2 .146 .483 .675°
Residual .606 2 .303
Total .899 4
a. Predictors: (Constant), Customer Satisfaction, Application of Marketing Mix b. Dependent Variable: Customer Expectations
ANOVA"
\ilodel Sum of Sauares df Mean Sauare F
1 Regression .943 3 .314 14.922
Residual .021 1 .021
Total .964 4
1. Predictors: (Constant), Customer Expectations, Apphcat1on of Marketing MIX, Customer
latisfaction
>. Dependent Variable: Customer Loyalty
セッ@ Variable No. Indicator Mean SA A NS D SD Customer
I Expectations l Tangible Expectations 3.72 2% 12% 17% 50"/o 19% (XI)
2 Reliability 3.77 3% 11% 17% 44% 25% Expectations
3 Responsiveness 3.00 4% 31% 33% 25% 7% Expectations
4 Competence 2.94 6% 34% 28% 24% 8% Expectations
5 Empathy Expectations 2.75 8% 36% 33% 19% 4%
6 Desired Service 2.84 8% 29% 38% 21% 4%
7 Predicted Service 3.84 0% 11% 18% 47% 24% 8 Antecedents 4.21 0% 2% 12% 49% 37% Mean 3.38 4% 21% 25% 35% 16% Application
2 of I Price 3.47 1% 19% 26% 40% 14% Marketing
Mix (X2)
2 Product 2.73 6% 36% 42% 11%
5%
3 Place 2.92 4% 32% 37% 22% 5% 4 Promotion 3.63 0% 12% 27% 47% 14% 5 People 3.19 1% 19% 48% 24% 8%
6 Process 3.17 0% 22% 44% 29% 5% 7 Physical Evidence 3.46 1% 14% 34% 40% 11%
Customer
3 Satisfaction l Service Quality 3.82 3% 13% 14% 39% 31% (Yl)
2 Service Consistency 3.44 1% 21% 23% 43% 12% 3 Service Delivery 3.67 1% 12% 24% 45% 18% 4 Service 3.71 1% 7% 23% 58"/o 11%
Responsiveness
5 After Sales Service 3.23 1% 26% 30% 35% 8%
Mean 3.57 1% 16% 23% 44% 16%
Customer
4 Loyalty I Relationship Strength 4.02 2% 2% 17% 50% 29% (Y2)
2 Precived Alternatives 3.93 0% 8% 16% 49% 27%
-3 Critical Episodes 3.75 1% 15% 15% 46% 23% 4 Return Purchase 3.57 0% 17% 18% 56% 9%
5 Rewards and 2.79 6% 35% 39% 14% 6%
Incentives
6 Rcccomendations 3.58 3% 8% 30% 46% 13%
Questionnaires for Thesis Research Case Study on Bank Danamon Syariah
)lease answer the questions below using a scale of I - 5 With I being the lowest and 5 being the highest
Question Strongly Disagree
1
I expect Bank Danamon Syariah to have good facilities
I expect Bank Danamon Syariah to be reliable
I expect Bank Danamon Syariah to have good customer response
I expect Bank Danamon Syariah to be competent in their services
J expect Bank Danamon Syariah to be sympathetic in their services
I demand Bank Danamon Syariah to have higher level of services
I have had good experiences with Bank Danamon Syariah
Bank Danamon Syariah has good profit sharing ratios
Bank Danamon Syariah has good programs and products
Bank Danamon Syariah has good locations
Bank Danamon Syariah has good advertising
Bank Danamon Syariah has professional staff and empoyees
Bank Danamon Syariah has a good processing system
Bank Danamon Syariah has good facilities Bank Danamon Syariah has hi:;h service quality
Disagree
2
I
Neither Agree Strongly Agree
3 4
5
PER PUST AKAAN UT AM1'C...
'
UIN SY AH ID JAKARTA
J
Question Strongly Disagree Neither Agree Strongly
.
Disagree AgreeBank Danamon Syariah is consistent in providing good service
Bank Danamon Syariah delivers its service in a good manner
Bank Danamon Syariah has good service response
Bank Danamon Syariah has good after sales service
I feel a strong relationship with Bank Danamon Syariah
There are many alternatives to Bank Danamon Syariah
Bank Danamon Syariah are good at handling critical problems
I will continue to become a client of Bank Danamon Syariah
Bank Danamon Syariah has good rewards and incentives