REAL TIME PRODUCTION MONITORING SYSTEM
SIVA KUMAR S/O SUBRAMANIAM
A thesis submitted in fulfillment of the requirements for the award of the degree of Master of Science in Electronics Engineering
REAL TIME PRODUCTION MONITORING SYSTEM
SIVA KUMAR S/O SUBRAMANIAM
A thesis submitted in fulfillment of the requirements for the award of the degree of Master of Science in Electronics Engineering
" I declare that this thesis entitled Real Time Production Monitoring System is a result of my own works except as cited in the references "
Signature
Name Date
: Siva Kumar s/o Subramaniam : 16 February 2009
We hereby declare that we have read this thesis and our opinion this thesis is sufficient in terms of scope and quality for the award of the degree of
Master of Science in Electronics Engineering
Signature
ABDUL HAMID BIN HAMIDON
¥
P rofesor _c::::::-7 Fakulti Kejuruleraan Elektrooik Dan Keiuruteraan Komputer
, ⦅Z⦅ セ@ i i\I Teknikal Malaysia Melaka (UTeM)
• • .. • • • • - • •• • • .. • .LJo yゥAイセ@ ᄋ セ。イオョ|ゥ@ B'ett.011er No 11s2 Pejabat Pos Durian Tunggal 76109 Durian Tunggal, Melaka
Name of supervisor I : Professor Abdul Hamid bin Hamidon Date
Signature
: 16 February 2009
sm
HUZAIMAH BINTI HUSIN⦅ i\N セ@ Jabatan (Elektronik lnduslri)
fャャャャNエャャゥ ⦅ kセ@ Elabonik 0111 kセオョ@ icセ@ Urwerliti Taknikal Malaysia Melaka (UTeM)
• • • • • • • • • • • • • • ᄋ セエオョァ@ Berkunci No 1752
,.ajabat Poa Durian Tunggal 71109 Durian Tunggal, M1laka Name of supervisor II : Madam Siti Huzaimah bin ti Husin
Date : 16 February 2009
ACKNOWLEDGMENTS
As usual when a piece of work this size comes to an end there are many people to thank than is practically possible. To those I have forgotten to mention, thank you first of all. There are however a few people I remember in particular.
I am deeply thankful to my supervisor Professor Abdul Hamid bin Hamidon. He has been enthusiastically inspiring and encouraging me since I started my research. Without his excellent guidance and tremendous support, this research work would not have been possible.
My heartfelt gratitude also goes to my co-supervisor Madam Siti Huzaimah binti Husin for her great enthusiasm, interaction, friendship and valuable advice over the years.
My deepest gratitude goes to my mother and father who supported me mentally. I' m also grateful to my wife Miss Kavitha d/o Krishnan who showed infinite patience and understanding during my study and gave tremendous moral support and loving encouragement.
Writing a thesis is an extremely time consuming task I therefore would like to thank my friends for persistently asking me the killer question "How is your Master's ?"
ABSTRACT
A production monitoring system is a system that is used in real time to record production line problems. It is constructed using programmable logic controller and sensors to collect data from production lines. The real time production monitoring system is designed to collect data automatically and display the data on display boards for the workers to see. Devices in the real time production monitoring system are capable of working as individual units or working together with multiple terminal links such as automated machineries, robotic systems and manual process line. The data will also be relayed to the management for prompt action.
Data on production time, non-production time, targets, rejection rates, planned stops, and cycle times will be displayed as well as relayed to the management. Unadulterated data collected from the real time production monitoring system should be relayed to the management without human intervention. Such data would then be interpreted accordingly in order to identify the faults at production level and to spur corrective measures from the management. With the help of this real time production monitoring system the management will be able to monitor both the workers and machine performance. Display of data can also prompt instant action from both workers and line supervisors.
The data collected is in line with the requirements of overall equipment effectiveness. Overall equipment effectiveness is the tool for improving efficiency. Efficiency of production lines enables better yield and utilization of the available resources. The real time production monitoring system together with overall equipment effectiveness will help companies to generate higher revenue.
ABSTRAK
Sistem pengawasan pengeluaran merupakan sistem yang digunakan di dalam masa nyata bagi merekodkan sebarang permasalahan yang berkaitan dengan talian pengeluaran. Ia dibina menggunakan sistem kawalan logik boleh aturcara (PLC) dan beberapa pengesan bagi mendapatkan data daripada talian pengeluaran. Sistem pengawasan pengeluaran masa nyata adalah direka untuk memperolehi data secara automatik dan memaparkan data pada paparan bagi membolehkan ianya dilihat oleh para pekerja. Alat peranti di dalam sistem ini adalah berkebolehan untuk berkerja sama ada secara persendirian mahupun bekerjasama dengan beberapa rangkaian pangkalan seperti mesin berautomatik, sistem robot dan talian pengeluaran secara manual. Data-data juga akan dialirkan kepada pihak pengurusan bagi tindakan lanjut.
Data-data yang terlibat di dalam masa pengeluaran, masa bukan pengeluaran, sasaran pengeluaran, kadar tolak, pemberhentian berjadual, dan masa kitaran akan dipaparkan dan dihantar kepada pihak pengurusan. Data-data asli yang dikumpulkan melalui sistem pengeluaran masa nyata ini akan diagihkan kepada pihak pengurusan tanpa campurtangan manusia. Data-data tersebut kemudiannya akan ditafsir bagi mengenalpasti kelemahan di peringkat pengeluaran dan membolehkan pihak pengurusan mendapatkan pengukuran yang sepatutnya. Adalah difikirkan sesuw sekiranya data-data ini disambungkan terns ke dalam sistem komputer. Dengan adanya bantuan dari sistem pengawasan pengeluaran masa nyata ini, pihak pengurusan mampu mengawasi kedua-dua pihak, samada pekerja mahupun kemampuan mesin. Melalui paparan data ini, tindakan segera dari pekerja dan penyelia talian mampu diperolehi.
Data-data yang terkumpul seharusnya setara dengan syarat-syarat keberkesanan keseluruhan peralatan. Keberkesanan keseluruhan peralatan merupakan alat atau medium penambahbaikan kecekapan. Kecekapan satu-satu talian pengeluaran membolehkan hasil yang baik diperolehi dan penggunaan sumber-sumber yang sedia ada dipertingkatkan. Sistem pengawasan pengeluaran masa nyata digandingkan bersama dengan keberkesanan keseluruhan peralatan mampu membantu sesebuah syarikat dalam memacu keuntungan yang lebih tinggi.
TABLE OF CONTENTS
CHAPTER TITLE PAGE
VERIFICATION OF WORK BY AUTHOR 11
VERIFICATION OF WORK BY SUPERVISOR 111
ACKNOWLEDGMENTS 1v
ABSTRACT ( ENGLISH VERSION ) v
ABSTRACT (MALAY VERSION) v1
TABLE OF CONTENTS vu
LIST OF FIGURES x11
LIST OF TABLES xv
LIST OF ABBREVIATION xv11
Chapter 1 INTRODUCTION
1.1 The production line 1
1.2 Factors contributing to inefficiency of production 4 lines
1.2.1 Machine efficiency 4
1.2.2 Man power utilization 5
1.2.3 Other factors affecting production line 5 efficiency
1.3 Existing Production monitoring system 1.3 .1 Andon Lights
1.3.2 Goal and Variance Counters 1.3.3 Accept and Reject Counters
6
6
7 7
CHAPTER TITLE PAGE
1.3.4 White Board or Tracking Sheets 8 1.3.5 Machine Controllers and Programmable Logic 9
Controller (PLC)
1.4 Real Time Production Monitoring System 10
1.5 Objective of study 12
1.6 Scope of research 12
Chapter 2 JIDOKA AND OVERALL EQUIPMENT
EFFECTIVENESS
2.1 The concept of Jidoka 14
2.2 The concept of Andon 15
2.3 Overall Equipment Effectiveness 17 2.4 Calculation of Overall Equipment Effectiveness 19
2.4.1 Availability 21
2.4.2 Performance 22
2.4.3 Quality 22
2.4.4 Overall Equipment Effectiveness 23 2.5 Losses due to ignorance of Overall Equipment 24
Effectiveness
2.5.l Breakdowns 25
2.5.2 Setup and adjustments 26
2.5.3 Small stops and reduced speed 26 2.5.4 Startup rejects and production rejects 27 2.6 Other methods of analyzing collected data 27
2.6. 1 Root Cause Analysis 27
2.6.2 Fault Tree analysis 28
CHAPTER TITLE PAGE
Chapter 3 PRODUCTION DATA MANAGEMENT SYSTEM
3.1
Accurate data management30
3.1.1
Man power (Operators)31
3.1.2
Supervisors32
3.1.3
Production team33
3.1.4
Management34
3.2
Machine efficiency34
3.3
Other factors35
Chapter 4 REAL TIME PRODUCTION MONITORING SYSTEM
4.1
The elements of a Real Time Production Monitoring37
System
4.2
Control unit39
4.2.1
Primary control unit39
4.2.2
Secondary control unit41
4.3
Input devices42
4.4
Output devices43
4.4.1
Production and non production time display43
board
4.5
Programming the control unit of the real time46
production monitoring system
4.5.1
The program of SR PLC46
4.5.2
Program design of OMRON PLC49
4.6
Hardware connection of the real time production50
monitoring system
CHAPTER TITLE PAGE
Chapter 5 MEASUREMENTS AND RESULTS
5.1
Measurements52
5.2
Process flow of the real time production monitoring53
system
5.3
Production information from company B56
5.3.1
Data on machineries57
5.3.2
Data on man power59
5.3.3
Data on the supporting departments60
5.3.4
Data on the production output61
5.3.5
Data on the operation time62
5.3.6
Data on the rejection rate63
5.3.7
Data on bottle neck64
5.4
Analysis of data by using a PMS64
5.5
Analysis of data without using a PMS65
Chapter 6 SUGGESTION FOR FUTURE WORK AND
CONCLUSION
6.1
Suggestion for future works68
6.1.1
Automated of production data68
6.1.2
Multiple work cell communication using70
wireless networking
6.1.3
Integrated calling unit via short messaging71
system (SMS) and email
6.2
Conclusion73
REFERENCES
75
CHAPTER TITLE PAGE
Appendix A PROGRAM OF THE CONTROL UNIT
A.I Design of the SR program 79
A. I.I Reset function 80
A.1 .2 Normal production schedule 81 A.1.3 Public holiday schedule 81 A.2 Design of the OMRON PLC program 82
Appendix B ACKNOWLEDGEMENT
B.l Letter on problems faced by company B 87
CHAPTER FIGURE Chapter 1 Chapter 2 1.1 1.2 1.3 1.4 1.5 1.6 1.7 1.8 1.9 1.10 2.1
2.2
2.3 2.42.5
2.6 2 .7 2.82.9
2.10LIST OF FIGURES
DESCRIPTION
Automated production lines
Semi automated production lines
Manual/work bench production lines
Factors affecting production lines
Industrial Andon lights
Production counters
Rejection and production status counters
Production status indication board
PLC control software
Block diagram of the real time production
monitoring system
Production life cycle on the concept of Jidoka
The interaction of Andon system
The basic math's of OEE
Breakdown structure of production duration
Breakdown structure of production duration
Breakdown structure of availability
Breakdown structure of performance
Breakdown structure of quality
The elements ofOEE
Screen shot of Root Cause Analysis software
[image:13.532.35.464.49.777.2]CHAPTER FIGURE DESCRIPTION Chapter 3 Chapter 4 Chapter 5 2.11 3.1 3.2 4.1 4.2 4.3 4.4 4.5 4.6 4.7 4.8 4.9 5.1 5.2
5.3
Screen shot of Fault Tree Analysis software
The process cycle to problem solve faults at work stations using the real time production monitoring system
Process flow of the real time production monitoring system
Prototype of the production monitoring system Block diagram of the real time production monitoring system
Super relay model SR-22MRDC The OMRON CQM1H-CPU21 PLC
Block diagram of the production time display board
Block diagram of the non-production time display board
The schematic of a 3 digit multiplexed up counter circuit
Flow chart of the SR PLC program design Flow chart of the OMRON PLC program design
Process flow of the real time production monitoring system
Overall efficiency of machine (test bed) courtesy of company B
Pie chart for the man power performance courtesy of company B
[image:14.532.44.453.58.762.2]CHAPTER FIGURE DESCRIPTION PAGE
Chapter 6
Appendix A
Appendix B
5.4 Performance of the supporting departments 60
courtesy of company B
5.5
5.6
Actual production output over the targeted
output courtesy of company B
Actual production output over the targeted
output courtesy of company B
61
62
5.7 Total parts over the rej ect parts courtesy of 63
company B 6.1
6.2
6.3 A.I A.2 A.3 A.4A.5
B.1 B.2Block diagram of the real time production
monitoring system linked to a computer
Block diagram of the PMS linked to a computer
using wireless networking
Block diagram of the real time production
monitoring system linked to a GSM modem
The SR output connection to the secondary
control unit
The Reset program of the SR
The normal operation scheduled program of the SR
The public holiday scheduled program of the
SR
The program for OMRON PLC
Letter on problem statement courtesy of
company B
Letter of support on the research done
[image:15.534.32.452.63.785.2]CHAPTER
Chapter 2
Chapter 4
Chapter 5
LIST OF TABLES
TABLE DESCRIPTION
2.1 World class standards for each OEE factor 2.2 4.1 4.2 4.3 4.4 5.1
5.2
5.3
5.4 5.5Six major losses of OEE
The source of input for the real time production monitoring system
Reset schedule from company B Weekly operation schedule from company B
Weekend and public holiday operation schedule from company B
Input source for the real time production monitoring system for testing
Input source for the real time production monitoring system for testing
General production data courtesy of company B
General production calculation of company B
Data on machine overall efficiency courtesy of company B
[image:16.529.35.448.85.754.2]CHAPTER Appendix A TABLE 5.6
5.7
5.8 5.9 5.10 5.11 5.12 5.13 5.14 A.I DESCRIPTIONData on machine overall efficiency by factors courtesy of company B
Data on man power performance courtesy of company B
Performance of the supporting department courtesy of company B
Production output courtesy of company B Operating time courtesy of company B Rejection rate courtesy of company B Data on actual output performance courtesy of company B
Production data courtesy of company B Comparison on data collected from company B and PMS
Input source for the SR
[image:17.532.33.447.48.780.2]SHORT FORM PMS PLC OEE TQM PPC TPM RCA FTA SR LCD LED PCB CMOS IC BCD VDC VAC SOP
LAN
WiFi SMS ZLSRLIST OF ABBREVIATION
DESCRIPTION
Production Monitoring System Programmable Logic Control Overall Equipment Effectiveness Total Quality Management Production Planning and Control Total Productive Maintenance Root Cause Analysis
Fault Tree Analysis Super relay
Liquid crystal display Light emitting diode Printed circuit board
Complementary metal-oxide semiconductor Integrated circuit
Binary coded decimal Direct current (voltage) Alternative current (voltage) Standard operating procedure Local area network
Wireless fidelity
Short messaging system Zelio logic super relay
SHORT FORM
GSM PCU
scu
DESCRIPTION
Globe system for mobile Primary control unit Secondary control unit
CHAPTER I
INTRODUCTION
Production line inefficiencies are the main factors that contribute to less yield and hence less profit to any industry. The aim of this study is to design a real time production monitoring system for use on these production lines. Such a monitoring system will be used to automatically gather production line data and distribute/send it to the industry management or anyone on the shop floor for instant action (Kumar et. al., 2007b). The availability of these data can help the industry in improving their production yield and hence profit.
1.1 The production line
A production line is a set of sequential operations established on a factory shop floor whereby materials are put through a refining process to produce an end product that is suitable for onward consumption or components are assembled to make finished goods. In general a production process involves a moving platform or conveyor to move partially completed products to workers who perform simple repetitive tasks designed to permit very high rates of production per worker.
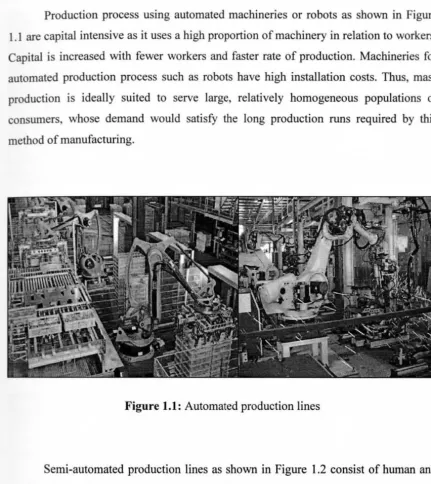
Production process using automated machineries or robots as shown in Figure 1. 1 are capital intensive as it uses a high proportion of machinery in relation to workers. Capital is increased with fewer workers and faster rate of production. Machineries for automated production process such as robots have high installation costs. Thus, mass production is ideally suited to serve large, relatively homogeneous populations of consumers, whose demand would satisfy the long production runs required by this method of manufacturing.
Figure 1.1: Automated production lines
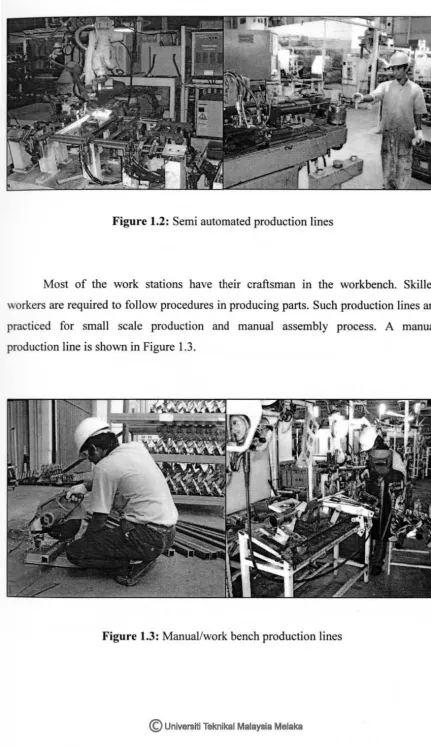
Semi-automated production lines as shown in Figure 1.2 consist of human and machineries working together to accomplish certain task. Such production lines are practiced for moderate production output. The production process involves repetitive task for both the humans and machineries to establish products within definite standards.
[image:21.512.30.462.45.529.2]Figure 1.2: Semi automated production lines
[image:22.514.31.463.39.787.2]Most of the work stations have their craftsman in the workbench. Skilled workers are required to follow procedures in producing parts. Such production lines are practiced for small scale production and manual assembly process. A manual production line is shown in Figure 1.3.
Figure 1.3: Manual/work bench production lines
1.2 Factors contributing to inefficiency of production lines
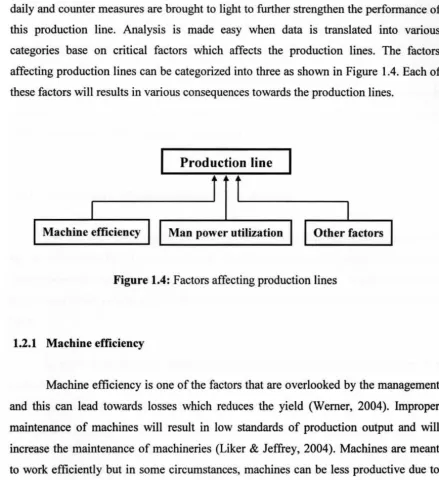
Analysis are carried out by the management on production line problems almost daily and counter measures are brought to light to further strengthen the performance of this production line. Analysis is made easy when data is translated into various categories base on critical factors which affects the production lines. The factors affecting production lines can be categorized into three as shown in Figure 1.4. Each of these factors will results in various consequences towards the production lines.
Production line
[image:23.512.27.467.113.594.2]Machine efficiency Man power utilization Other factors
Figure 1.4: Factors affecting production lines
1.2.1 Machine efficiency
Machine efficiency is one of the factors that are overlooked by the management and this can lead towards losses which reduces the yield (Werner, 2004). Improper maintenance of machines will result in low standards of production output and will increase the maintenance of machineries (Liker & Jeffrey, 2004). Machines are meant to work efficiently but in some circumstances, machines can be less productive due to improper preventive maintenance. Preventive maintenance is a key factor which keeps the machine running efficiently. The maintenance activity on machineries needs extra attention by the management to ensure the optimum usage of machineries and to eliminate unwanted wastages due to machine stoppages.