DESIGN AND DEVELOPMENT OF REAL TIME POWER QUALITY MONITORING SYSTEM
NOOR ATHIRA BINTI ABIDULLAH
A report submitted in partial fulfillment of the requirements for the degree of Bachelor in Electrical Engineering ( Industrial Power )
Faculty of Electrical Engineering
UNIVERSITI TEKNIKAL MALAYSIA MELAKA
“I hereby declare that I have read through this report entitle “Design and Development of Real Time Power Quality Monitoring System” and found that it has comply the partial fulfilment for awarding the degree of Bachelor of Electrical Engineering (Industrial Power)”.
Signature : ………..
“I declare that this report entitle “Design and Development of Real Time Power Quality Monitoring System” is the result of my own research except as cited in the references. The report has not been accepted for any degree and is not concurrently submitted in
candidature of any other degree”.
Signature : ………..
ACKNOWLEDGEMENT
In the name of Allah, the Most Gracious and the Most Merciful.
Alhamdulillah, all praises to Allah for the strengths and His blessing in completing this thesis. During the course of my thesis work, there were many people who were instrumental forwards my accomplishing the task before me. Without their guidance, help and patience, I would have never been able to accomplish the work of my final year project. I would like to take this opportunity to acknowledge some of them.
Special appreciation goes to my supervisor, Dr Abdul Rahim bin Abdullah, for his supervision and constant support. His invaluable help of constructive comments and suggestions throughout the experimental and thesis works have contributed to the success of this project.
I would like to express my appreciation to all lecturers at the Faculty of Electrical Engineering for their guidance to help me to make the project successful. My acknowledgement also goes to all the technicians and office staffs for their co-operations.
ABSTRACT
ABSTRAK
TABLE OF CONTENT
CHAPTER TITLE PAGE
ACKNOWLEDGEMENT i
ABSTRACT ii
ABSTRAK iii
TABLE OF CONTENT iv
LIST OF TABLES viii
LIST OF FIGURES ix
LIST OF APPENDICES xii
1 INTRODUCTION 1
1.1 Project Background 1
1.2 Problem Statement 2
1.3 Project Objectives 3
1.4 Project Scopes 4
2 LITERATURE REVIEW 5
2.1 Introduction 5
2.2 Power Quality 5
2.3 Power Quality Events 7
2.3.1 Transients 8
2.3.1.1 Impulsive Transient 9
2.3.1.2 Oscillatory Transient 9
2.3.2.1 Harmonics 10
2.3.2.2 Notching 11
2.3.2.3 Noise 12
2.3.3 Short Duration Voltage Variations 13
2.3.3.1 Voltage Sags ( dips ) 13
2.3.3.2 Voltage Swells (surges) 14
2.3.4 Long Duration Voltage Variation 15
2.3.4.1 Over Voltage 15
2.3.4.2 Under Voltage 16
2.3.5 Interruptions 16
2.3.5.1 Momentary Interruption 17
2.3.5.2 Temporary Interruption 17
2.3.5.3 Long Term Interruption 17
2.4 Power Quality Monitoring System 18
2.5 Microsoft Visual Basic 2006 22
2.6 Data Acquisition Card 23
3 METHODOLOGY 25
3.1 Introduction 25
3.2 Project Development 25
3.2.1 Hardware Development 29
3.2.2 Software Development 31
3.3 Power Signal Measurements 35
3.3.1 Voltage Measurement 35
3.3.2 Current Measurement 36
3.3.3 Real Power 37
3.3.4 Reactive Power 38
3.3.5 Apparent Power 38
3.3.6 Power Factor 38
3.3.7 Fourier Transform 39
3.3.8 Frequency Measurement 39
4 RESULT, DISCUSSION AND ANALYSIS 41
4.1 Introduction 41
4.2 Power Quality Signals Classification 45
4.2.1 Normal Signal 45
4.2.2 Voltage Sags (dips) 46
4.2.3 Voltage Swells (surges) 47
4.2.4 Over Voltage 48
4.2.5 Under Voltage 49
4.2.6 Interruptions 50
4.3 Results from System 51
4.3.1 Normal Voltage 51
4.3.2 Voltage Sags 53
4.3.3 Voltage Swells 54
4.3.4 Over Voltage 56
4.3.5 Under Voltage 57
4.3.6 Interruptions 59
4.4 Performance Analysis of the System 60
5 CONCLUSION AND RECOMMENDATION 69
5.1 Introduction 69
5.2 Conclusions 70
5.3 Recommendations 70
REFERENCES 72
LIST OF TABLES
TABLE TITLE PAGE
2.1 Categories and Typical Characteristics of Power System
Electromagnetic Phenomena 6
LIST OF FIGURES
FIGURE TITLE PAGE
1.0 Block diagram of the project 4
2.1 Impulsive Transient 9
2.2 Oscillatory Transient 10
2.3 Harmonics 11
2.4 Root Cause of Harmonics Problem 11
2.5 Notching 12
2.6 Noise 12
2.7 Root Cause of Noise Problem 13
2.8 Voltage Sags (dips) 14
2.9 Root Cause of Voltage Sag 14
2.10 Voltage Swells (surges) 15
2.11 Over voltage 16
2.13 (a) Momentary Interruption, (b) Temporary Interruption,
(c) Long-term Interruption 18
2.14 NI USB-6008/6009 Pinout 24
3.1 Flowchart of Project Methodology 27
3.2 Block Diagram of Real Time Power Quality Monitoring System 28
3.3 Flowchart of Hardware Development 29
3.4 Flowchart of Software Development 31
3.5 Main Form of the Monitoring System Software 32
3.6 Sub Main Form of the Monitoring System Software 33
3.7 Block Diagram of Interface Development 34
3.8 Example of data has been stored in notepad 35
3.9 Voltage Transducer 36
3.10 Current Transducer 37
3.11 Signal in time domain and frequency domain 40
4.1 Real Time Power Quality Monitoring System 42
4.2 Main form display on computer 42
4.3 Signal calculation 43
4.4 Signal Graph form display on computer 43
Normal Signal 45 4.7 (a) Voltage Sags Waveform (b) Power Spectrum of Voltage Sags 46 4.8 (a) Voltage Swells Waveform (b) Power Spectrum of Voltage Swells 47 4.9 (a) Overvoltage Waveform (b) Power Spectrum of Overvoltage 48 4.10 (a) Under voltage Waveform (b) Power Spectrum of Under voltage 49 4.11 (a) Interruption Waveform (b) Power Spectrum of Interruption 50 4.12 Normal Voltage Waveform and Power Spectrum of Normal Voltage 51
4.13 Classification of Normal Voltage 52
4.14 Voltage Sags Waveform and Power Spectrum of Voltage Sags 53
4.15 Classification of Voltage Sags 53
4.16 Voltage Swells Waveform and Power Spectrum of Voltage Swells 54
4.17 Classification of Voltage Swells 55
4.18 Over Voltage Waveform and Power Spectrum of Over Voltage 56
4.19 Classification of Over Voltage 56
4.20 Under Voltage Waveform and Power Spectrum of Under Voltage 57
4.21 Classification of Under Voltage 58
4.22 Interruption Waveform and Power Spectrum of Interruption 59
4.23 Classification of Interruption 59
4.24 Comparison voltage and current between PQMS and PQA 60
4.25 Voltage and Current Verification 63
PQM and PQA 64
LIST OF APPENDICES
APPENDIX TITLE PAGE
A Visual Basic Program 74
B Testing 88
C Milestones 90
D Gantt Chart 92
CHAPTER 1
INTRODUCTION
1.1 Project Background
The rapidly growing use of electrical equipment in our technologies is the biggest contributor to power quality problem. The electrical power quality of power system has become an important issue and heightened of awareness of power quality among the electricity users [1]. The ability to maintain voltage and current signals with constant amplitude and constant fundamental frequency presents the quality of electrical power supplied to the customers [2]. The small interruption of power quality event can cause equipment failure and economical loss. The power quality events are voltage swell, voltage sag, under voltage, over voltage, interruption, harmonic, interharmonics, transient and notching [3].
The parameters of the power quality are characterized by voltage signal in RMS value (voltage and current), frequency, real power, reactive power, apparent power and power factor. The classification analysis is developed using based expert system in Visual Basic 2006. On the other side, this monitoring system proof that the quality of the offered power is within the pre-specified standards and analysis and record the data or information for solving problems. Existing power quality monitoring needs improvement on their capability, efficiently, reliability and accuracy [2].
This project presents a design and development of real time power quality monitoring system. The system can monitor record and analyze the data from power line. All the parameters that can be measured are voltage (rms), current (rms), frequency, real power, reactive power, apparent power and power factor. The data will be recorded and stored efficiently. As results, the performances of the power line system can be monitored and analyzed.
1.1 Problem Statements
With the increase of loads sensitive to power disturbances and the drive to gain profits, power quality has become a great concern. Sophisticated electronics devices are being rapidly introduced into the market such as computers, telecommunications and electronic process controls. All of these modern technologies require stable power supply in order to achieve optimum reliability, compared to the oldest equipments. Any slight disruptions in a power line can cause losses up to millions in an operating factory.
The power quality events will affect many industries that can interrupt manufacturing process, failure of equipment and economic losses. Before this, the user only use the electricity but unknown of voltage and current that insert to the loads. The measurements are taken by multimeter and the reading is taken manually. This will cause an error when taking the readings. Other than that, the equipments in market nowadays can only capture and print the data. In addition, the data cannot be monitor and stored efficiently. Then, the user can not check the performance of the power line system. The developments that have been used today are not user friendly and costly.
1.2 Project Objectives
The objectives of the project are:
1. To develop user friendly real time power quality monitoring system that can measure and display power line parameters such as voltage (V), current (I), frequency (f), real power (P), apparent power (S) and power factor (pf) on the computer in real time.
2. To classify power quality signals such as normal, swell, sag, interruption, under voltage and over voltage. The signals are classified based on IEEE standard 1159-2009.
1.3 Project Scopes
This project is developed using NI USB 6009 DAQ Card and Visual Basic 6.0 program on computer. The scopes consists of:
1. This system utilize the Microsoft Visual Basic 2006 software and NI USB-6009 Data Acquisition Card ( DAQ card).
2. This project can measure voltage (rms), current (rms), frequency, real power, reactive power, apparent power and power factor.
3. This system only classify 6 types of power quality signals which are normal, swell, sag, interruption, over voltage and under voltage based IEEE 1159-2009.
4. Voltage and current signals are measured between 0 to 300 Vrms and 0 to 100 Ampere for single phase power line.
Due to time limitations, the scope of this project does not include measuring the voltages and current in a three phases and high power line.
CHAPTER 2
LITERATURE REVIEW
2.1 Introduction
Literature review is a body of text that aims to review the idea and understanding about real time power quality monitoring system. This chapter describes the power quality events, power quality measurement and power quality monitoring.
2.2 Power Quality
Commission (IEC), electromagnetic phenomena are classified into several groups as shown in Table 2.1.
Table 2.1: Categories and Typical Characteristics of Power System Electromagnetic Phenomena
current waveforms identification [5]. Classification of power quality events, existing problem solving and future problem anticipation can be detected with the monitoring system. Other than that, conversion of analog voltages and currents in the power system to sampled digital values can be processed automatically using power quality monitoring. Once quality events are detected, they are classified into known waveforms for data recording and analysis. The result of the data recording and analysis can assist in determining the causes as well as solutions to mitigate these disturbances.
2.3 Power Quality Events
There are several common power quality events in power line system. It is normally divided into 5 categories. They are [15]:
i. Transients
ii. Waveform Distortions
iii. Short Duration Voltage Variations iv. Long Duration Voltage Variations
Table 2.2: Categories and Typical Characteristics of Power Quality Signal
2.3.1 Transients
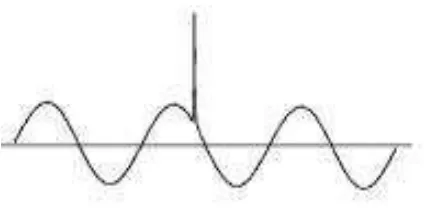
another. Generally, transients can be classified into two categories, which are impulsive transient and oscillatory transient.
2.3.1.1 Impulsive Transient
[image:24.595.198.410.440.545.2]Impulsive transient means a sudden and short duration disturbance by a very rapid change in the steady-state condition of voltage, current, or both, that is unidirectional in polarity either positive or negative. The most common cause of impulsive transients is lightning. Peak currents from lightning strikes can exceed 200kA with 10/350 μsec duration. The frequency range is more than 5kHz considered in the high frequency category. The duration of impulsive transient is from 30-200μsec, and generally occurs along utility lines. The occurrence of an impulsive transient can lead to transformer failures, arrester failures and damages to customer equipments. Figure 2.1 shows waveform of impulsive transient.