Jurnal Ekonomi Pembangunan
Volume 11, Nomor 2,Desember 2010, hlm.149-159
THE RELATIONSHIP BETWEEN ECONOMIC GROWTH AND
GOVERNMENT
SPENDING: A CASE STUDY OF OIC COUNTRIES
Heri Sudarsono
Fakultas Ekonomi Universitas Islam Indonesia Jalan Condongcatur Lingkar Utara Yogyakarta Indonesia
E-mail: [email protected]
Diterima 20 Oktober 2010 /Disetujui 5 Nopember 2010
Abstract: This paper presents the results for testing for causal relationship between economic growth and goverment spending for OIC countries covering the time series data 1970~2006. There are usually two propositions regarding the relation between economic growth and government spending: Wagner’s Law states that as GDP grows, the public sector tends to grow; and the Keynesian framework postulates that public expenditure causes GDP to grow. The primary strength and originality of this paper is that we used aggregate data as well as disaggregate data for Granger causality test. By testing for causality between economic growth and government spending, we find that government spending does cause economic growth in Iran, Nigeria and Tunisia, which are compatible with Keynesian’s theory. However, the economic growth does cause the increase in goverment spending in Algeria, Burkina Faso, Benin, Indonesia, Libya Malaysia, Marocco, and Saudi, which are well-suited with Wagner’s law.
Keywords: granger test, government spending, Wagner’s law, Keynesian
Abstrak: Makalah ini menyajikan hasil pengujian hubungan kausal antara pertumbuhan ekonomi dan pengeluaran pemerintah bagi negara-negara OKI dengan data time series 1970 ~ 2006. Biasanya ada dua dalil/proposisi mengenai hubungan antara pertumbuhan ekonomi dan pengeluaran pemerintah yaitu pertama Hukum Wagner yang menyatakan bahwa pada waktu Produk Domestik Bruto tumbuh, sektor publik cenderung untuk tumbuh, dan kedua kerangka Keynesian mendalilkan bahwa pengeluaran publik menyebabkan Produk Domestik Bruto tumbuh. Kekuatan utama makalah in adalah peneliti menggunakan data agregat dan disagre-gat untuk pengujian kausalitas Granger. Pengujian kausalitas antara pertumbuhan ekonomi dan pengeluaran pemerintah menemukan bahwa pengeluaran pemerintah menyebabkan per-tumbuhan ekonomi terjadi di negara-negara; Iran, Nigeria, dan Tunisia dan ini sesuai de-ngan teori Keynesian. Sedangkan pertumbuhan ekonomi menyebabkan kenaikan pengeluaran pemerintah terjadi di negara-negara; Aljazair, Burkina Faso, Benin, Indonesia, Libya Malay-sia, Maroko, dan Saudi, sebagaimana hukum Wagner.
Kata kunci: uji granger, pengeluaran pemerintah, Hukum Wagner, Keynesian
INTRODUCTION
The relationship between economic growth and goverment spending has been a topic for re-search in public finance and macroeconomic modeling (Easterly & Rebelo, 1993; Kolluri, Panik & Wahab, 2000. In public finance the re-search studies have focused on understanding
One set of studies has been directed toward assessing the effect of the general flow of gov-ernment services on private decision making and, more specifically, on the impact of gov-ernment spending on long-run economic growth. Especially, the Keynesian theory sug-gest that government spending accelerate eco-nomic growth. These theoretical models are re-views so as to have an insight into their rele-vance in explaining the impact of fiscal adjust-ment policies on economic growth.
According to the Keynesian model, gov-ernment spending is autonomous and exoge-nous (Branson, 1979; Levacic & Rebmann, 1991). Thus, government spending is identified as a policy tool to influence economic growth and short term output fluctuations. The Keynesian model stated that government spending cuts or the reduction of a fiscal deficit result in a de-cline in aggregate demand an income directly. The further affect aggregate demand through the negative multiplier effect. The results of ef-fect are a decline in economic growth and an increase in unemployment.
The other set of studies has explored the principal cause of growth in the public sector. Wagner’s law is one of the earliest attempts that emphasises economic growth as the funda-mental determinant of public sector growth. Wagner proposed three reasons why the share of government spending would increase in im-portance as an economy grows. First, as indus-trialization progresses public sector activity will substitute for private sector activity because state's administrative and protective functions would increase in importance during the in-dustrialization process. State's role in main-taining law and order as well as its role in ac-tivities related to economic regulation is likely to become more pronounced due to the in-creasing complexity of economic life and ur-banization.
Furthermore, in assumption in Wagner’s work, goverment spending would also increase as a country industrializes because of the high income elasticity of demand for these services. This means that as per capita income increases demand for the services mentioned above, which are usually provided by the government spending increases rapidly, raising the share of
public sector expenditure in GDP. Finally, tech-nological change and growing scale of firms would tend to create monopolies whose effects the state will have to offset. The remainder of the paper is organized as follows; a brief review of the related literature is in section 2. The
methodology is presented in section 3, section 4
describes the dataand empirical results, and conclu-sions are discussed in the final section.
Empirical literature. The Keynesian model’s proposition that government spending affects output growth, empirical studies suggest that the composition of government spending de-termines its impact on economic growth (Kol-luri, Panik & Wahab, 2000). Ansari (1993) in his study of the applicability of Keynesian theory in Canada found an increase in government spending on health was positively associated with GDP growth. Ansari (1993) also observed that payments for government debt were posi-tively related to GDP growth. In another study, Biswal, Dhawan, & Lee (1999) also observed that government debt repayments were associ-ated with an increase in GDP growth.
Despite the evidence highlighted above on the effect of government spending on output growth, government spending may have no effect on output growth. Ansari, Gordon and Akuamoah (1997) found that increase in gov-ernment spending was not associated with out-put growth in Kenya, Ghana, and South Africa, which their study to validate the Keynesian hy-pothesis in those countries. Al-Faris (2002) also presented similar findings in his study of the relationship between government spending and economic growth using a Keynesian model the Gulf countries.
spending has an effect on output growth if the budget constraint is binding (Kweka & Morris-sey, 2000). An increase in government spending when a government faces a soft budget con-straint accelerates inflation and negatively af-fects output growth. Thus, for an increase in public spending to have a positive impact on output growth, the fiscal deficit need to be con-straint and budget concon-straint be binding
Ram (1986) and Grossman (1988) found a positive relationship between government spending and economic growth, despite of the disaggregation of expenditures. Diamond (1989) observed that social expenditure exhib-ited a positive significant impact on growth in the short-run whilst infrastructure expenditure had less influence (albeit positive). In addition, he found that capital expenditure had a nega-tive influence on economic growth. He attrib-uted this negative relationship to a long gesta-tion period and inefficiency associated with these of public funds. Furthermore, Devarajan and Vinaya (1993) found a negative and insig-nificant relationship between productive ex-penditure and economic growth, while Lin (1994) found that nonproductive spending had a negative and insignificant impact on industri-alized countries but a significant positive im-pact for developing countries.
Islam (2001) in his re-examination of Wag-ner’s hypothesis for the USA found that the relative size of government expenditures and real Gross National Product per capita are cointegrated by using Johansen-Juselius’s coin-tegration approach. Moreover, Wagner’s hy-pothesis is strongly supported by the result of Engle-Granger (1987) error correction approach. Singh and Sahni (1984) use the Granger causal-ity test to determine the causalcausal-ity direction between national income and public expendi-tures in India. Data used in the study were an-nual and deflated by using implicit national income deflator. The study finds no causal process confirming the Wagnerian or the oppo-site view
Finally, Abizadeh and Yousefi (1998) use South Korean data to test Wagner's law. They first conduct Granger type causality tests, and then estimate a growth equation and a govern-ment expenditure growth equation by using
annual data for the period of 1961-1992. They exclude government expenditures from the GDP to obtain the private sector GDP, and use this in their tests. After comparing the results from the estimations authors conclude that government expenditures did not contributed to economic growth in Korea.
RESEARCH METHOD
The methodology to be used in this study will be based from Granger causality model (Granger, 1990). This helps in avoiding the problem of omission of variables, which was existent in some earlier studies. These two vari-ables are known in macroeconomics to be im-portant in the determination of both economic growth and government spending. To use the causality test, the variables under consideration are required to be stationary.
The Granger test will be used here because it is a very simple test, which has been widely accepted as a reliable test for causality between two variables. Almost all the studies mentioned in the literature review have used this test and this has shed more light to us on how the test can be used for economies of different sizes and situations. The procedure here is used to detect the causality in the context of both the bivariate
model and multivariate model. The simplest
Granger causality test is:
e
G
b
Y
b
b
Y
tn
i
i t i t n
t i
i t
'
1 ' 2 1 ' 1 '
0
ln
ln
ln
¦
¦
(1)u Y G
Y t
n i
i t i t n
t i
i
t l
'
1 ' 2 1 ' 1 '
0 ln ln
ln D ¦D ¦D
(2)
where ln Yt is the natural logarithm of real per
capita GDP, and ln Gt is the natural logarithm
of government spending. e't and u't are white
noise error terms. The null hypothesis for equa-tion 1 is that ln G does not Granger cause ln Y. This hypothesis would be rejected if the
coeffi-cients of the lagged Gs (summation of b'2i as a
jointly significant. If both of these null hypothe-ses are rejected, then a bi-directional
In the error correction model, the relevant
error-correction terms (ECt-1) are included in
the standard Granger causality procedure after all variables have been made stationary by dif-ferencing, which yields equations 3 and 4.
¦ ' ¦ '
'
n
i
i t i t
n
t i
i
t b b Y b G
Y
1 ' 2 1 '
1 '
0 ln ln
ln
e
EC
b
t t' 1
3 (3)
¦ ' ¦ '
'
n
i
i t i t
n
t i
i
t G Y
G
1 ' 2 1 '
1 '
0 ln ln
ln D D D
u
EC
t t' 1
3
D
(4)where is first difference operator, et and utare
white noise error terms. The independent vari-ables are said to 'cause' the dependent variable if the error correction term (ECt-1) is significant (b3 or ǂ3 are nonzero) or the coefficients of the
lagged independent variables (summation of b2i
in equation 3 or summation of ǂ2i in equation 4)
are jointly significant. However, if the series are not cointegrated, Granger test is carried out without the error correction terms.
RESULTS AND DISCUSSION
We apply the methodology described above to annual data from Algeria. Iran, Jordan, and Syrian over the period 1970-2005 and annual data from Benin, Burkina Faso, Conte Divora, Egypt, Indonesia, Kuwait, Libya, Malaysia, Mo-rocco, Nigeria, Pakistan, Saudi, and Tunisia over the period 1970-2006. The variables used and their definitions are as follows, Y is the economic growth and G is the total government spending.
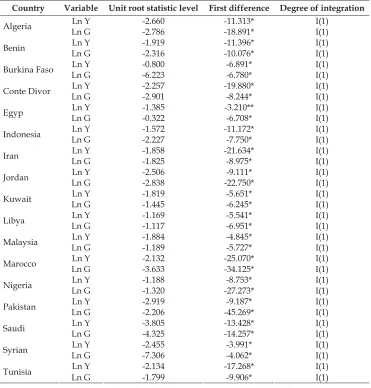
As a preliminary data analysis, all series are first checked for stationary. If the series are nonstationary, standard econometric techniques can lead to misleading results. Both the Phillips-Perron tests for a unit root are performed on each individual series. Table 1 reports the results of the unit-root tests that allow of include in the test use test for unit root in level in first level. The results in Table 1 indicate that all the series are trend stationary.
Before applying the Johansen’s cointegra-tion procedure, it is necessary to determine the lag length of the VAR equation which should be high enough to ensure that the errors are ap-proximately white noise but small enough to allow estimation, In this paper is chosen on the basis ofthe minimum value of Akaike Informa-tion Criterion (AIC).
Since the variables used in all the cases are non-stationary, I(1), we perform a cointegration test to find out whether a linear combination of these series converge to an equilibrium or not. Two series (variables) are said to be cointe-grated if they each are non-stationary, at least I(1), and if their linear combination converges to an equilibrium. (Engle and Granger, 1987) This means that cointegrated variables have a long term equilibrium relationship. Johansen and Juselius’s (1990) cointegration method was used for cointegration analysis. The cointegration and causality tests were carried out only on the first-difference stationary variables, I(1). Johansen and Juselius, procedure test results are presented in Table 2
The test statistics fail to reject the null hy-pothesis of no cointegrating relation at 5 per cent significance level, except in the case of Al-geria, Burkina Faso, Indonesia, Marocco, Nige-ria, and Saudi. This indicates that in Benin, Cot-eDivor, Egypt, Iran, Jordan, Kuwait, Libya, Malaysia, Pakistan, Syrian and Tunisia there is no long run relationship between economic growth and government spending over the sample period. However, the two variables are found to be cointegrated in the case of Algeria, Burkina Faso, Indonesia, Morocco, Nigeria, and Saudi’s data.
In the Table 3 reported that the Granger
Iran, Libya, Malaysia and Tunisia’ data. The hy-pothesis that growth of government spending does not Granger cause growth of economic growth is rejected at 5 per cent significant level.
In the case of Algeria, Burkina Faso, Indo-nesia, Morocco, Nigeria, and Saudi, the two se-ries converge in the long run, that is lnG and lnY are cointegrated, standard Granger causal-ity approach (VAR approach) can not be used to yield approximate result. So, in Appendix 1 reported that we do the Granger test with error correction terms from the cointegrating equa-tions included in a regression that also includes
once differenced variables (Ʀ lnY and ƦlnG).
Results are reported in Algeria, Indonesia, Ni-geria and Saudi are found to be significant at 5 per cent level over the different lag length of 1, 2, 3, 4 years in one side. Furthermore, our find-ing that there is causality link, one-way or two-way, between economic growth and govern-ment spending in Algeria, Benin, Burkina Faso, Iran, Libya, Malaysia, Morocco, Nigeria, Saudi, dan Tunisian. However, the other countries are not causality link, like CoteDivor, Egypt, Jor-dan, Kuwait, Morocco, Pakistan and Syrian.
Table 1. Philip Peron Unit Root Result
Country Variable Unit root statistic level First difference Degree of integration
Ln Y -2.660 -11.313* I(1) Algeria
Ln G -2.786 -18.891* I(1) Ln Y -1.919 -11.396* I(1) Benin
Ln G -2.316 -10.076* I(1) Ln Y -0.800 -6.891* I(1) Burkina Faso
Ln G -6.223 -6.780* I(1) Ln Y -2.257 -19.880* I(1) Conte Divor
Ln G -2.901 -8.244* I(1) Ln Y -1.385 -3.210** I(1) Egyp
Ln G -0.322 -6.708* I(1) Ln Y -1.572 -11.172* I(1) Indonesia
Ln G -2.227 -7.750* I(1) Ln Y -1.858 -21.634* I(1) Iran
Ln G -1.825 -8.975* I(1) Ln Y -2.506 -9.111* I(1) Jordan
Ln G -2.838 -22.750* I(1) Ln Y -1.819 -5.651* I(1) Kuwait
Ln G -1.445 -6.245* I(1) Ln Y -1.169 -5.541* I(1) Libya
Ln G -1.117 -6.951* I(1) Ln Y -1.884 -4.845* I(1) Malaysia
Ln G -1.189 -5.727* I(1) Ln Y -2.132 -25.070* I(1) Marocco
Ln G -3.633 -34.125* I(1) Ln Y -1.188 -8.753* I(1) Nigeria
Ln G -1.320 -27.273* I(1) Ln Y -2.919 -9.187* I(1) Pakistan
Ln G -2.206 -45.269* I(1) Ln Y -3.805 -13.428* I(1) Saudi
Ln G -4.325 -14.257* I(1) Ln Y -2.455 -3.991* I(1) Syrian
Ln G -7.306 -4.062* I(1) Ln Y -2.134 -17.268* I(1) Tunisia
The findings of this study may be inter-preted in several ways. To detect the hypothe-sized causal relationship between national in-come and government spending, rate of increase of the latter must be greater than that of the former, so that the share of government spending in national income increases over time. However, for some reason, if spending
keeps on increasing at a slower pace than the pace national income grows at; hypothesized causal link between the two will be weakened, making it more difficult to detect the link in the data. According to Ansari et al (1997) spending pattern could be smoother because of the debt financing obligations that a government might have.
Table 2. Johansen and Juselius’s Cointegration Test Results
Countries Null Hypothesis Maximal –
eigenvalue statistic
5% critical value
Trace statistic
5% critical value
Burkina Faso (lag 4)
Inability of the government to increase taxes beyond a certain level would also prevent government spending from keeping pace with national income since how much the govern-ment can increase its spending is determined by its revenues. This argument was same with
Peacock and Wiseman (1967), whereas that tax rates are fixed because of political and social forces, and then, the behavior towards tax rates would only change in a severe crisis such as war. In the absence of such a crisis or shock government spending will not increase unless
Table 3. Granger Causality Test Result via VAR
Lag length 1 2 3
Null Hypothesis F-statistic F-Statistic F-Statistic
LnG Benin does not Granger Cause lnY
LnY Benin does not Granger Cause lnG
3.389 (0.074)
5.320
(0.027)**
- -
LnG CoteDivor does not Granger Cause lnY
LnY CoteDivor does not Granger Cause lnG
0.414 (0.524)
1.641 (0.209)
- -
LnG Egypt does not Granger Cause lnY
LnY Egypt does not Granger Cause lnG
2.280 (0.140)
2.646 (0.113)
- -
LnG Iran does not Granger Cause lnY
LnY Iran does not Granger Cause lnG
10.735
(0.002)*
2.560 (0.119)
3.453
(0.045)**
2.592 (0.092)
-
LnG Jordan does not Granger Cause lnY
LnY Jordan does not Granger Cause lnG
2.587 (0.118)
2.193 (0.148)
0.558 (0.578)
0.643 (0.533)
0.695 (0.564)
0.704 (0.558)
LnG Kuwait does not Granger Cause lnY
LnY Kuwait does not Granger Cause lnG
1.127 (0.296)
0.628 (0.433)
- -
LnG Libya does not Granger Cause lnY
LnY Libya does not Granger Cause lnG
0.932 (0.341) 12.448
(0.001)*
- -
LnG Malaysia does not Granger Cause lnY
LnY Malaysia does not Granger Cause lnG
0.896 (0.350)
4.948
(0.033)**
- -
LnG Pakistan does not Granger Cause lnY
LnY Pakistan does not Granger Cause ln G
2.565 (0.119)
2.473 (0.125)
1.463 (0.247)
0.578 (0.567)
0.800 (0.504)
0.382 (0.766)
LnG Syrian does not Granger Cause lnY
LnY Syrian does not Granger Cause lnG
0.736 (0.397)
2.301 (0.139)
- -
LnG Tunisia does not Granger Cause lnY
LnY Tunisia does not Granger Cause lnG
16.254
(0.000)*
7.346
(0.010)**
5.912
(0.007)*
2.911 (0.070)
3.198 (0.039)**
2.878 (0.055)
the demand for public sector services is highly income-elastic.
Another way in which economic growth or industrialization could reduce the rate of increase in tax revenues, thereby making it more difficult to detect a possible link between industrialization and government spending has been noted in Ferris and West (1996). Kau and Rubin (1981) explained that due to economic growth a larger proportion of the labor force in a country might get transferred to less visible earnings and be able to avoid paying taxes. A specific example of a process that would gener-ate such a transfer is urbanization, which in Kau and Rubin's framework is a measure of the larger set of opportunities available to closely located tax payers to avoid formal markets through such activities as barter.
CONCLUSION
This paper presents the results for testing for causal relationship between economic growth and government spending for OIC government covering the time series data from 1970 until 2005 and 2006. There are usually two proposi-tions regarding the relation between economic growth and government spending: Wagner’s Law states that as GDP grows, the public sector tends to grow; and the Keynesian framework postulates that public expenditure causes GDP to grow. The primary strength and originality of this paper is that we used aggregate data as well as disaggregate data for Granger causality test. By testing for causality between economic growth and government spending, we find that government spending does cause economic
growth in Iran, Nigeria and Tunisia, which are
compatible with Keynesian’s theory. However, the economic growth does cause the increase in government spending in Algeria, Burkina Faso, Benin, Indonesia, Libya Malaysia, Morocco, and Saudi are well-suited with Wagner’s law.
Finally, judging from the above mentioned results, in terms of government spending, the causality test suggested that economic growth in OIC countries has more influence on gov-ernment spending than the other way round. In other words, Wagner’s law is generally more
prominent than Keynesian theory in some OIC countries.
REFERENCES
Agell, J., T. Lindh and H. Ohlsson. 1999. Growth and the Public Sector: a Reply,
European Journal of Political Economy, Vol. 15, No.2, pp. 359-366.
Al-Faris, A.F. 2002. Public Expenditure and Economic Growth in the Gulf Coopera-tion Council Countries, Applied Economics, Vol. 34, pp. 1187-1193.
Ansari, M, Gordon, D. V. and Akuamoah, C. 1997. Keynes versus Wagner: Public Ex-penditure and National Income for Three African Countries. Applied Economics, Vol. 29, pp. 543-550.
Ansari, M. 1993. Testing the Relationship be-tween Government Expenditure and Na-tional Income in Canada, Employing Gra-nger Causality and Cointegration Analy-sis, Managerial Finance, Vol. 19, pp. 31-47.
Branson, H. 1979. Macroeconomic Theory and
Policy. New York/London: Harper and Row Publishers.
Devarajan, S. and S. Vinaya. 1993. What do Governments Buy? The Composition of Public Spending and Economic
Perform-ance, Policy Research Working Paper, The
WorldBank, WPS 1082.
Diamond, J. 1989. Government Expenditure and Economic Growth: An Empirical
Investi-gation. IMF Working Paper No. 89/45,
Washington D.C.
Ferris J.S. and West, E. 1996. Testing Theories of Real Government Size: US Experience 1959-1989, Southern Economic Journal, Vol. 62, pp. 537-553.
Granger, C.W.J. 1990. Introduction in Granger,
C.W.J (ed) Modeling Economic Series:
Ad-vanced Texts in Econometrics, Oxford Uni-versity Press.
Eco-nomic Growth. A Non- Linear Relation-ship. Public Choice, Vol. 56, pp. 193-200. Islam, Anisul, M. 2001. Wagner’s Law
Revis-ited: Cointegration and Exogeneity Tests
for the USA. Applied Economics Letters,
Vol. 8, pp. 509-515.
Kau J.B. and P.H. Rubin. 1981. The Size of
Gov-ernment. Public Choice, Vol. 37, pp.
261-274.
Kolluri, B. R., Panik, M. J. and Wahab, M. S. 2000. Government Expenditure and Eco-nomic Growth: Evidence from G7 Coun-tries. Applied Economics, Vol. 32, pp. 1059-1068.
Kweka, J. and O. Morrissey. 2000. Government Spending and Economic Growth in Tan-zania, 1965-1996. University of
Notting-ham, CREDIT Research Paper 00/06.
Levacic, R.and Rebmann, A. 1991.
Macroecono-mics. An Introduction to Keynesian-Neoclas-sical Controversies. Second Edition. Lon-don: Macmillan.
Peacock, A.T. and Wiseman, J. 1961. the Growth
of Public Expenditure in the United Kingdom,
Princeton: Princeton University Press
Phillips, P.C.B., and P. Perron. 1988. Testing for a Unit Root in Time Series Regression.
Biometrica, Vol. 75, pp. 335-46.
Ram. 1986. Government size and Economic Growth: A New Framework and Some Empirical Evidence from Cross-Sectional
and Time Series Data. American Economic
Review, Vol 76, No.1, pp 191-203.
Singh, B. and Sahni, B. S. 1984. Causality be-tween Public Expenditure and National
Income. the Review of Economics and
Appendix 1. Granger Causality Test Results via Error Correction Model (ECM)
Country Algeria Burkina Faso Indonesia Marocco Nigeria Saudi
CointEq CointEq1 CointEq1 CointEq1 CointEq1 CointEq1 CointEq1
Ln Y F-statistic
0.377
Notes: Standard for error in (.) and t-statistic in [.] and * and ** denotes 1% and 5% siqnificant level
Appendix 2. Plots of Series of Economic Growth (Y) and Goverment Spending (G)
0
1975 1980 1985 1990 1995 2000 2005 LOG(G_ALGERIA) LOG(GS_ALGERIA)
1975 1980 1985 1990 1995 2000 2005 LOG(Y_BENIN) LOG(G_BENIN)
6 7 8 9 10 11 12 13 14
1975 1980 1985 1990 1995 2000 2005 LOG(Y_COTEIVOR) LOG(G_COTEIVOR)
6 7 8 9 10 11 12 13 14
1975 1980 1985 1990 1995 2000 2005 LOG(Y_EGYPT) LOG(G_EGYPT)
4 6 8 10 12 14 16
1975 1980 1985 1990 1995 2000 2005 LOG(Y_INDONESIA) LOG(G_INDONESIA)
7 8 9 10 11 12 13 14 15
1975 1980 1985 1990 1995 2000 2005 LOG(Y_IRAN) LOG(G_IRAN)
4 5 6 7 8 9 10 11 12 13
1975 1980 1985 1990 1995 2000 2005 LOG(Y_JORDAN) LOG(G_JORDAN)
4 6 8 10 12 14
1975 1980 1985 1990 1995 2000 2005 LOG(Y_KUWAIT) LOG(G_KUWAIT)
5 6 7 8 9 10 11 12 13 14
1975 1980 1985 1990 1995 2000 2005
LOG(Y_LIBYA) LOG(G_LIBYA)
7 8 9 10 11 12 13 14
1975 1980 1985 1990 1995 2000 2005 LOG(Y_MALAYSIA) LOG(G_MALAYSIA)
2 3 4 5 6 7 8 9 10 11
1975 1980 1985 1990 1995 2000 2005 LOG(Y_MAROCCO) LOG(G_MAROCCO)
0 2 4 6 8 10 12 14
1975 1980 1985 1990 1995 2000 2005 LOG(Y_NIGERIA) LOG(G_NIGERIA)
6 7 8 9 10 11 12 13 14
1975 1980 1985 1990 1995 2000 2005 LOG(Y_PAKISTAN) LOG(G_PAKISTAN)
5 6 7 8 9 10 11 12
1975 1980 1985 1990 1995 2000 2005 LOG(Y_SAUDI) LOG(G_SAUDI)
7 8 9 10 11 12 13 14
1975 1980 1985 1990 1995 2000 2005 LOG(Y_SYRIAN) LOG(G_SYRIAN)
5 6 7 8 9 10 11 12 13