Vol. 24 January-June 2011 pp 149-153
* Author for correspondence,
Email: [email protected],[email protected]
§ The paper has been drawn from the second author’s M.V.Sc. thesis entitled “Demand Analysis of Veterinary Services in Sangli District of Maharastra”.
Analysis of Willingness to Pay for Veterinary Services of the
Livestock Owners of Sangli District of Maharastra
§Sanjay Kumar
*, Pallavi P. Mirajkar, Y.P. Singh and R. Singh
Division of Livestock Economics, Statistics & Information Technology, Indian Veterinary Research Institute, Izatnagar – 243 122, Uttar Pradesh
Abstract
The provision of animal health services in India is by and large, under the domain of public sector and many health care activities like quarantine, disease management, quality control, research and extension, etc. are mainly the responsibilities of government. With veterinary services consuming about 60-80 per cent of the budget allocated to the livestock sector, fiscal constraints would lead to a decline in the operational efficiency of the government livestock services. Owing to financial constraints, some of the state governments have evolved specific animal healthcare policies tending to privatization of the system. The entry of private sector into the veterinary health care sector depends on the availability and sustainability of an economically profitable practice. In this paper an attempt has been made to study the willingness of the people to pay for providing the animal health care services. The study is based on the personal and focused group interview of 120 farmers selected randomly from the Sangli district of Maharastra. Contingent valuation (CV) approach has been used to study the farmer’s WTP (willingness to pay) for providing animal health care services at government veterinary centres (in-centre) and at farmers’ door steps (at home). The study has shown that increase of one unit in the income from livestock, the willingness to pay value increases by ` 43.23 for the in-centre services. When the farmer’s locality was away from the public veterinary centre, the WTP value has been found to increase significantly for at home services. The analysis has provided evidence that the livestock owners are willing to pay for the quality veterinary services not only at their door steps but at the veterinary centre also.
Key words: Veterinary services, Livestock health care, Willingness to pay, Animal health services
JEL Classification: Q13, Q12, Q18
Introduction
India has one of the largest animal health infrastructures and technical skills in the world. The provision of animal health service in India is under the domain of public sector and many health care activities like quarantine, disease management, quality control, research and extension, etc. are mainly the
responsibilities of government (Singh et al., 1998). The Indian Government has built up a vast network of physical and human resources to provide these services to million of farmers across the country (Ahuja et. al, 2003). There are 45211 veterinarians and para-veterinarians in the country (OIE, 2010) having the geographical presence of 0.0138 per square kilometre and 1.16 per 10000 Livestock Standard Units (LSU-250 kg livestock standard unit, calculated on the basis of average weights of different species).
consuming about 60-80 per cent of the budget allocated to the livestock support services, fiscal constraints would lead to a decline in operational efficiency of the government-provided livestock services (Prabaharan, 2000). In addition to this, some private agencies, NGOs and co-operatives have started providing some veterinary services on cost recovery basis. National Commission on Agriculture (NCA) has recommended one veterinarian for every 5,000 cattle units to ensure proper animal health care. But, in India, on an average, there is one veterinarian to every 7000 animals and this ratio is also decreasing as the livestock population is increasing . Owing to financial constraints some state governments have evolved particular policies to privatize the animal health care services. The entry of private sector into veterinary services depends on the availability and sustainability of an economically profitable practice.
In this paper, an attempt has been made to find out whether the farmers are willing to avail these services on payment basis. Thus, the maximum value they were willing to pay was elicited for providing these services at the (i) government veterinary centre (in-centre) and (ii) farmers’ door steps (at home).
Methodology
For the present study, the Sangli district of the Maharashtra state was chosen purposively. Three talukas, viz. Palus, Miraj and Islampur out of 9 talukas in the Sangli district were selected randomly. From each selected block, four villages were selected randomly. The list of all farmers in the selected villages having at least one milk animal was prepared and from each village 10 farmers were selected randomly following the simple random sampling method. Thus, a total of 120 respondent households constituted the sample for the study.
Data Collection
The data were collected by both personal interview and focused group discussions methods.
Personal Interview — The data were collected using
the specially designed and pre-tested schedule. Data pertaining to the availability of veterinary services, cost of veterinary service from different service providers, annual income of a respondent and income from livestock sector were collected. Socio-economic data
of the farmers like size and composition of the family, occupation, extent of landholding, category, livestock inventory, experience in animal rearing, etc. were collected. Information regarding type of livestock services most frequently used and cost paid by livestock owner for availing a livestock service was also collected.
Focused Group Discussions — The farmers were
interviewed in groups of 8 for eliciting their response on the maximum amount they were willing to pay. They were informed about the purpose of the discussion and were presented with a hypothetical scenario of provision of veterinary services by the government on user charge basis. They were asked for their response on their willingness to pay (WTP) and through successive bidding the maximum amount of WTP was elicited.
The contingent valuation (CV) approach was used to study the farmer’s maximum WTP for two types of animal health care services: (a) at government veterinary centres (in-centre), and (b) at farmers’ door steps (at home). The farmers were posed with two scenarios for eliciting their WTP as described below.
Introduction to the Scenario
Scenario 1 — There is an offer to provide annual
health care for your animals by providing services at the government veterinary centre. This offer will include all expenses on medicines, service fee, etc. Then they were asked, ‘What is the maximum amount of money you would be willing to pay for this offer?’
Scenario 2 — There is an offer to provide annual
health care for your animals by providing services at your farm. This offer will include all expenses on medicines, service fee, etc. Then they were asked, ‘What is the maximum amount of money you would be willing to pay for this offer?’
Those who said ‘Yes’ to the start-ing bid, were then asked about a higher bid and those who said ‘No’ or ‘Don’t know’, were provided with a lower bid and were asked the same question again. After this second bid, the respondents were asked for their maximum willingness to pay as an open-ended question.
Model for Willingness to Pay
Attempt was made to measure the consumer surplus attached to the purchase of veterinary services, with the expectation that this would lead to an increase in income from the livestock through a reduction in losses due to the livestock diseases. As the study was about the purchase of new veterinary services as a package, it could be assumed that current utility was held constant. Therefore, the focus was on using compensating, rather than equivalent, variations (Johannesson and Jonsson, 1991; Olsen, 1997) and so questions concerning WTP were framed in terms of WTP for an increase of the good.
It is important to know which variables affect the stated WTP for veterinary services because this could help in assessing the factors that may encourage people to buy veterinary services and at what price. Both have potential policy relevance, it is important to know which variables for example, would be under the control of policy-makers other than just prices, so that the level of demand can be influenced at all prices. As the main aim of economic models of demand is to explain the quantity demanded of a good in terms of economic variables, we needed to consider the following: the price of the good as well as the price and use of complements and substitutes for veterinary services provided by different service providers and income and assets (e.g. ownership of land). In the case of veterinary services provided by the government at a price, the distinction between complements and substitutes is not always clear. For example, other service providers could be considered as substitutes but can be used in conjunction with the veterinary services provided by the government on charge basis.
The WTP values estimated in this study were for hypothetically providing total annual animal health care for their animals at either the veterinary centre or farmer’s doorstep. The WTP was assumed to be a function of a respondent’s attributes and a random component that caused the WTP value to vary across respondents, even if they possessed same attributes. Hence, Cameron and Huppert (1989) suggested that there could be some bias and that its sign would be indeterminate in OLS, while the Maximum Likelihood Interval technique could be unambiguously more reliable if used on interval midpoints. Kolmogorov-Smirnov test also confirmed the normal distribution in random component assumed in the payment card estimation
model study. Therefore, the interval model maximizes the likelihood of an individual’s WTP that lies between the amounts chosen on the payment card, WTP1 and the next larger amount, WTP2. The probability that WTP1 lies between WTP1i and WTP2i is given by Morey et al. (1997) as below:
= ϕ [WTP2i – E (WTPi)/σi] – ϕ [WTP1i – E (WTPi)/
σi]
Prob (WTP1i ≤ WTPi ≤ WTP2i) =
Prob (WTPi < WTP2i) – Prob (WTPi > WTP1i)
where, ϕ is the standard normal cumulative density function.
Then, the expectation of the individual’s WTP, E (WTPi) is:
(WTPi) = E (WTPi) + ξ
= α+β1X1+ β2X2+ β3X3+ β4X4+ β5X5+ β6X6+ β7X7+ ei
where,
WTP = Willingness to pay
α = Constant
βi = Coefficient of respective independent
variables
ei = Random error-term which is normally
independently distributed with the mean zero and constant variance (σµ2).
X1 = Education level
X2 = Annual income of respondents from all
sources
X3 = Annual income of respondents from livestock
enterprise
X4 = Annual expenditure for availing veterinary
service
X5 = Average distance of veterinary clinic from
respondents home and
X6 = Total daily household milk production, and
X7 = Standard livestock unit owned by
respondents.
Results and Discussion
and 21 per cent said they would not be willing to buy. The main reasons put forth by the respondents for unwilling to pay were: (i) no felt need, (ii) no money, (iii) the belief that government should provide the improved health package to their livestock, etc. During the bidding process it was observed that higher the starting bid, the lower was the number of people who said they were willing to buy and vice versa, and that this pattern continued in the follow-up bids also .
In-centre Services
The interval regression model fitted to explain the variation in the stated true maximum WTP values for annual health care services to the livestock owned by the respondents at the veterinary centre generated a log likelihood of –1023.16 (Table 1).
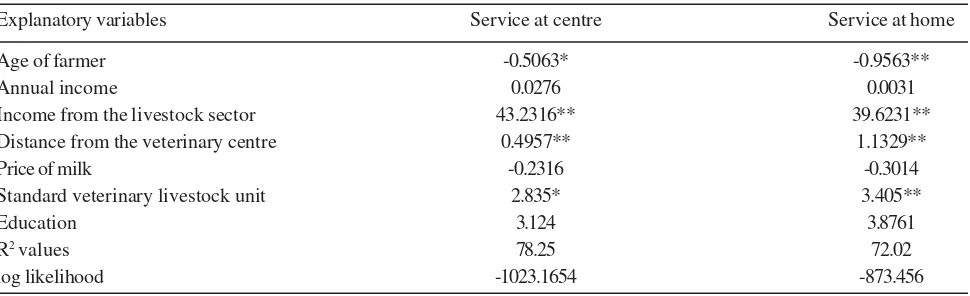
Of the factors fitted to explain the WTP values for in-centre services, age of respondent, share of livestock in annual income, standard livestock units owned, and distance from the nearest public veterinary centre were found to be significantly influencing the stated WTP value. Kathiravan et al. (2007) have also reported the same factors as significant for veterinary services for goat and sheep. The results indicated that the age of respondent had a significant and negative effect on the stated WTP value, and as the age advanced by one year, the stated WTP value was found to be decreased by ` 0.50. The share of livestock in the annual income, which was calculated as the proportion of income from the livestock to total annual income, had a significant positive influence on the stated true maximum WTP value for extending in--centre annual health care services for the livestock. The results showed that as
the proportion of income from the livestock increased by one unit, the willingness to pay value increased by
` 43.23. This in turn exhibited the importance attached to the livestock by the farmers. However, an increase in the veterinary livestock units owned by a farmer would significantly reduce the stated WTP value by
` 2.83. Notably, even when a farmer’s locality was away from the public veterinary centre, the WTP value was found to increase for such offer. That is, an every additional kilometre travel to reach the centre would also increase the stated true WTP amount by
` 0.49. This was possible because, on most of the occasions, the animals were brought to the centre by vehicles which, in rum, took only a minimal distance to reach the centre.
It was observed that the explanatory variables like annual household income, milk yield and education of the respondents had not exerted any significant effect on the stated WTP values for annual health care services.
At Home Services
The results of interval regression analysis indicated that the age of respondent, share of livestock in annual income, standard livestock units owned and distance from the nearest public veterinary centre had significantly predisposed the stated true maximum WTP values for annual health care services at home.
Similar to the in-centre services model, the results of farm home services model indicated that the age of respondent had a significant and negative effect on the stated WTP value, where one year advancement in the age of respondent was found to decrease the stated
Table 1. Factors determining willingness to pay (WTP) for annual livestock health care services at home and at veterinary centre
Explanatory variables Service at centre Service at home
Age of farmer -0.5063* -0.9563**
Annual income 0.0276 0.0031
Income from the livestock sector 43.2316** 39.6231**
Distance from the veterinary centre 0.4957** 1.1329**
Price of milk -0.2316 -0.3014
Standard veterinary livestock unit 2.835* 3.405**
Education 3.124 3.8761
R2 values 78.25 72.02
log likelihood -1023.1654 -873.456
WTP value by ` 0. 95. Moreover, the share of livestock in the annual income, which was calculated as the proportion of income from the livestock to total annual income, had a significant positive influence on the stated true maximum WTP value for extending even for annual health care services. The results showed that as the proportion of income from the livestock increased by one unit, the WTP value increased by
` 39.62. This, in turn, exhibited the importance attached to the livestock. However, an increase in the standard livestock units owned by a farmer would significantly increase the stated WTP value by ` 3.40. Further, when a farmer’s locality was away from the public veterinary centre, the WTP value was also found to increase significantly. That is, every additional kilometre travel to reach the centre would also increase the stated true WTP amount by `.1.13.
Conclusions
The study has concluded that the livestock farmers do accord importance to the veterinary services for a better productivity of their animals. Farmers have been found willing to pay for veterinary services both at the veterinary centre and at home, indicating that they have enough surpluses out of the livestock enterprises which they want to plough back by availing quality veterinary services on payment basis. The willingness to pay for the veterinary services has been found to depend on various factors such as herd size, annual income from livestock enterprise, age of respondent, etc., which can be considered while fixing the charges for veterinary services by the veterinary services providers in both public and private domain. The government may plan to charge for the quality veterinary services and may reduce some of the fiscal burden. The private veterinarians can also establish their clinic and provide the quality veterinary services to the livestock owners.
Acknowledgement
The authors are thankful to the anonymous referee for his valuable suggestions on the earlier draft of the paper.
References
Ahuja, V., Morrenhof, J. and Sen, A. (2003) The delivery of veterinary services to poorer communities: The case of rural Orissa, India. Revue Scientifique et Technique Office International des Epizooties, 3: 931-948. Cameron, T.A. and Huppert, D.D. (1989) OLS versus ML
estimation of non-market resource values with payment card interval data. Journal of Environmental Economics and Management, 17: 230-246.
Johannesson, M. and Jonsson, B. (1991) Economic evaluation in healthcare: Is there a case for cost-benefit analysis? Health Policy, 17: 1-23.
Kathiravan, M., Thirunavukkaraasu, M. and Michealraj, P. (2007) Willingness to pay for annual health care services in small ruminants: The case of south India. Journal of Applied Sciences, 7(16): 2361-2365.
Morey, E., Rossmann, K., Chestnut, L. and Ragland, S. (1997) Valuing Acid Deposition Injuries to Cultural Resources. On-line Discussion Paper, Prepared for National Acid Precipitation Assessment Program, Washington DC.
OIE (2010) http://www.oie.int/wahis/public.php?page= country_personnel.
O’Brien, S. and Viramontes, K. (1994) Do contingent valuation estimates pass a ‘scope’ test? A meta-analysis. Journal of Environmental Economics and Management, 31: 287-301.
Olsen, J.A. (1997) Aiding priority setting in health care: Is there a role for the contingent valuation method? Health Economics, 6: 603-612.
Prabaharan, R. (2000) Livestock –Research investment crucial. The Hindu Survey of Indian Agriculture, Chennai.
Russell, S., Fox-Rushby, J. and Arhin, D. (1995) Willingness and ability to pay for health care: A selection of methods and issues. Health Policy and Planning,10: 94-101. Singh, R., Birthal, P.S. and Rathore, B.S. (1998) Review of
animal health service in India. Indian Journal of Animal Sciences, 68(5): 420-424.
Stalhammar, N. (1996) An empirical note on willingness to pay and starting point bias. Medical Decision Making,
16: 242-247.
Received: May 2010; Accepted: October 2010